
Concepts and Jetpack Compose implementation
Metrics are the main type of information extracted from your benchmarks. They
are passed to the measureRepeated function as a List, which lets you
specify multiple measured metrics at once. At least one type of metric is
required for the benchmark to run.
The following code snippet captures frame timing and custom trace section metrics:
Kotlin
benchmarkRule.measureRepeated(
    packageName = TARGET_PACKAGE,
    metrics = listOf(
        FrameTimingMetric(),
        TraceSectionMetric("RV CreateView"),
        TraceSectionMetric("RV OnBindView"),
    ),
    iterations = 5,
    // ...
)
Java
benchmarkRule.measureRepeated(
    TARGET_PACKAGE,     // packageName
    Arrays.asList(      // metrics
        new StartupTimingMetric(),
        new TraceSectionMetric("RV CreateView"),
        new TraceSectionMetric("RV OnBindView"),
    ),
    5,                  // Iterations
    // ...
);
In this example, RV CreateView and RV OnBindView are the IDs of
traceable blocks that are defined in RecyclerView. The source code for
the createViewHolder() method is an example of how you can define
traceable blocks within your own code.
StartupTimingMetric, TraceSectionMetric, and
FrameTimingMetric are covered in detail later in this document. For a
full list of metrics, check out subclasses of Metric.
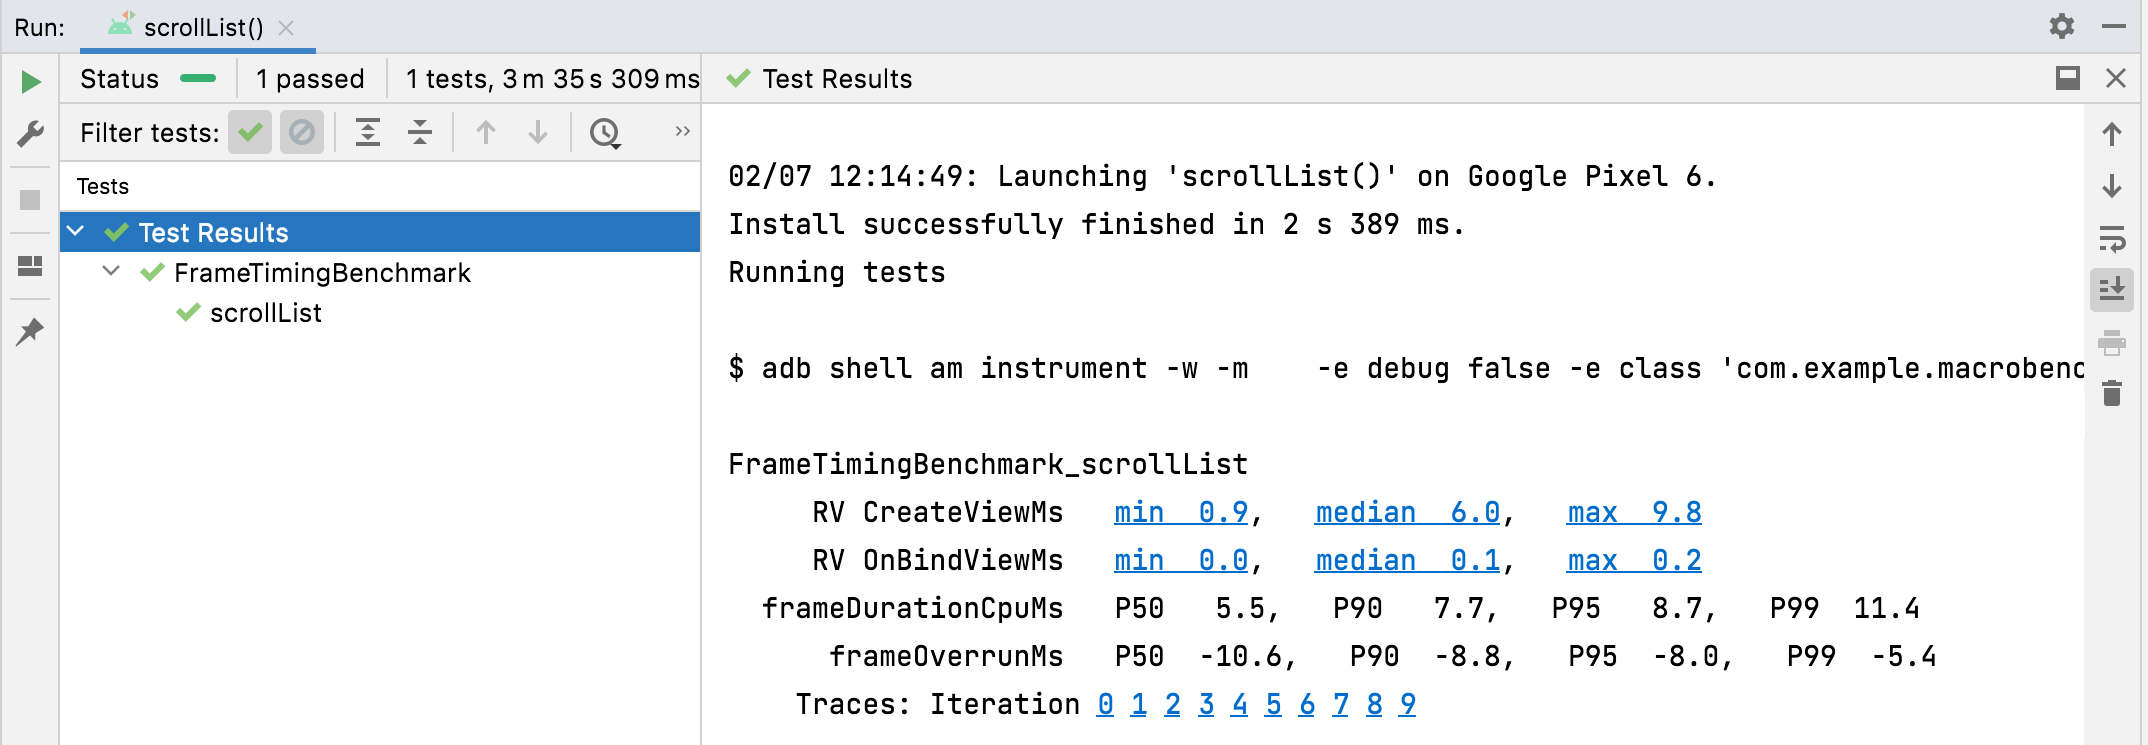
Benchmark results are output to Android Studio, as shown in figure 1. If multiple metrics are defined, all of them are combined in the output.
TraceSectionMetric and
FrameTimingMetric.StartupTimingMetric
StartupTimingMetric captures app startup timing metrics with the
following values:
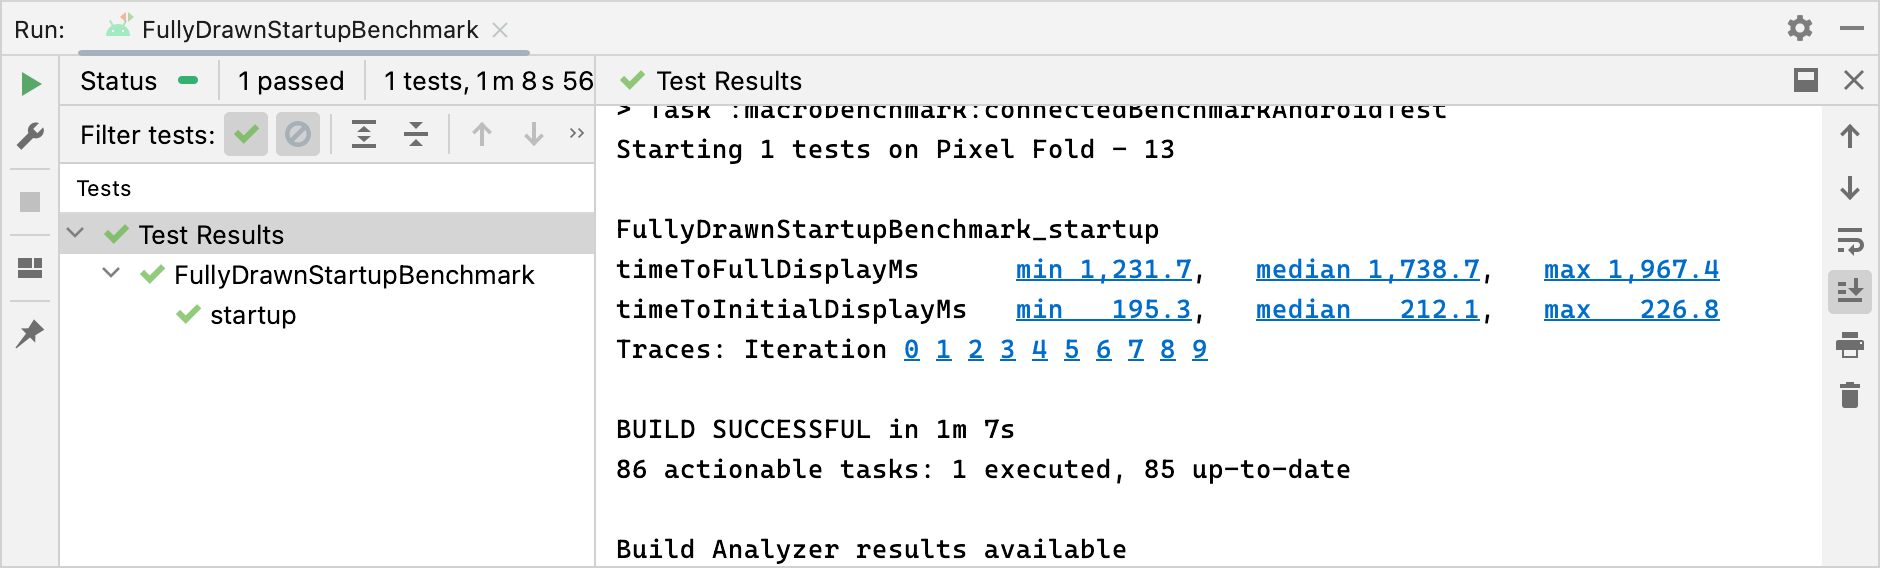
timeToInitialDisplayMs: The amount of time from when the system receives a launch intent to when it renders the first frame of the destinationActivity.timeToFullDisplayMs: The amount of time from when the system receives a launch intent to when the app reports fully drawn using thereportFullyDrawn()method. The measurement stops at the completion of rendering the first frame after—or containing—thereportFullyDrawn()call. This measurement might not be available on Android 10 (API level 29) and earlier.
StartupTimingMetric outputs the minimum, median, and maximum values from the
startup iterations. To assess startup improvement, always focus on median
values, since they provide the best estimate of typical user startup times. For
more information about what contributes to app startup time, see App startup
time.
StartupTimingMetric results.FrameTimingMetric
FrameTimingMetric captures timing information from frames produced by a
benchmark, such as scrolling or animation, and outputs the following values:
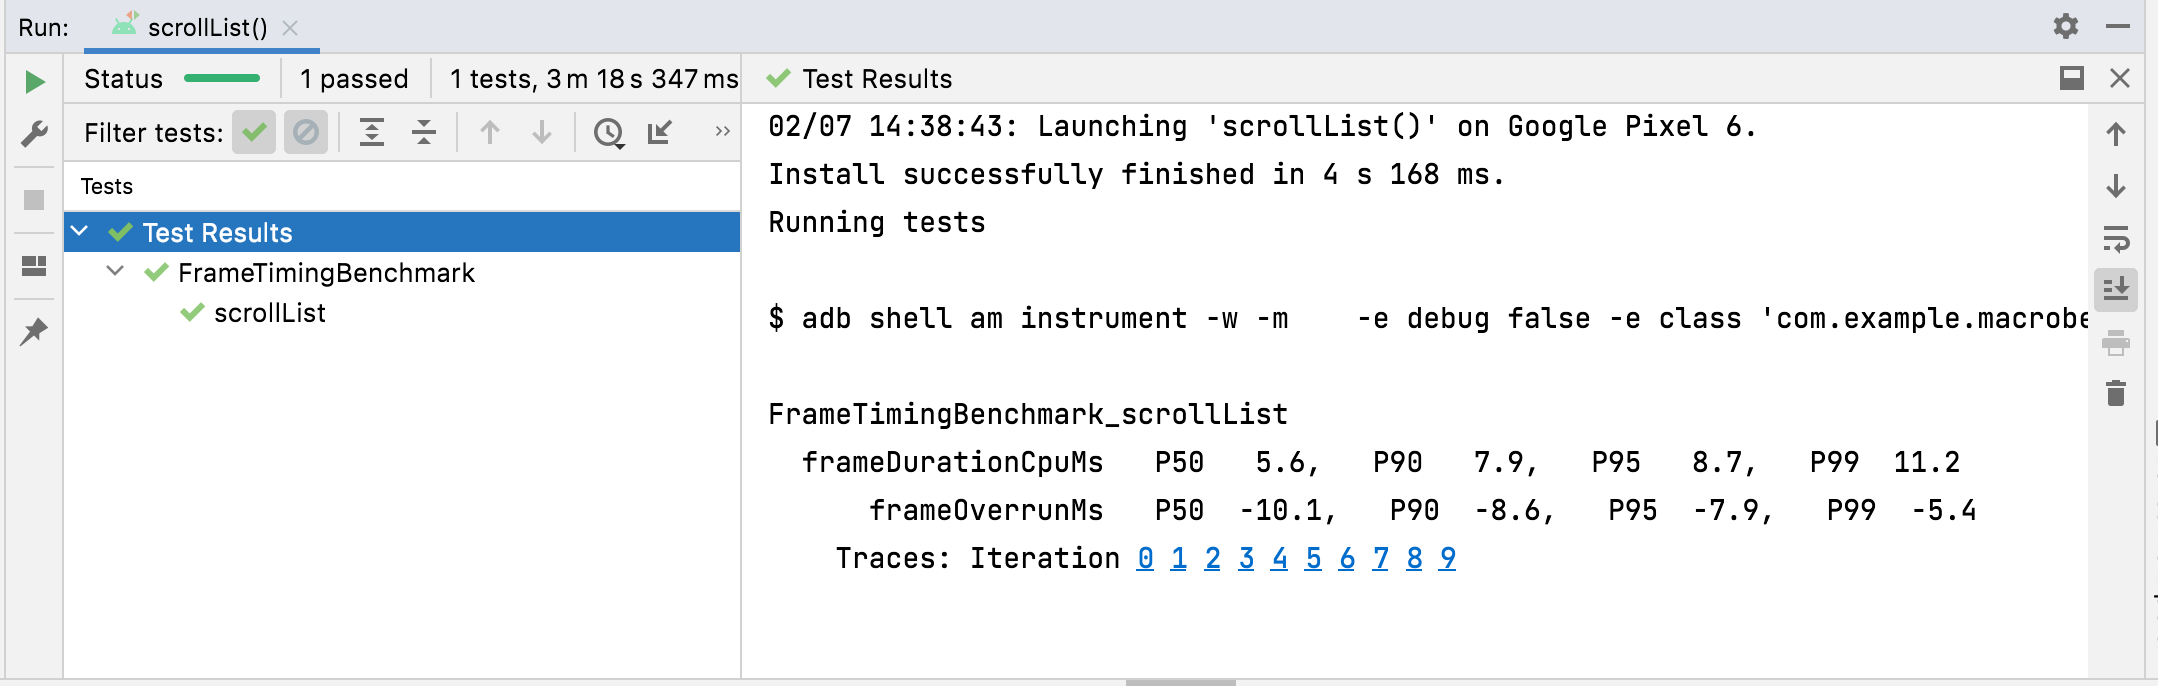
frameOverrunMs: the amount of time a given frame misses its deadline by. Positive numbers indicate a dropped frame accompanied by visible jank or stutter. Negative numbers indicate how much faster a frame completed relative to the subsystem hardware deadline. Note: This metric is available only on Android 12 (API level 31) and later.frameDurationCpuMs: the amount of time the frame takes to be produced on the CPU on both the UI thread and theRenderThread.
These measurements are collected in a distribution of 50th, 90th, 95th, and 99th percentile.
For more information on how to identify and improve slow frames, see Slow rendering.
FrameTimingMetric results.TraceSectionMetric
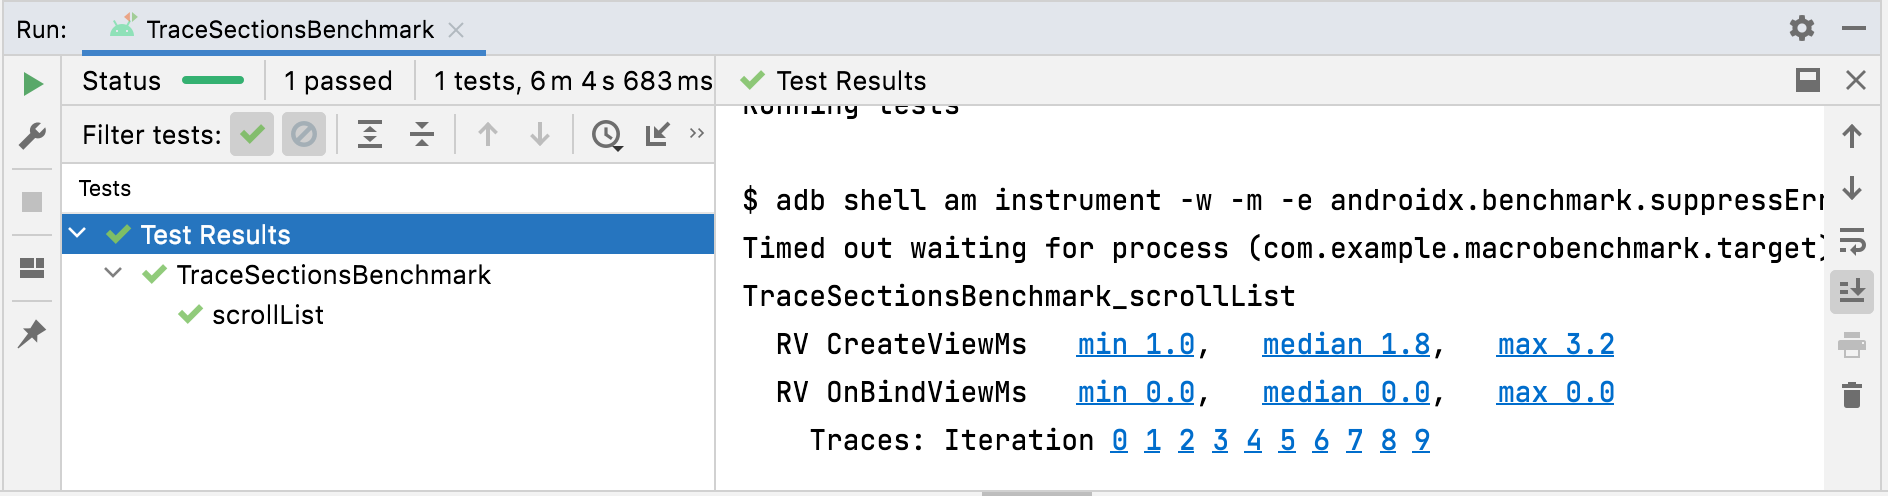
TraceSectionMetric captures the number of times a specific trace section
occurs and the absolute amount of time it takes to execute. For time tracking,
it outputs the minimum, median, and maximum times in milliseconds.
The target trace section is defined either by the function call
trace(sectionName) or the lower-level block boundaries between
Trace.beginSection(sectionName) and Trace.endSection() or their
async variants. It always selects the first instance of a trace section captured
during a measurement. It only outputs trace sections from your package by
default; to include processes outside your package, set targetPackageOnly =
false.
For more information about tracing, see Overview of system tracing and Define custom events.
TraceSectionMetric results.Recommended for you
- Note: link text is displayed when JavaScript is off
- Create Baseline Profiles {:#creating-profile-rules}
- Writing a Macrobenchmark
- App startup analysis and optimization {:#app-startup-analysis-optimization}