
The network traffic generated by an app can have a significant impact on the battery life of the device. To optimize that traffic, you need to measure it and identify its source. Network requests can come directly from a user action, from your own app code, or from a server communicating with your app.
This topic shows you how to monitor and categorize your network traffic, and provides guidance on identifying and resolving issues.
Use the Network Profiler to monitor requests
Use the Network Profiler to track your application’s network requests. You can monitor how and when your app transfers data and optimize the underlying code appropriately.
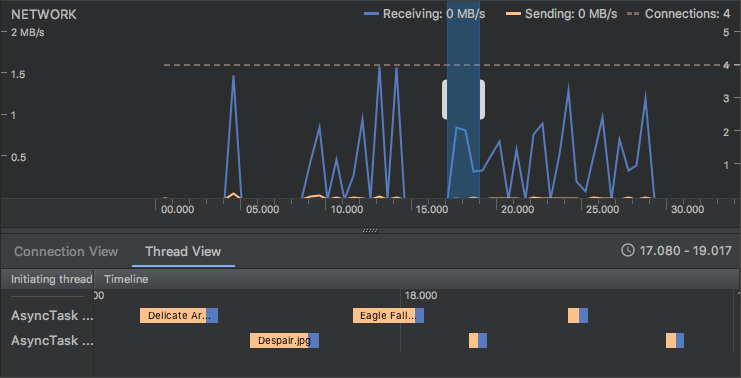
Figure 1. Tracking network traffic. The network traffic pattern suggests
that efficiency could be dramatically improved by prefetching requests or
bundling uploads.
By monitoring the frequency of your data transfers and the amount of data transferred during each connection, you can identify areas of your application that can be made more battery-efficient. Generally, you will be looking for short spikes that can be delayed.
To better identify the cause of transfer spikes, the Traffic Stats API enables
you to tag the data transfers occurring from a socket within a given thread
using
TrafficStats.setThreadStatsTag().
Calling this function doesn't automatically tag all traffic for a particular
thread; the tags have to be applied to the sockets.
Once the thread tag is set, you can manually tag and untag individual sockets
using
TrafficStats.tagSocket()
and
TrafficStats.untagSocket().
A tag is also applied if a socket is opened on the thread, or if a server socket
accepts a connection.
Concurrent access to the same socket by multiple threads will use whatever tag the socket had when the network packets were sent or received (which may be different from when the user wrote or read the data, due to buffering and retransmits).
For example, you can define constants to represent different types of network traffic, as shown in the following code sample:
Kotlin
const val USER_INITIATED = 0x1000
const val APP_INITIATED = 0x2000
const val SERVER_INITIATED = 0x3000
Java
public static final int USER_INITIATED = 0x1000;
public static final int APP_INITIATED = 0x2000;
public static final int SERVER_INITIATED = 0x3000;
You can then tag your network requests accordingly:
Kotlin
TrafficStats.setThreadStatsTag(USER_INITIATED)
TrafficStats.tagSocket(outputSocket)
// Transfer data using socket
TrafficStats.untagSocket(outputSocket)
Java
TrafficStats.setThreadStatsTag(USER_INITIATED);
TrafficStats.tagSocket(outputSocket);
// Transfer data using socket
TrafficStats.untagSocket(outputSocket);
The HttpURLConnection
library automatically tags sockets based on the current
TrafficStats.getThreadStatsTag()
value. The library also tags and untags sockets when recycled through
keep-alive pools as shown in the following code sample:
Kotlin
class IdentifyTransferSpikeTask {
    @WorkerThread
    fun request(url: String) {
        TrafficStats.setThreadStatsTag(APP_INITIATED)
        // Make network request using HttpURLConnection.connect()
        ...
        TrafficStats.clearThreadStatsTag()
    }
}
Java
public class IdentifyTransferSpikeTask {
    @WorkerThread
    public void request(String url) {
        TrafficStats.setThreadStatsTag(APP_INITIATED);
        // Make network request using HttpURLConnection.connect()
        ...
        TrafficStats.clearThreadStatsTag();
    }
}
Analyze network traffic types
When you look at the network traffic generated by your app, you need to understand the source of the traffic so you can optimize it appropriately. Frequent network activity generated by your app may be entirely appropriate if it is responding to user actions, but completely inappropriate if your app is not in the foreground or if the device is in a pocket or purse.
Analyze user-initiated traffic
User-initiated network traffic may be efficiently grouped together while a user is performing a specific task within your app, or spread out unevenly as the user requests additional information your app needs to get. Your goal in analyzing user-initiated network traffic is to look for patterns of frequent network use over time and attempt to decrease their frequency by grouping requests together.
The unpredictability of user requests makes it challenging to optimize this type of network use in your app. In addition, users expect fast responses when they are actively using an app, so delaying requests for efficiency can lead to poor user experiences. In general, you should prioritize a quick response to the user over efficient use of the network while a user is directly interacting with your app.
For recommendations to optimize user-initiated traffic, see Optimize user-initiated requests.
Analyze app-initiated traffic
App-initiated network traffic is typically an area where you can have a significant impact on the efficient use of network bandwidth. In analyzing the network activity of your app, look for periods of inactivity and determine if they can be increased. If you see patterns of consistent network access from your app, try to batch this traffic to allow the device radio to switch back into low-power mode between periods of activity.
For recommendations to optimize app-initiated traffic, see Optimize app-initiated requests.
Analyze server-initiated traffic
Network activity initiated by servers communicating with your app is also typically an area where you can have a significant impact on the efficient use of network bandwidth. Firebase Cloud Messaging (FCM) is a lightweight mechanism used to transmit data from a server to a particular app instance. Using FCM, your server can notify your app running on a particular device that there is new data available for it.
For recommendations to optimize server-initiated traffic, see Optimize server-initiated requests.
Use Battery Historian to visualize network traffic effects
Battery Historian is a tool that visualizes a device’s battery consumption over a period of time. You can use this tool to analyze how your network activity affects battery consumption. For example, Battery Historian can show you whether your app is using the cellular radio more frequently than you expect. For more information about using the Battery Historian, see Profile battery usage with Batterystats and Battery Historian.