
1. Before you begin
This codelab shows how to generate Baseline Profiles to optimize the performance of your application and how to verify the performance benefits of using Baseline Profiles.
What you'll need
- Android Studio Hedgehog (2023.1.1) or newer
- Android Gradle Plugin 8.0 or higher
- Basic understanding of Jetpack Macrobenchmark
- A physical Android device with Android 7 (API level 24) or higher
What you'll do
- Set up the project to use Baseline Profiles generators.
- Generate Baseline Profiles to optimize app startup and scrolling performance.
- Verify the performance gains with the Jetpack Macrobenchmark library.
What you'll learn
- Baseline Profiles and how they can improve the app's performance.
- How to generate Baseline Profiles.
- Performance gains of Baseline Profiles.
2. Getting set up
To get started, clone the Github repository from the command line by using the following command:
$ git clone https://github.com/android/codelab-android-performance.git
Alternatively, you can download two zip files:
Open Project in Android Studio
- In the Welcome to Android Studio window, select
 Open an Existing Project.
 - Select the folder
[Download Location]/codelab-android-performance/baseline-profiles. Make sure you select thebaseline-profilesdirectory. - When Android Studio imports the project, ensure you can run the
appmodule to build the sample application you work with later.
The sample app
In this codelab, you work with the JetSnack sample application. It's a virtual snack ordering app that uses Jetpack Compose.
To measure the performance of the application, you need to understand the structure of the UI and how the app behaves, so that you can access the UI elements from the benchmarks. Run the app and get familiar with the basic screens by ordering snacks. You don't need to know the details of how the app is architected.

3. What are Baseline Profiles
Baseline Profiles improve code execution speed by about 30% from the first launch by avoiding interpretation and just-in-time (JIT) compilation steps for included code paths. By shipping a Baseline Profile in an app or library, Android Runtime (ART) can optimize included code paths through Ahead of Time (AOT) compilation, providing performance enhancements for every new user and on every app update. This profile-guided optimization (PGO) lets apps optimize startup, reduce interaction jank, and improve overall runtime performance for end users from the first launch.
With a Baseline Profile, all user interactions—such as app startup, navigating between screens, or scrolling through content—are smoother from the first time they run. Increasing the speed and responsiveness of an app leads to more daily active users and a higher average return visit rate.
Baseline Profiles help guide optimization beyond app startup by providing common user interactions that improve app runtime from the first launch. Guided AOT compilation doesn't rely on user devices and can be done once per release on a development machine instead of a mobile device. By shipping releases with a Baseline Profile, app optimizations become available much faster than by relying on Cloud Profiles alone.
When not using a Baseline Profile, all app code is JIT compiled in memory after being interpreted or into an odex file in the background when the device is idle. Users might then have a suboptimal experience when running an app after installing or updating it for the first time before the new paths are optimized.
4. Set up the Baseline Profile generator module
You can generate Baseline Profiles with an instrumentation test class that requires a new Gradle module to be added to your project. The easiest way to add it to your project is with the Android Studio module wizard that comes with Android Studio Hedgehog or higher.
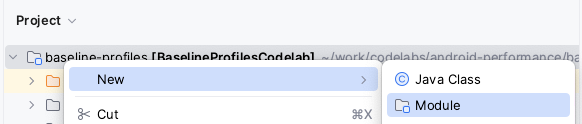
Open the new module wizard window by right-clicking your project or module in the Project panel and select New > Module.
From the opened window, select Baseline Profile Generator from the Templates pane.
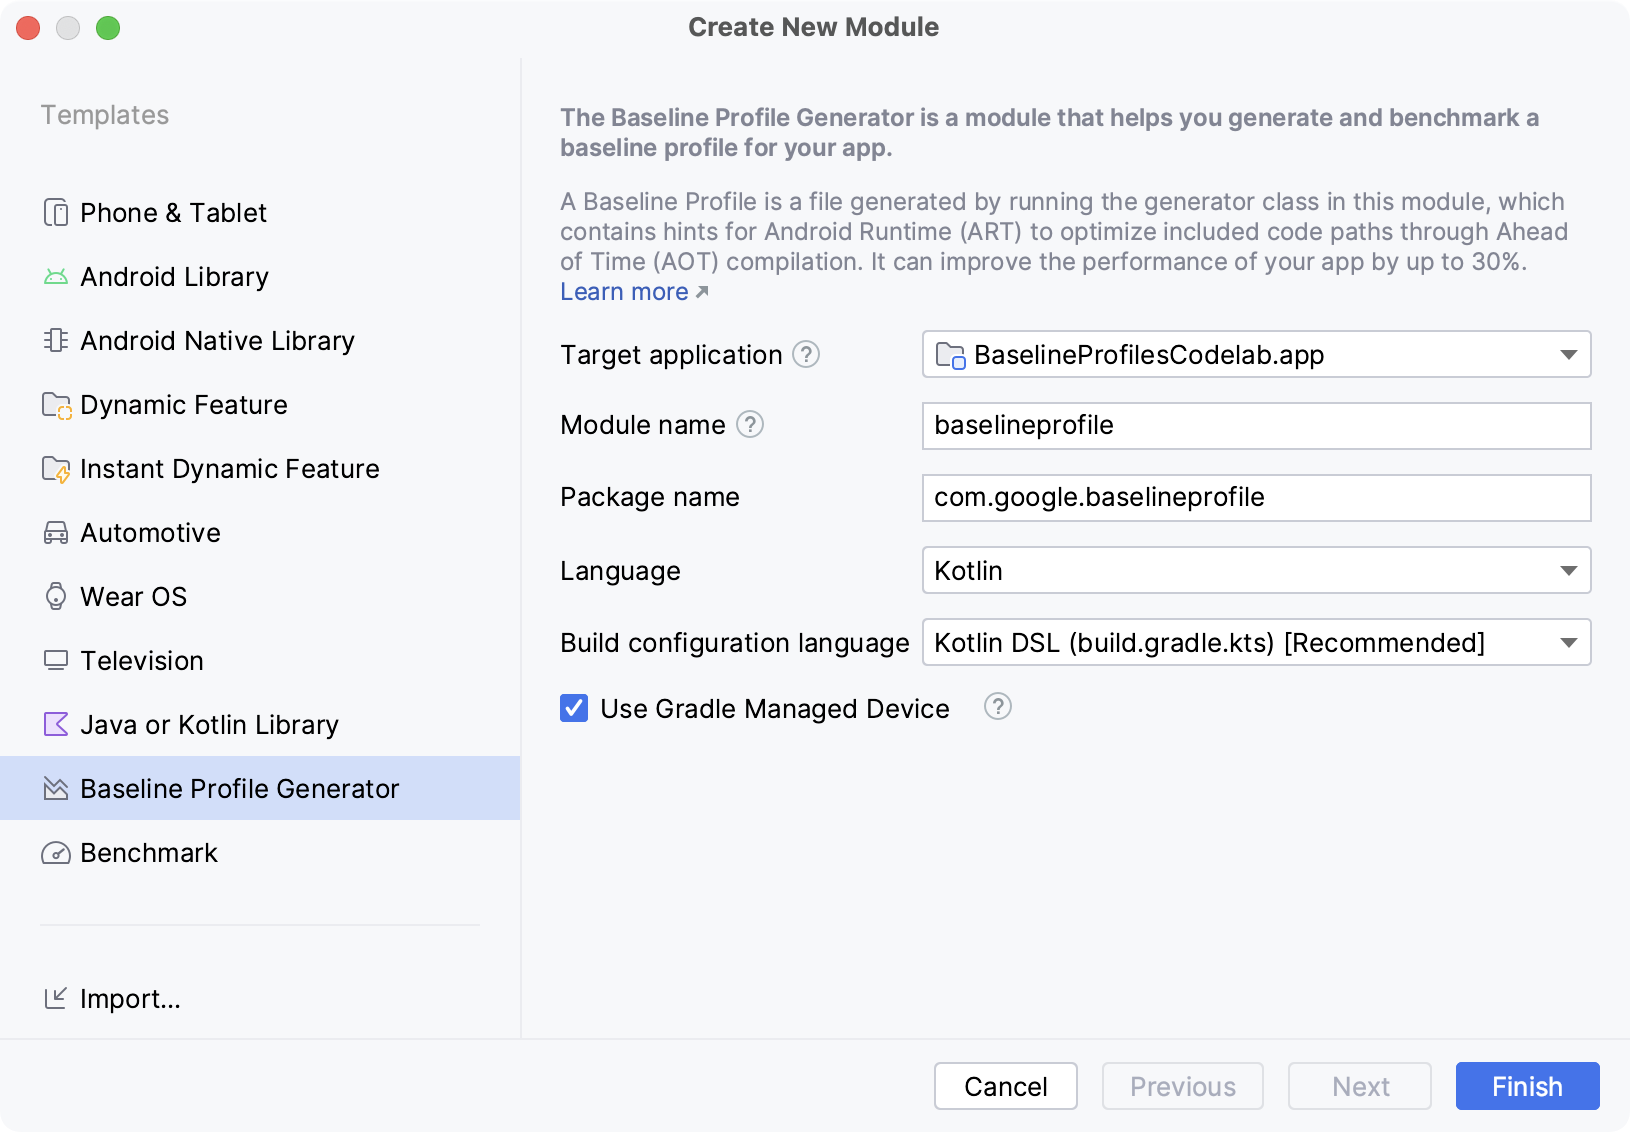
Besides the usual parameters like module name, package name, language, or build configuration language, there are two inputs that aren't usual for a new module: Target application and Use Gradle Managed Device.
Target application is the app module that is used to generate Baseline Profiles for. If you have more than one app module in your project, select which one you want to run the generators for.
The Use Gradle Managed Device checkbox sets the module to run the Baseline Profile generators on automatically managed Android emulators. You can read more about Gradle Managed Devices in Scale your tests with Gradle Managed Devices. If you uncheck this, the generators use any connected device.
Once you define all the details about the new module, click Finish to proceed with the module creation.
Changes made by the module wizard
The module wizard makes several changes to your project.
It adds a Gradle module named baselineprofile or the name you select in the wizard.
This module uses the com.android.test plugin, which tells Gradle not to include it in your application, so it can only contain testing code or benchmarks. It also applies androidx.baselineprofile plugin, which allows automating generating Baseline Profiles.
The wizard also makes changes to the target application module you select. Specifically, it applies androidx.baselineprofile plugin, adds androidx.profileinstaller dependency, and adds baselineProfile dependency to the newly created module build.gradle(.kts):
plugins {
  id("androidx.baselineprofile")
}

dependencies {
  // ...
  implementation("androidx.profileinstaller:profileinstaller:1.3.0")
  "baselineProfile"(project(mapOf("path" to ":baselineprofile")))
}
Adding the androidx.profileinstaller dependency lets you do the following:
- Locally verify performance gains of the generated Baseline Profiles.
- Use Baseline Profiles on Android 7 (API level 24) and Android 8 (Api level 26), which don't support Cloud profiles.
- Use Baseline Profiles on devices that don't have Google Play Services.
The baselineProfile(project(":baselineprofile")) dependency lets Gradle know from which module it needs to take the generated Baseline Profiles.
Now that you have the project set, write a Baseline Profiles generator class.
5. Write a Baseline Profile generator
Usually, you generate Baseline Profiles for the typical user journeys of your app.
The module wizard creates a basic BaselineProfileGenerator test class that is capable of generating the Baseline Profile for your app startup and looks as follows:
@RunWith(AndroidJUnit4::class)
@LargeTest
class BaselineProfileGenerator {

    @get:Rule
    val rule = BaselineProfileRule()

    @Test
    fun generate() {
        rule.collect("com.example.baselineprofiles_codelab") {
            // This block defines the app's critical user journey. This is where you
            // optimize for app startup. You can also navigate and scroll
            // through your most important UI.

            // Start default activity for your app.
            pressHome()
            startActivityAndWait()

            // TODO Write more interactions to optimize advanced journeys of your app.
            // For example:
            // 1. Wait until the content is asynchronously loaded.
            // 2. Scroll the feed content.
            // 3. Navigate to detail screen.

            // Check UiAutomator documentation for more information about how to interact with the app.
            // https://d.android.com/training/testing/other-components/ui-automator
        }
    }
}
This class uses a BaselineProfileRule test rule and contains one test method for generating the profile. The entrypoint for generating the profile is the collect() function. It requires only two parameters:
packageName: the package of your app.profileBlock: the last lambda parameter.
In the profileBlock lambda, you specify the interactions that cover the typical user journeys of your app. The library runs the profileBlock several times, collects the called classes and functions, and generates the Baseline Profile on device with the code to be optimized.
By default, the created generator class contains interactions to start your default Activity and waits until the first frame of your app is rendered using startActivityAndWait() method.
Extend the generator with custom journeys
You can see the generated class also includes some TODO to write more interactions to optimize advanced journeys of your app. This is recommended so that you can optimize performance beyond the app start.
In our sample app, you can identify these journeys by doing the following:
- Start the application. This is already partially covered by the generated class.
- Wait until the content is asynchronously loaded.
- Scroll the snack list.
- Go to snack detail.
Change the generator to contain the outlined functions that cover the typical journeys in the following snippet:
// ...
rule.collect("com.example.baselineprofiles_codelab") {
    // This block defines the app's critical user journey. This is where you
    // optimize for app startup. You can also navigate and scroll
    // through your most important UI.

    // Start default activity for your app.
    pressHome()
    startActivityAndWait()

    // TODO Write more interactions to optimize advanced journeys of your app.
    // For example:
    // 1. Wait until the content is asynchronously loaded.
    waitForAsyncContent()
    // 2. Scroll the feed content.
    scrollSnackListJourney()
    // 3. Navigate to detail screen.
    goToSnackDetailJourney()

    // Check UiAutomator documentation for more information about how to interact with the app.
    // https://d.android.com/training/testing/other-components/ui-automator
}
// ...
Now, write interactions for each mentioned journey. You can write it as the extension function of the MacrobenchmarkScope so you have access to the parameters and functions it provides. Writing it this way lets you reuse the interactions with the benchmarks to verify the performance gains.
Wait for asynchronous content
Many apps have some sort of asynchronous loading on app startup, also known as a fully displayed state, which tells the system when the content is loaded and rendered, and the user can interact with it. Wait for the state in the generator (waitForAsyncContent) with these interactions:
- Find the feed snack list.
- Wait until some items within the list are visible on screen.
fun MacrobenchmarkScope.waitForAsyncContent() {
   device.wait(Until.hasObject(By.res("snack_list")), 5_000)
   val contentList = device.findObject(By.res("snack_list"))
   // Wait until a snack collection item within the list is rendered.
   contentList.wait(Until.hasObject(By.res("snack_collection")), 5_000)
}
Scrolling list journey
For the scrolling snack list journey (scrollSnackListJourney), you can follow these interactions:
- Find the snack list UI element.
- Set the gesture margins to not trigger the system navigation.
- Scroll the list and wait until the UI settles.
fun MacrobenchmarkScope.scrollSnackListJourney() {
   val snackList = device.findObject(By.res("snack_list"))
   // Set gesture margin to avoid triggering gesture navigation.
   snackList.setGestureMargin(device.displayWidth / 5)
   snackList.fling(Direction.DOWN)
   device.waitForIdle()
}
Go to detail journey
The last journey (goToSnackDetailJourney) implements these interactions:
- Find the snack list and all snack items that you can work with.
- Select an item from the list.
- Click on the item and wait until the detail screen is loaded. You can leverage the fact that the snack list won't be on screen anymore.
fun MacrobenchmarkScope.goToSnackDetailJourney() {
    val snackList = device.findObject(By.res("snack_list"))
    val snacks = snackList.findObjects(By.res("snack_item"))
    // Select snack from the list based on running iteration.
    val index = (iteration ?: 0) % snacks.size
    snacks[index].click()
    // Wait until the screen is gone = the detail is shown.
    device.wait(Until.gone(By.res("snack_list")), 5_000)
}
After you define all the interactions needed for your Baseline Profile generator to be ready to run, you need to define the device it runs on.
6. Prepare a device to run the generator on
To generate Baseline Profiles, we recommend either using an emulator such as a Gradle Managed Device or a device running Android 13 (API 33) or higher.
To make the process reproducible and automate generating Baseline Profiles, you can use Gradle Managed Devices. Gradle Managed Devices lets you run tests on an Android emulator without needing to manually launch it and tear it down. You can learn more about Gradle Managed Devices in Scale your tests with Gradle Managed Devices.
To define a Gradle Managed Device, add its definition to the :baselineprofile module build.gradle.kts file as shown in the following snippet:
android {
  // ...

  testOptions.managedDevices.devices {
    create<ManagedVirtualDevice>("pixel6Api31") {
        device = "Pixel 6"
        apiLevel = 31
        systemImageSource = "aosp"
    }
  }
}
In this case, we use Android 11 (API level 31) and the aosp system image is capable of rooted access.
Next, configure the Baseline Profile Gradle Plugin to use the defined Gradle Managed Device. To do so, add the name of the device into the managedDevices property and disable useConnectedDevices as shown in the following snippet:
android {
  // ...
}

baselineProfile {
   managedDevices += "pixel6Api31"
   useConnectedDevices = false
}

dependencies {
  // ...
}
Next, generate the Baseline Profile.
7. Generate the Baseline Profile
Once the device is ready, you can create the Baseline Profile. The Baseline Profile Gradle plugin creates Gradle tasks to automate the whole process of running the generator test class and applying the generated baseline profiles into your app.
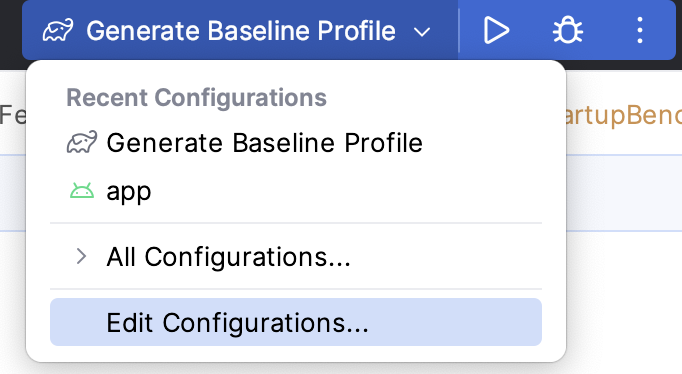
The new module wizard created run configuration to be able to quickly run the Gradle task with all necessary parameters to run without the need to switch between terminal and Android Studio
To run it, locate the Generate Baseline Profile run configuration and click the Run button  .
.
The task starts the emulator image defined earlier. Run the interactions from the BaselineProfileGenerator test class several times, and afterwards tear down the emulator and provide the output to the Android Studio.
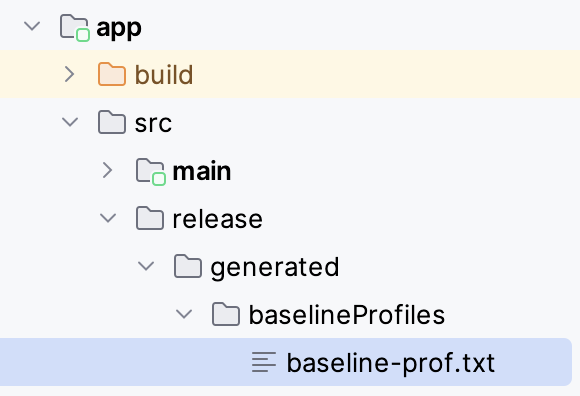
Once the generator finishes with success, the Gradle plugin automatically puts the generated baseline-prof.txt into your target application (:app module) in the src/release/generated/baselineProfile/ folder.
(Optional) Run the generator from the command line
Alternatively, you can run the generator from the command line. You can leverage the task created by the Gradle Managed Device—:app:generateBaselineProfile. This command runs all tests in the project defined by the baselineProfile(project(:baselineProfile)) dependency. Because the module also contains benchmarks for later verification of the performance gains, those tests fail with a warning against running benchmarks on an emulator.
android
   .testInstrumentationRunnerArguments
   .androidx.benchmark.enabledRules=BaselineProfile
For this, you can filter all the Baseline Profiles generators with the following instrumentation runner argument and all the benchmarks are skipped:
The whole command looks as follows:
./gradlew :app:generateBaselineProfile -Pandroid.testInstrumentationRunnerArguments.androidx.benchmark.enabledRules=BaselineProfile
Distribute your app with Baseline Profiles
Once the Baseline Profile is generated and copied into the source code of your app, build the production version of your app as you normally do. You don't need to do anything extra to distribute the Baseline Profiles to your users. They are picked by Android Gradle Plugin during build and included in your AAB or APK. Next, upload the build into Google Play.
When users install the app or update the app from the previous version, the Baseline Profile is installed as well, resulting in better performance from the first run of the app.
The next step shows how to verify how much the app performance improves with Baseline Profiles.
8. (Optional) Customize generating Baseline Profiles
The Baseline Profiles Gradle Plugin includes options to customize how the profiles are generated to meet your specific needs. You can change the behavior with baselineProfile { } configuration block in build scripts.
The configuration block within the :baselineprofile module affects how to run the generators with the possibility to add managedDevices and decide whether to useConnectedDevices or Gradle Managed devices.
The configuration block within the :app target module decides where the profiles are saved or how they are generated. You can change the following parameters:
automaticGenerationDuringBuild: if enabled, you can generate the Baseline Profile when building the production release build. This is helpful when building on CI before shipping your app.saveInSrc: specifies whether the generated Baseline Profiles is stored in thesrc/folder. Alternatively, you can access the file from the:baselineprofilebuild folder.baselineProfileOutputDir: defines where to store the generated Baseline Profiles.mergeIntoMain: by default, Baseline Profiles are generated per build variant (product flavor and build type). If you want to merge all the profiles intosrc/main, you can do this by enabling this flag.filter: you can filter what classes or methods to include or exclude from the generated Baseline Profiles. This can be helpful for library developers that want only the code from the library included.
9. Verify startup performance improvements
After you generate the Baseline Profile and add it to your app, verify it has the effect you want on your app's performance.
The new module wizard creates a benchmark class called StartupBenchmarks. It contains a benchmark to measure app startup time and compares it to when the app uses Baseline Profiles.
The class looks as follows:
@RunWith(AndroidJUnit4::class)
@LargeTest
class StartupBenchmarks {

    @get:Rule
    val rule = MacrobenchmarkRule()

    @Test
    fun startupCompilationNone() =
        benchmark(CompilationMode.None())

    @Test
    fun startupCompilationBaselineProfiles() =
        benchmark(CompilationMode.Partial(BaselineProfileMode.Require))

    private fun benchmark(compilationMode: CompilationMode) {
        rule.measureRepeated(
            packageName = "com.example.baselineprofiles_codelab",
            metrics = listOf(StartupTimingMetric()),
            compilationMode = compilationMode,
            startupMode = StartupMode.COLD,
            iterations = 10,
            setupBlock = {
                pressHome()
            },
            measureBlock = {
                startActivityAndWait()

                // TODO Add interactions to wait for when your app is fully drawn.
                // The app is fully drawn when Activity.reportFullyDrawn is called.
                // For Jetpack Compose, you can use ReportDrawn, ReportDrawnWhen and ReportDrawnAfter
                // from the AndroidX Activity library.

                // Check the UiAutomator documentation for more information on how to
                // interact with the app.
                // https://d.android.com/training/testing/other-components/ui-automator
            }
        )
    }
}
It uses MacrobenchmarkRule that is capable of running benchmarks for your app and gathering performance metrics. The entry point for writing a benchmark is measureRepeated function from the rule.
It requires several parameters:
packageName:which application to measure.metrics: what type of information you want to measure during the benchmark.iterations: how many times the benchmark repeats.startupMode: how you want your application to start upon the start of your benchmark.setupBlock: what interactions with your app must happen before measuring.measureBlock: interactions with your app you want to measure during the benchmark.
The test class also contains two tests: startupCompilationeNone() and startupCompilationBaselineProfiles(), which calls the benchmark() function with different compilationMode.
CompilationMode
The CompilationMode parameter defines how the application is pre-compiled into machine code. It has the following options:
DEFAULT: partially pre-compiles the app using Baseline Profiles if available. This is used if nocompilationModeparameter is applied.None(): resets the app compilation state and doesn't pre-compile the app. Just-in-time compilation (JIT) is still enabled during execution of the app.Partial(): pre-compiles the app with Baseline Profiles or warm up runs, or both.Full(): pre-compiles the entire application code. This is the only option on Android 6 (API 23) and lower.
If you want to start optimizing your application performance, you can choose DEFAULT compilation mode, because the performance is similar to when the app is installed from Google Play. If you want to compare the performance benefits provided by Baseline Profiles, you can do it by comparing the results of compilation mode None and Partial.
Modify the benchmark to wait for content
The benchmarks are written similarly to the Baseline Profiles generators by writing interactions with your app. By default, the created benchmarks wait only for the first frame to be rendered—similar to how the BaselineProfileGenerator did—so we recommend improving it to wait for the asynchronous content.
You can do this by reusing the extension functions you write for the generator. Because this benchmark captures startup timings—by using StartupTimingMetric()—we recommend you only include waiting for the asynchronous content here and then write a separate benchmark for the other user journeys defined in the generator.
// ...
measureBlock = {
   startActivityAndWait()

   // The app is fully drawn when Activity.reportFullyDrawn is called.
   // For Jetpack Compose, you can use ReportDrawn, ReportDrawnWhen and ReportDrawnAfter
   // from the AndroidX Activity library.
   waitForAsyncContent() // <------- Added to wait for async content.

   // Check the UiAutomator documentation for more information on how to
   // interact with the app.
   // https://d.android.com/training/testing/other-components/ui-automator
}
Run the benchmarks
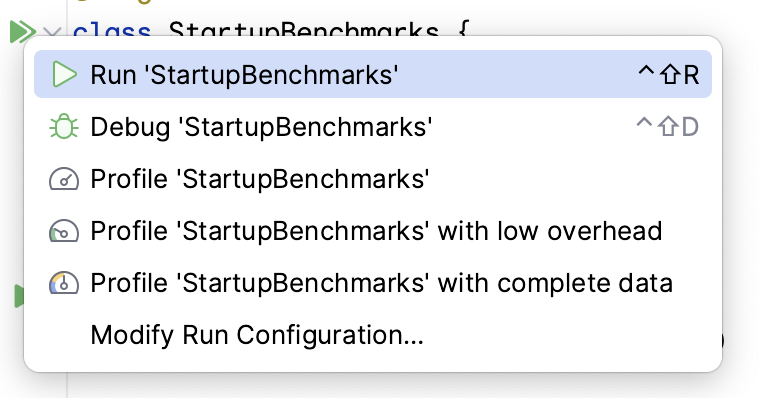
You can run the benchmarks the same way you run instrumented tests. You can run the test function, or the whole class with the gutter icon next to it.
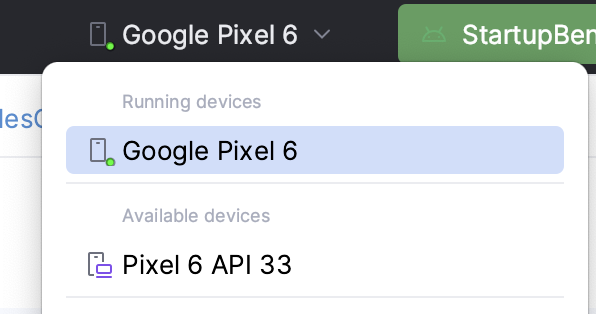
Make sure you have a physical device selected, because running benchmarks on Android emulator fails at runtime with a warning that the benchmark can give incorrect results. While you can technically run it on an emulator, you're measuring your host machine performance. If it is under heavy load, your benchmarks perform slower and inversely.
Once you run the benchmark, your app is rebuilt and then it runs your benchmarks. The benchmarks start, stop, and even reinstall your app several times based on the iterations you define.
After the benchmarks complete, you can see the timings in the Android Studio output as shown in the following screenshot:
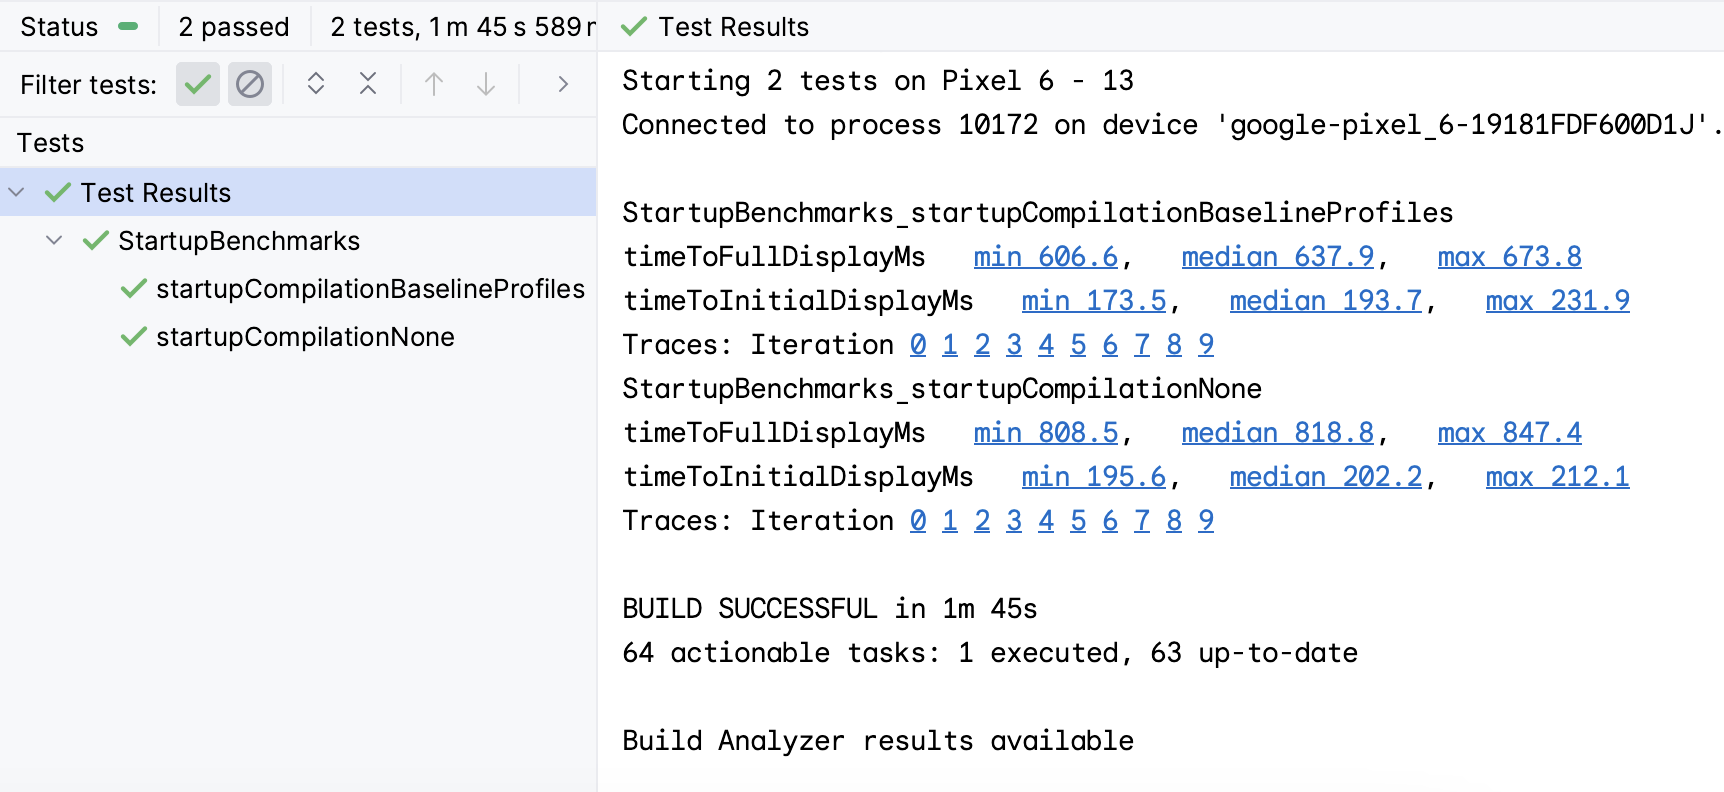
From the screenshot, you can see that the app startup time is different for each CompilationMode. The median values are shown in the following table:
timeToInitialDisplay [ms] | timeToFullDisplay [ms] | |
None | 202.2 | 818.8 |
BaselineProfiles | 193.7 | 637.9 |
Improvement | 4% | 28% |
The difference between compilation modes for timeToFullDisplay is 180ms, which is ~28% improvement by just having a Baseline Profile. The CompilationNone performs worse, because the device has to do the most JIT compiling during startup of the app. The CompilationBaselineProfiles performs better because partial compilation with Baseline Profiles AOT compiles the code the user is most likely to use and leaves the non-critical code not pre-compiled so it doesn't have to load immediately.
10. (Optional) Verify scrolling performance improvement
Similarly to the previous step, you can measure and verify the scrolling performance. First, create a ScrollBenchmarks test class with the benchmark rule and two test methods that use different compilation modes:
@LargeTest
@RunWith(AndroidJUnit4::class)
class ScrollBenchmarks {

   @get:Rule
   val rule = MacrobenchmarkRule()

   @Test
   fun scrollCompilationNone() = scroll(CompilationMode.None())

   @Test
   fun scrollCompilationBaselineProfiles() = scroll(CompilationMode.Partial())

   private fun scroll(compilationMode: CompilationMode) {
       // TODO implement
   }
}
From within the scroll method, use the measureRepeated function with the required parameters. For the metrics parameter, use FrameTimingMetric, which measures how long it takes to produce UI frames:
private fun scroll(compilationMode: CompilationMode) {
   rule.measureRepeated(
       packageName = "com.example.baselineprofiles_codelab",
       metrics = listOf(FrameTimingMetric()),
       compilationMode = compilationMode,
       startupMode = StartupMode.WARM,
       iterations = 10,
       setupBlock = {
           // TODO implement
       },
       measureBlock = {
           // TODO implement
       }
   )
}
This time, you need to split the interactions more between the setupBlock and measureBlock to only measure the frame durations during the first layout and scrolling the content. Therefore, put the functions that start the default screen to the setupBlock and the already-created extension functions waitForAsyncContent() and scrollSnackListJourney() to the measureBlock:
private fun scroll(compilationMode: CompilationMode) {
   rule.measureRepeated(
       packageName = "com.example.baselineprofiles_codelab",
       metrics = listOf(FrameTimingMetric()),
       compilationMode = compilationMode,
       startupMode = StartupMode.WARM,
       iterations = 10,
       setupBlock = {
           pressHome()
           startActivityAndWait()
       },
       measureBlock = {
           waitForAsyncContent()
           scrollSnackListJourney()
       }
   )
}
Once the benchmark is ready, you can run it as before to get results as shown in the following screenshot:
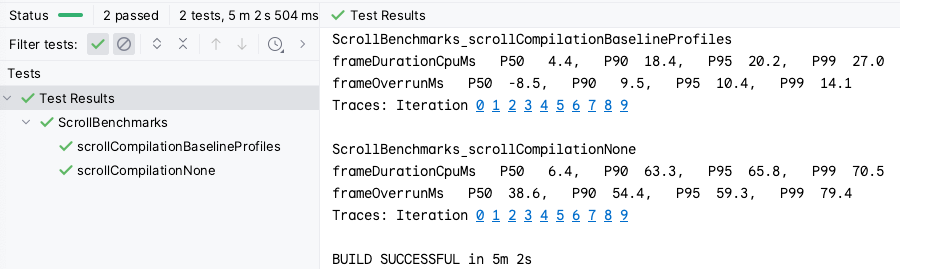
The FrameTimingMetric outputs duration of frames in milliseconds (frameDurationCpuMs) in the 50th, 90th, 95th, and 99th percentile. On Android 12 (API level 31) and higher, it also returns how much time your frames are over the limit (frameOverrunMs). The value can be negative, which means there was extra time left to produce the frame.
From the results, you can see that the CompilationBaselineProfiles has on average a shorter frame duration by 2ms, which might not be noticeable for users. However, for the other percentiles the results are more obvious. For P99, the difference is 43.5ms, which is more than 3 skipped frames on a device operating at 90 FPS. For example, for Pixel 6 it's 1000ms / 90 FPS = ~11ms max time to render a frame.
11. Congratulations
Congratulations, you successfully completed this codelab and improved the performance of your app with Baseline Profiles!
Additional resources
See the following additional resources:
- Inspect app performance with Macrobenchmark: codelab that goes more in depth with benchmarking.
- Performance samples: repository that contains Macrobenchmark and other performance samples.
- Now In Android sample app: a real-world application that uses benchmarking and Baseline Profiles to improve performance.