
The following are new features in Android Studio Bumblebee.
Support for KMP test execution
You can run tests for Kotlin Multiplatform (KMP) projects from Android Studio Bumblebee.
In order to ensure your tests run successfully from Android Studio, make sure you have all the requirements below:
- AGP 7.0.0-alpha08 or higher
- Gradle 6.8.2 or higher
- Kotlin plugin 1.4.30 or higher
New Device Manager
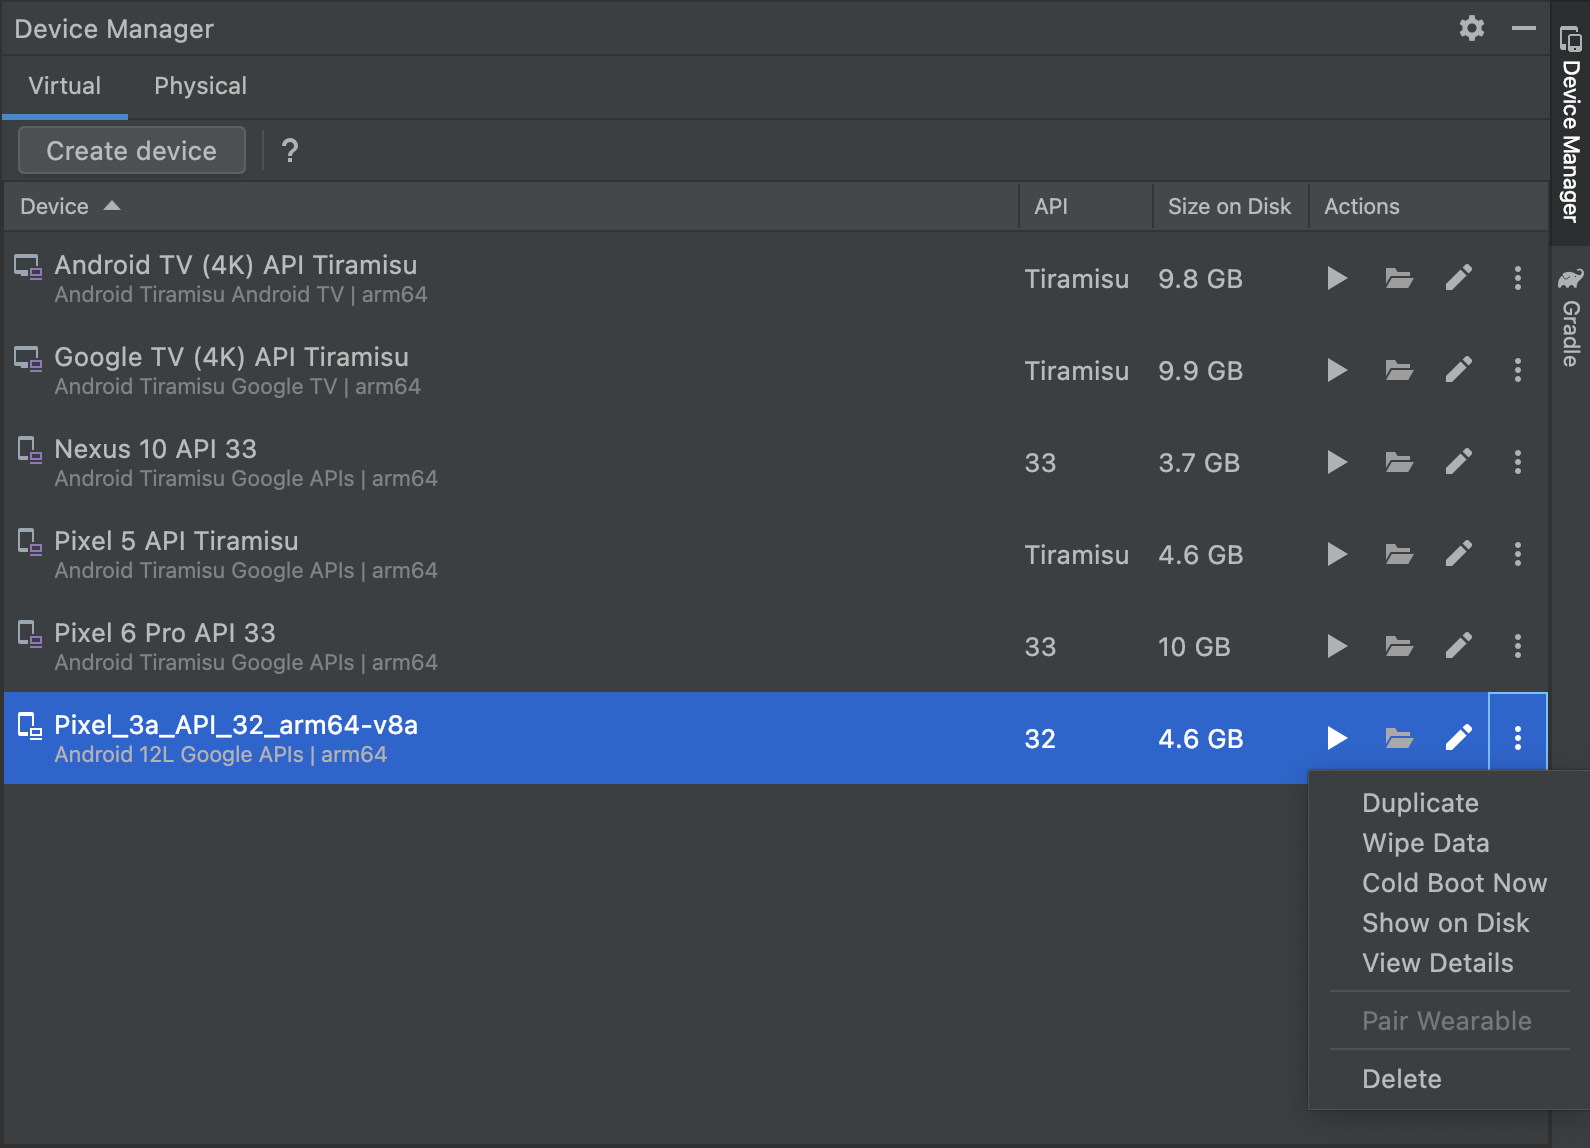
The Device Manager is a stand-in replacement for the AVD Manager, both from Android Studio’s Welcome Screen or after you open a project. The Device Manager introduces some new capabilities that make this feature more easy to create and manage all of your local test devices, such as:
- A more flexible UI that supports being docked in the IDE, floating, or in a separate window, like you can with other Android Studio tool windows. This gives you easier access to your devices without obstructing other windows of the IDE.
- A Virtual tab that allows you to create, manage, and deploy virtual devices; see details of each device at a glance; or quickly inspect the device in the Device File Explorer with a single click.
- A Physical tab that allows you to quickly pair to a new device using ADB Wifi and see details of each physical device at a glance. You can also quickly inspect each device’s file system using the Device File Explorer with a click of a button.
To open the new Device Manager, do one of the following:
- From the Android Studio Welcome screen, select More Actions > Virtual Device Manager.
- After opening a project, select View > Tool Windows > Device Manager from the main menu bar.
New in Layout Inspector
Capture layout hierarchy snapshots
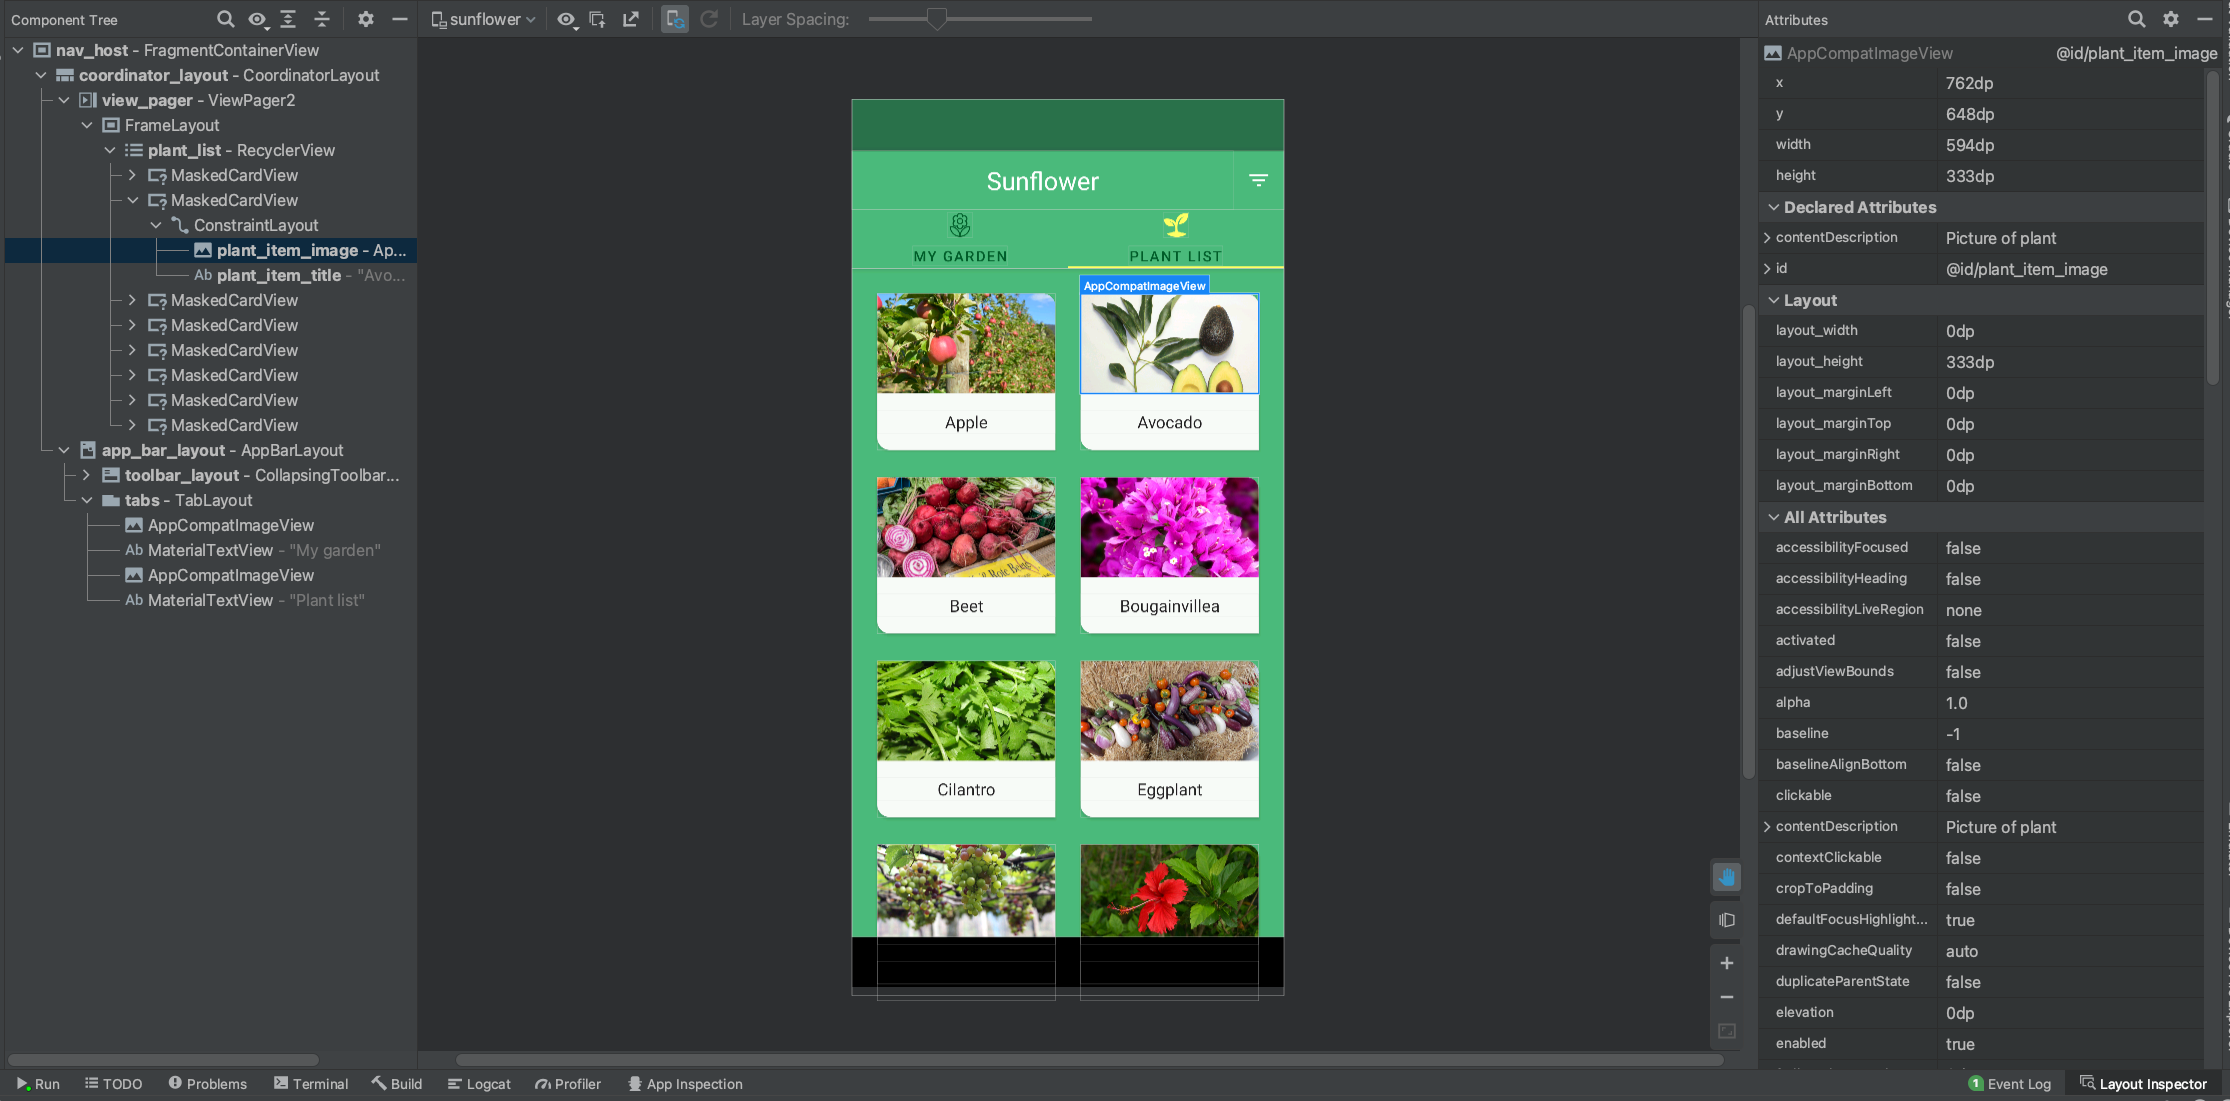
Layout Inspector now allows you to save snapshots of your running app’s layout hierarchy, so that you can easily share them with others or refer to them later.
Snapshots capture the data you would typically see when using the Layout Inspector, including a detailed 3D rendering of your layout, the component tree of your View, Compose, or hybrid layout, and detailed attributes for each component of your UI. To save a snapshot, do the following:
- Deploy your app to a device running API level 23 or higher
- Open the Layout Inspector by selecting View > Tool Windows > Layout Inspector.
- The Layout Inspector should connect to your app process automatically. If not, select the app process from the dropdown menu.
- When you want to capture a snapshot, click Export snapshot
 from the Layout Inspector
toolbar.
from the Layout Inspector
toolbar. - In the system dialog that appears, specify the name and location you want to
save your snapshot. Make sure to save the file with a
*.liextension.
You can then load a Layout Inspector snapshot by selecting File > Open from
the main menu bar, and opening a *.li file.
Support for inspecting Compose semantics
In Compose, Semantics describe your UI in an alternative manner that is understandable for Accessibility services and for the Testing framework. In Android Studio Bumblebee, you can now use the Layout Inspector to inspect semantic information in your Compose layouts.

When selecting a Compose node, use the Attributes window to check whether it declares semantic information directly, merges semantics from its children, or both. To quickly identify which nodes include semantics, either declared or merged, use select the View options dropdown in the Component Tree window and select Highlight Semantics Layers. This highlights only the nodes in the tree that include semantics, and you can use your keyboard to quickly navigate between them.
Avoid Activity restarts
Connecting the Layout Inspector to a running app on older versions of Android Studio would cause your app’s Activity to restart. This is required to set a device flag that enables inspection of your app’s layouts.
In Android Studio Bumblebee, you can avoid Activity restarts when connecting the Layout Inspector by setting this flag ahead of time using one of the following steps:
Enable a Run Configuration option
- Select Run > Edit Configurations from the main menu bar. The Run/Debug Configurations dialog appears.
- Navigate to the run configuration you would like to use.
- In the Layout Inspector options section, check the box next to Connect to Layout Inspector without restarting activity.
- Use the run configuration the next time you want to inspect your app using the Layout Inspector.
Set the flag from the command line:
- Open a terminal window on the machine that’s connected to your device
- Set the device flag for your app using the following command:
adb shell settings put global debug_view_attributes_application_package <my_package_name>- Deploy your app to the device and connect the Layout Inspector. Android Studio will check whether the flag is set and avoid restarting the Activity if possible.
Document Layout Inspector snapshots
You can now capture snapshots of your app’s layout hierarchy to save, share, or
inspect later. Snapshots capture the data you would typically see when using the
Layout Inspector, including a detailed 3D rendering of your layout, the
component tree of your View, Compose, or hybrid layout, and detailed attributes
for each component of your UI. When inspecting the layout of a live running app,
click Export snapshot ![]() from the Layout Inspector toolbar
and save the snapshot with an
from the Layout Inspector toolbar
and save the snapshot with an *.li extension. You can then load a Layout
Inspector snapshot by selecting File > Open from the main menu bar, and
opening a *.li file. The snapshot appears in a tab in the Editor window, so
that you can easily compare it with your running app.

New in App Inspection
In Android Studio Bumblebee, there are new tools and functionalities in the App Inspection window. You can open the App Inspector by selecting View > Tool Windows > App Inspection from the main menu bar.
Network Inspector
The Network Profiler in the Profilers tool window has now moved to the App Inspection tool window. If you’ve previously used the Network Profiler, all the same features and rich network traffic data is still available. Simply deploy your app to a device running API level 26 and higher and open the App Inspector > Network Inspector tab.
Inspect Jobs, Alarms, and Wakelocks
The Background Task Inspector now allows you to inspect your app’s Jobs, Alarms, and Wakelocks, in addition to the existing support for inspecting Workers. Each type of asynchronous task now appears under the appropriate heading in the inspector tab, allowing you to easily monitor its status and progress. Similar to Workers, you can select a Job, Alarm, or Wakelock to inspect its detailed information in the Task Details panel.
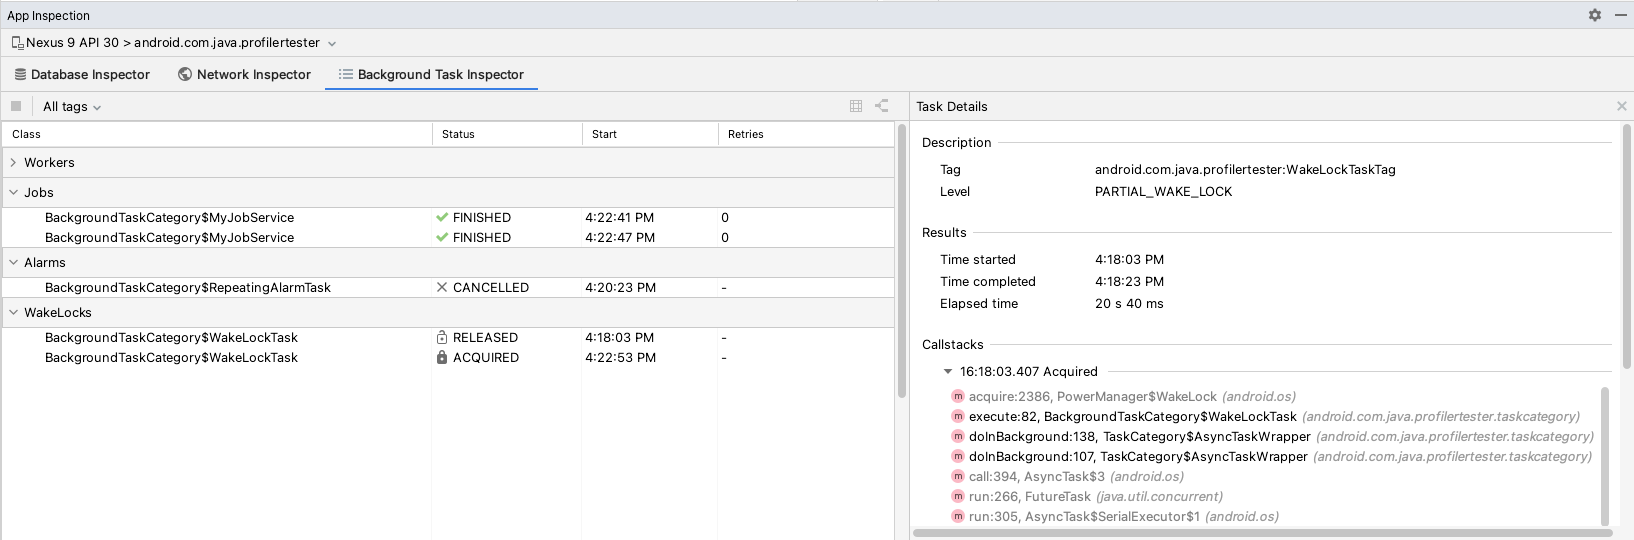
Because Workers use Jobs and Wakelocks under the hood, those tasks that are scheduled by Workers appear as children of each Worker. Keep in mind, you can only see Workers in the Graph mode.
New in Profilers
In Android Studio Bumblebee, there are new features that give you more insight into how your app uses resources. To profile your app, select View > Tool Windows > Profiler from the main menu bar.
Jank detection track
When profiling your app using devices running Android 11 (API level 30) or higher, the CPU profiler now shows a new group of tracks that illustrate the stages of each frame under Frame Lifecycle: Application, Wait for GPU, Composition and Frames on display. Each track labels the frames with a frame number and color-codes the rectangle to make it easy for you to visualize where a particular frame is in its lifecycle, along with guides you can toggle to compare with Vsync events. You can use this data to understand where jank might occur in your app and investigate the root causes. In the Analysis panel, there is now a Frames tab, which conveniently summarizes rendering information for all frames. For more information, see UI jank detection.
Profileable app profiling support
When profiling your app, it's important to generate accurate data with the
version of your app that most closely resembles what your users will install. To
do so, you can now include the
<profileable> property in your
app's manifest to profile apps that are not debuggable, as shown by the
following code.
<profileable android:shell="true"/>
Profileable is a manifest configuration introduced in Android 10, and is available for CPU and Memory profiling tasks. Using the profileable flag instead of the debuggable flag has the key advantage of lower overhead for performance measurement; however, certain profiling features are not available for Profileable builds, such as the Event timeline, API initiated CPU profiling, heap dumps, or live location recordings. For more information, see Profileable applications.
Collapse callstack frames
You can now collapse frames that are irrelevant to your investigation when inspecting a Callstack Sample Recording in the Profilers tool window. Callstacks are useful to understand which part of the code has been executed, and why it was invoked. However, the callstack for a Java/Kotlin program usually includes not only Java/Kotlin code, but also frames from native code that can be distracting. To learn more about refining the callstack view, see Inspect callstack frames.
Wireless debugging
Android Studio Bumblebee supports the wireless debugging feature on Android 11 and higher devices. Pair and deploy your app from Android Studio over Wi-Fi without using a USB cable or managing Android Debug Bridge (adb) connections using the command line. To use, navigate to the Pair devices using Wi-Fi option from the device selection menu, and then either choose a QR code or Pairing PIN Code. Then on your Android 11 and higher device, under Developer options, and find the Wireless Debugging screen and initialize and connect to an adb session wirelessly with Android Studio. Learn more about the wireless debugging setup at Connect to a device over Wi-Fi (Android 11+).
Compose interactive preview enabled by default
Starting with Android Studio Bumblebee, the interactive preview feature is enabled by default. The interactive preview allows you to interact with a preview as it would work on a device. The interactive preview is isolated from other preview in a sandbox environment, where you can click elements and enter user input in the preview. It’s a quick way to test different states and gestures of your composable, like a checkbox being checked or empty.
Preview interactive mode runs directly inside Android Studio without an emulator running, which results in some limitations:
- No network access.
- No file access.
- Some Context APIs may not be fully available.
Animated Vector Drawable (AVD) preview
The Animated Vector Drawable tool offers the ability to preview animated
drawable resources. This tools helps you preview <animation-list>,
<animated-vector>, and <animated-selector> resources in Android Studio
and makes it easier to refine your custom animations.
Non-transitive R classes on by default
Non-transitive R classes are now on by default. You can use non-transitive R classes with the Android Gradle plugin to build faster builds for applications with multiple modules. Doing so helps prevent resource duplication by ensuring that each module’s R class only contains references to its own resources, without pulling references from its dependencies. This leads to more up-to-date builds and the corresponding benefits of compilation avoidance.
You can get help using this feature by going to Refactor > Migrate to Non-Transitive R Classes...
Apple Silicon support update
For those using macOS on Apple Silicon (arm64) hardware, Android Studio Arctic Fox and the Android Emulator have supported this new architecture since last year. However, with this release, we have now updated the Android SDK platform tools v32.0.0 (which includes adb and fastboot) and build tools v32.1.0 (which includes aapt) to be universal binaries so that your Android developer tools no longer need the Rosetta binary translator to run. See the SDK platform tools release notes.
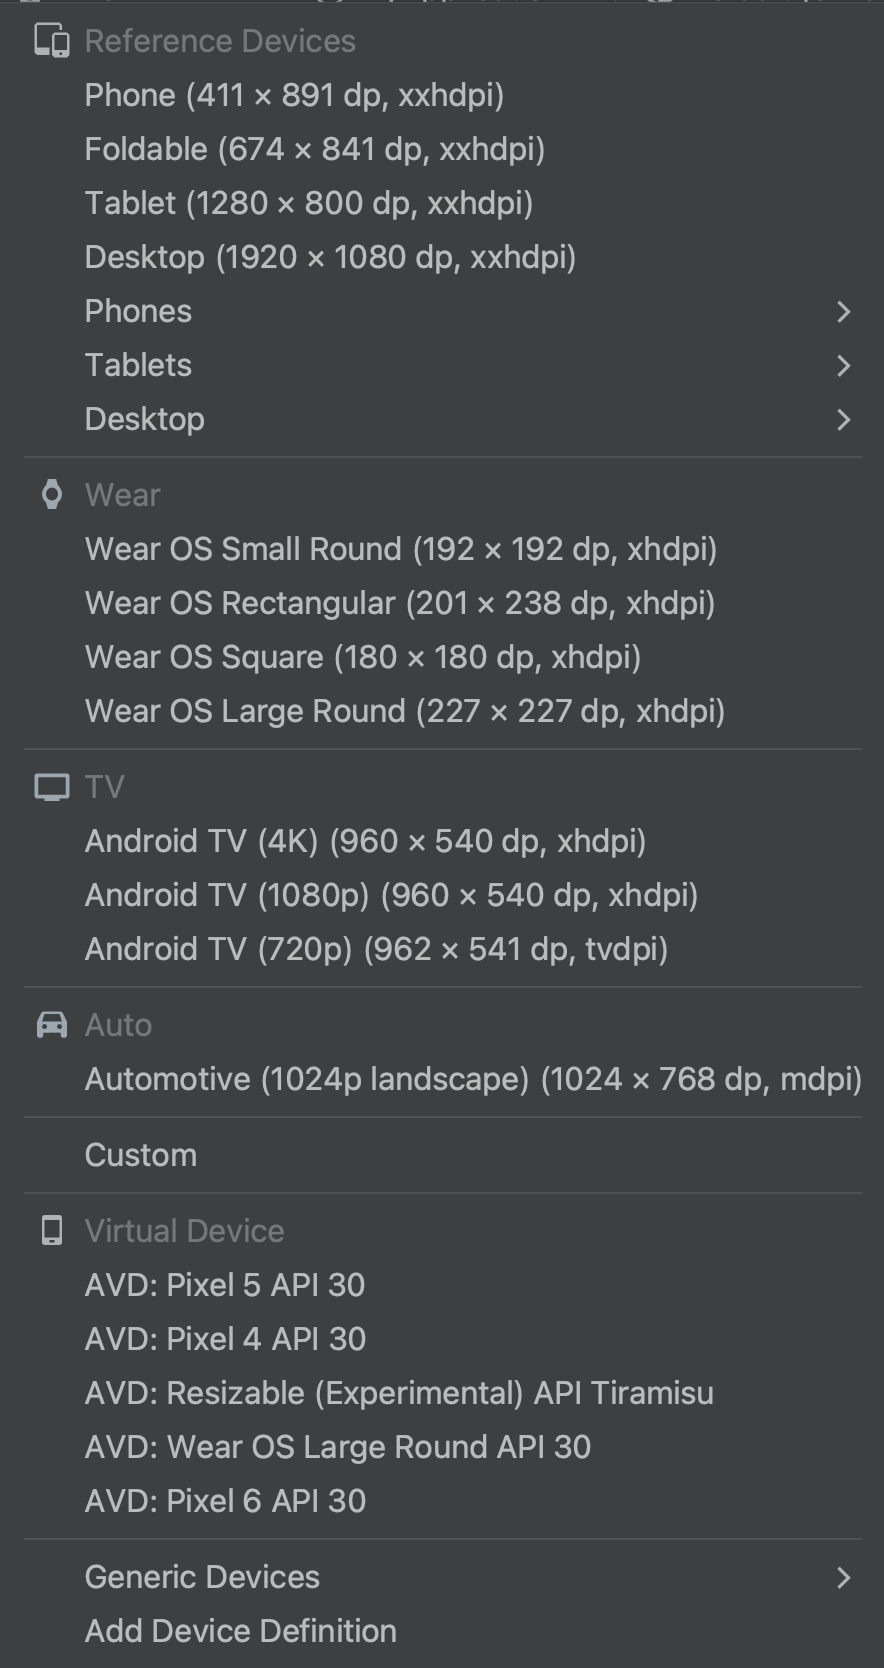
Updated device picker for design tools
To simplify designing your app for the diverse number of Android devices, we’ve updated the device picker in various design tool windows, such as Layout Editor and Layout Validation, with reference devices that reflect popular sizes of each device form factor. From phones to tablets, and Wear devices to Android TVs, it’s now easier to preview, validate, or edit your layout on screen sizes that are most representative of popular real-world devices.
Android testing
Android Studio Bumblebee and AGP 7.1 introduce several new features and improvements to help you more reliably and scalably run your automated instrumentation tests and see useful results you can use to debug issues.
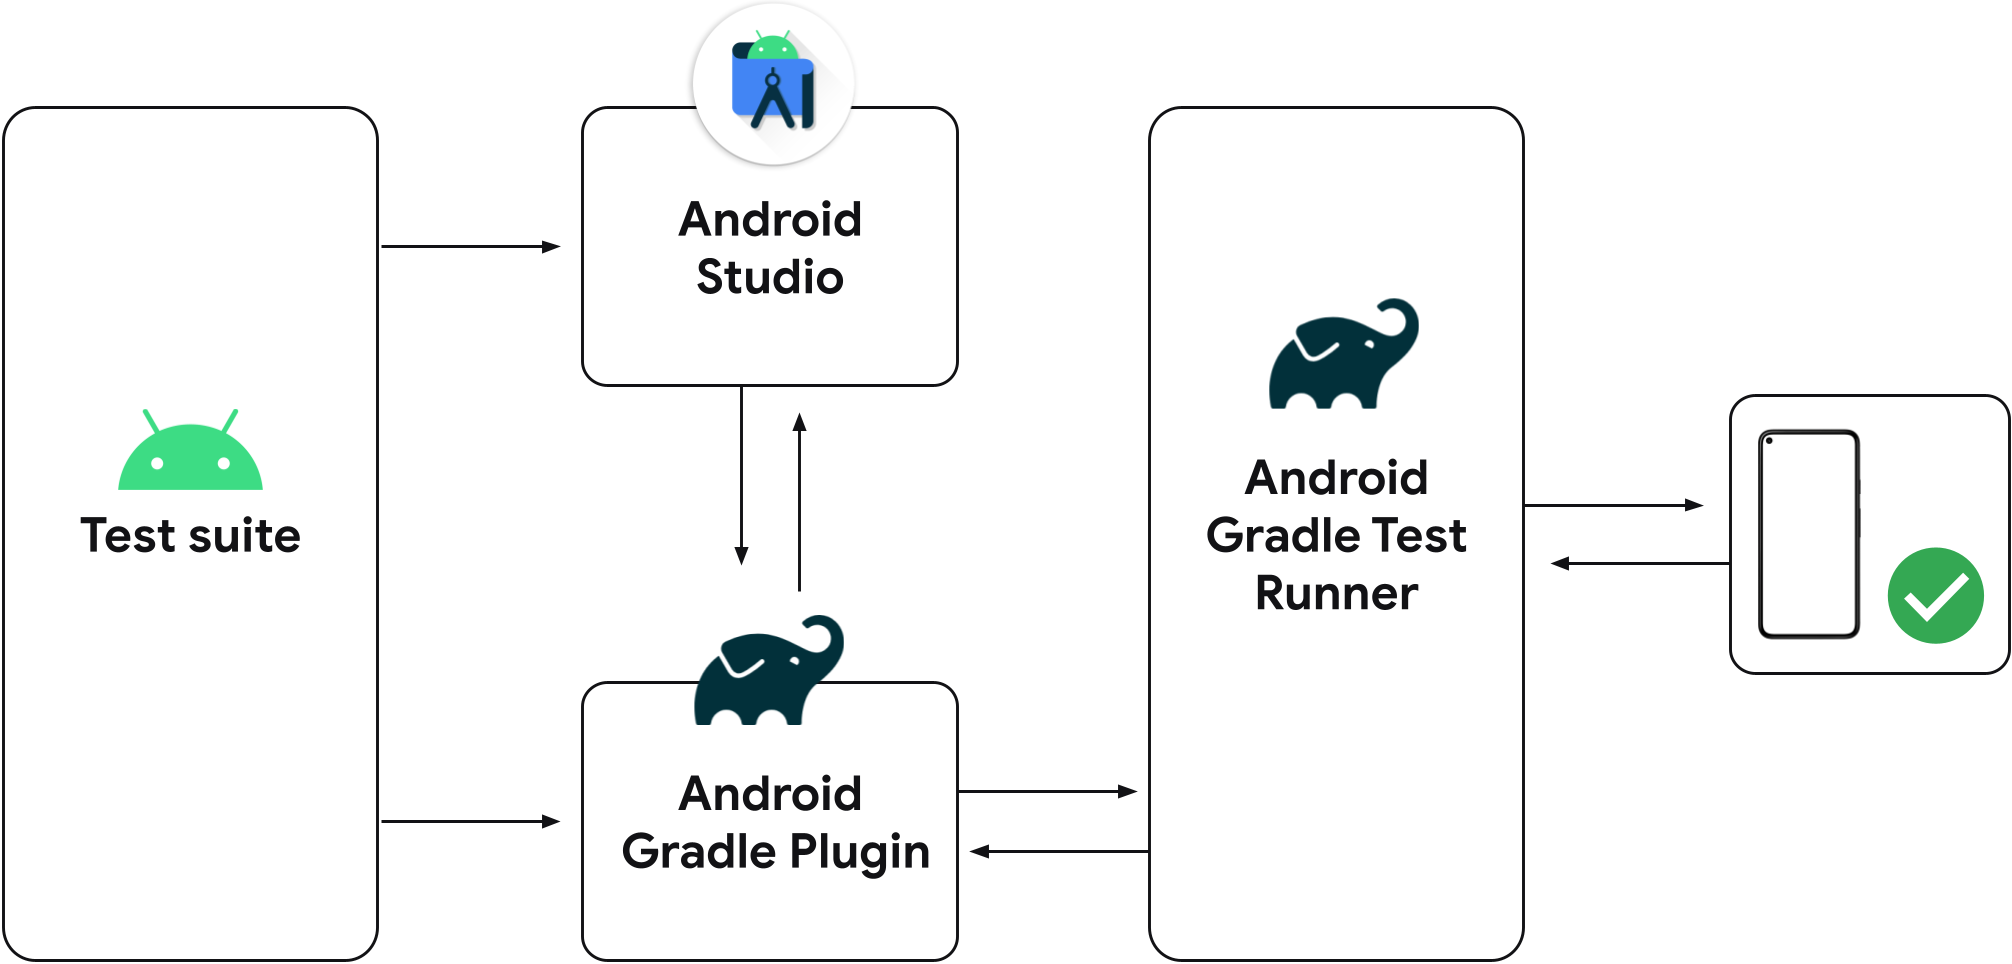
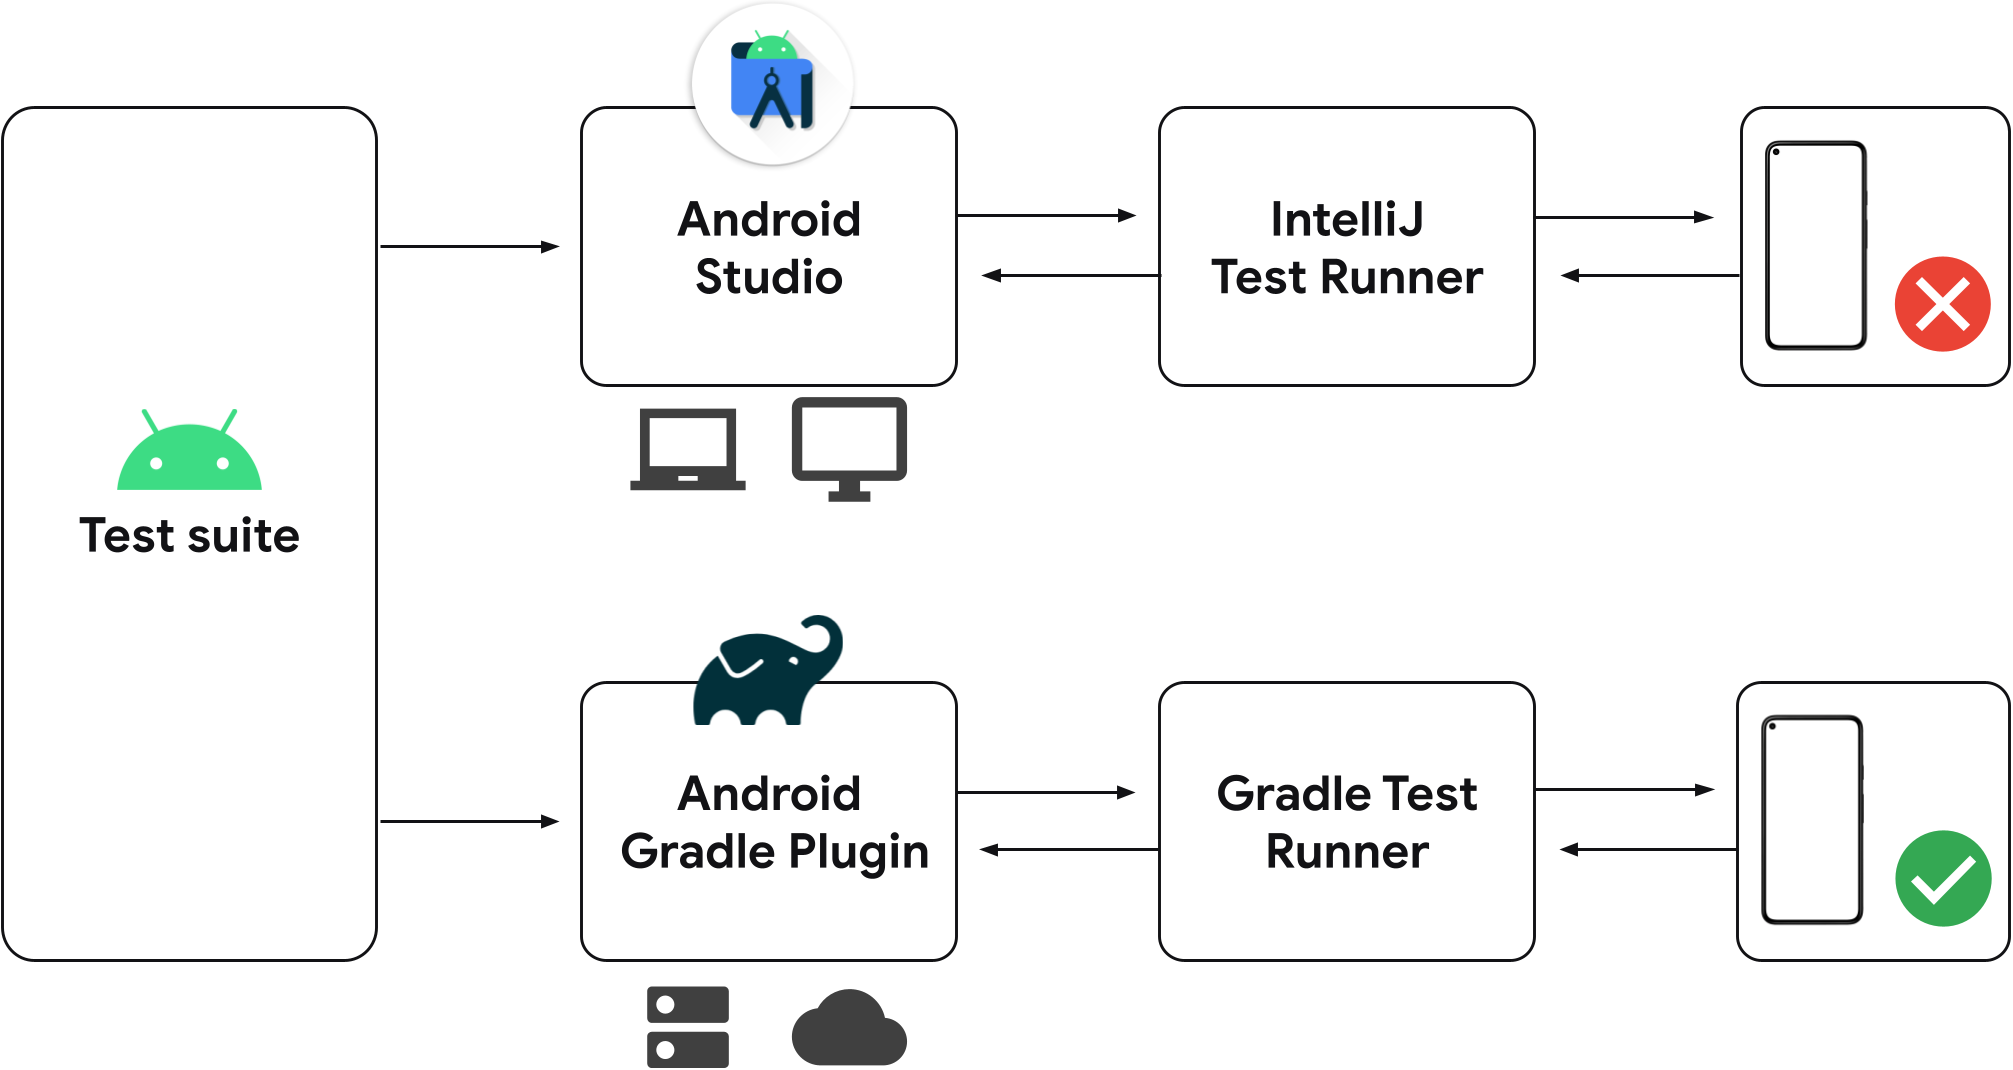
Unified Gradle test runner
Android Gradle plugin 7.1.0 and Android Studio Bumblebee and higher use Gradle’s own implementation of the Android instrumented test runner to run instrumented tests. By using the same test runner, results are likely to be consistent whether you run using AGP from the command line, such as on a continuous integration server, or from Android Studio.
Previous versions of Android Studio use the IntelliJ Android instrumented test runner instead of Gradle's Android instrumented test runner. So if you're not using the latest version of Android Studio, depending on whether you run your tests from Android Studio or from the command line using the Gradle plugin, you might see different test results, such as tests passing using one runner and failing on another.
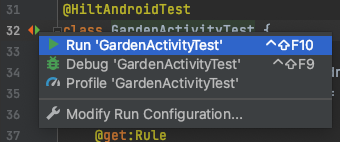
If you already have instrumented test configurations saved to your project, they’ll use Gradle to run tests on your connected device. You can create a new instrumented test configuration using the gutter action next to your test class or method, as shown below.
When running your instrumented tests, you can confirm that Android Studio is using the Gradle test runner by inspecting the test output in the Test Matrix for Gradle task output. Although we are improving this feature with each release of Android Studio, there are some known issues. If you are experiencing issues, please report a bug. You can also disable the new testing pipeline to revert to the old behavior.
Android Emulator now runs directly inside Android Studio by default
The Android Emulator runs directly inside Android Studio by default. This allows you to conserve screen real estate, navigate quickly between the emulator and the editor window using hotkeys, and organize your IDE and emulator workflow in a single application window.
When the emulator is running, you'll have access to common emulator actions like rotating, and extended control options like navigation playback. To run the emulator in a separate window instead go to File > Settings > Tools > Emulator (Android Studio > Preferences > Tools > Emulator on macOS) and deselect Launch in a tool window.
Disable the new testing pipeline
By default Android Studio Bumblebee uses Gradle to run its instrumentation tests. If you're experiencing issues, you can disable this behavior as follows:
- Select File > Settings > Build, Execution, Deployment > Testing (or Android Studio > Preferences > Build, Execution, Deployment > Testing on MacOS.)
- Uncheck the box next to Run Android instrumented tests using Gradle and click OK.
You can also revert to older behaviors by doing one of the following:
- When running Gradle tasks from the command line, use the following command
line parameter:
-Pandroid.experimental.androidTest.useUnifiedTestPlatform=false - Add the following parameter to your project's
gradle.propertiesfile:android.experimental.androidTest.useUnifiedTestPlatform=false
To help resolve issues that you might be expereincing, please report a bug.
Patch releases
The following are patch releases in Android Studio Bumblebee.
Android Studio Bumblebee | 2021.1.1 Patch 3 (April 2022)
This minor update includes the following bug fixes:
- Android Gradle plugin
- Duplicate class issues reported by R8
- Build Variants
versionNameSuffixno longer works if the variant's version name is set via the new onVariants API
- Compose Preview
- Performance and stability related bug fixes.
- Solve freeze that occurred occasionally when using the Live Edit of Literals feature.
- Import/Sync
- "Gradle sync needed" message has redundant AGP versions
- Recompile Foo.java/kt cleans too much and does not recompile the right component
- Project Structure
- AGP Upgrade Assistant stability improvements when changing target versions
- AGP Upgrade Assistant now informs users about Gradle plugins being upgraded
- Network Inspector
- New Network inspector crashes after Bumblebee update
- I am constantly getting this error when the debugger is connected on the latest version of Android Studio.
TrackedHttpURLConnection.getHeaderFieldcrashes withNullPointerException
For more information, see the Android Studio Bumblebee Patch 3 blog post.
Android Studio Bumblebee | 2021.1.1 Patch 2 (February 2022)
This update includes the following bug fixes:
- C++ Build
ModelCache.safeGet(androidProjectResult.androidProject::getNdkVersion, "")must not be null
- Code Editor
- Bug in Android Studio Live Templates - the
className()expression is not resolving the class name
- Bug in Android Studio Live Templates - the
- D8/R8
java.lang.NoSuchMethodError: No static method$jacocoInit- Android test coverage broken due to Mockito error
- Need workaround for broken CAS implementation on API 31
- Sealed classes are not supported
NullPointerExceptionwhen enabling horizontal class merging in ChromeAbstractMethodErrorafter virtual method merging- Failure to verify stack frames due to incorrect init-class out-type
- Dex input uses a register that is not defined
StringBuilderOptimizerAnalysisTestis failing on release branches- Non-determinism in R8
- Deployment
- Running the project of a device owner application fails with
Couldn't terminate the existing process forerror message
- Running the project of a device owner application fails with
- Design Tools
- Compose Previews fail to find resources from other modules when non-transitive R classes is enabled
- Studio freezes on build.
- Embedded Emulator
- Miscellaneous performance and stability improvements.
- Import/Sync
- IDE error when launching Bumblebee: Output listing build file is not
available for output type Apk in
IdeBuildTasksAndOutputInformationImp
- IDE error when launching Bumblebee: Output listing build file is not
available for output type Apk in
- IntelliJ
- Env variables not sourced when launched from Mac OS X Monterey Dock
- Jetpack (androidx) > Navigation
- Upgrade SafeArgs to be built on latest stable AGP
- Tools Windows
- Can't run Android Device Manager
- Network Inspector in BumbleBee doesn't show the api response in readable format
For more information, see the Android Studio Bumblebee Patch 2 blog post.
Android Studio Bumblebee | 2021.1.1 Patch 1 (February 2022)
This minor update includes the following bug fixes:
- Emulator
- Unable to connect to embedded emulator after upgrading to Bumblebee (Mac M1)
- IntelliJ
- Env variables not sourced when launched from Mac OS X Monterey Dock
For more information, see the Android Studio Bumblebee Patch 1 blog post.