
Android Studio Arctic Fox is a major release that includes a variety of new features and improvements.
New version numbering
Updated version numbering for Android Studio
We have changed the version numbering system for Android Studio to more closely align with IntelliJ IDEA, the IDE that Android Studio is based on.
In the previous numbering system, this release would have been numbered as Android Studio 4.3 or version 4.3.0.1. With the new numbering system, it is now Android Studio - Arctic Fox | 2020.3.1, or version 2020.3.1.
| Intellij Version | Old Name | Old - Number System | New - Year System | New Version Name |
|---|---|---|---|---|
| 2020.3 | 4.3 | 4.3.0 | 2020.3.1 | Arctic Fox | 2020.3.1 |
Going forward, here’s how the Android Studio version number is determined:
<Year of IntelliJ Version>.<IntelliJ major version>.<Studio major version>.<Studio minor/patch version>
- The first two number groups represent the version of the IntellIj platform that a particular Android Studio release is based on. For this release, it's version 2020.3.
- The third number group represents the Studio major version, starting at 1 and incrementing by one for every major release.
- The fourth number group represents the Studio minor/patch version, starting at 1 and incrementing by one for every minor release.
- We are also giving each major release a version name, incrementing from A to Z based on animal names. This release is named Arctic Fox.
Updated version numbering for Android Gradle plugin
We have changed the version numbering for Android Gradle plugin (AGP) to more closely match the underlying Gradle build tool. Therefore, AGP 7.0 is the next release after AGP 4.2.
For more details, see Versioning changes in the AGP release notes.
Android Gradle plugin 7.0.0
The latest version of the Android Gradle plugin includes many updates. To learn more, read the full Android Gradle plugin release notes.
Unit tests now uses Gradle test runner
To improve overall consistency of test executions, Android Studio now uses Gradle to run all unit tests by default. In many cases, this change will not affect your testing workflow in the IDE.
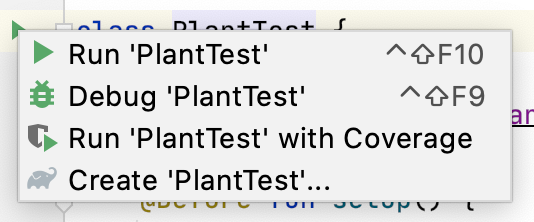
For example, when you click the Run command in the context menu (visible
when you right-click on a test class) or its corresponding gutter action
 ,
Android Studio will use the Gradle run configuration by default to run unit
tests.
,
Android Studio will use the Gradle run configuration by default to run unit
tests.
However, Android Studio no longer recognizes existing Android JUnit run configurations, so you should migrate Android JUnit run configurations that you might save as project files to Gradle run configurations.
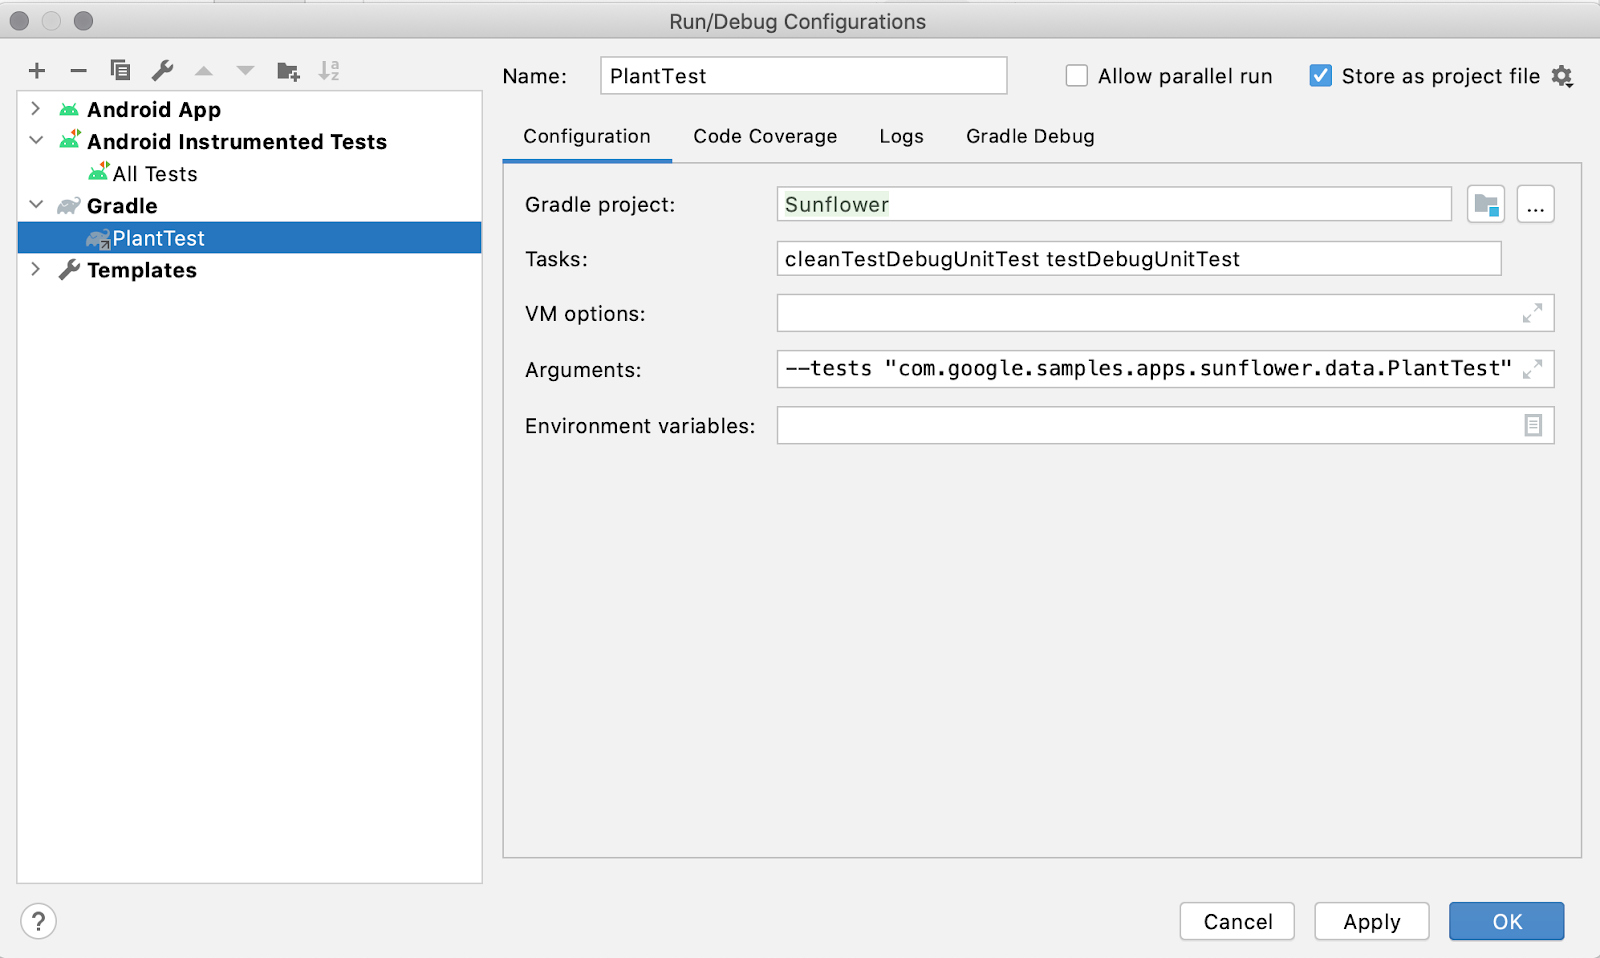
To create a Gradle test configuration, select the Gradle template when following the instructions in Create a new run/debug configuration. When you've created a new configuration, it will appear in the Edit Configurations dialog in the Gradle section:
If you want to inspect Android JUnit configurations that are no longer recognized, you can do one of two things:
- Open manually saved configurations in a text editor. The locations of these
files are specified by the user, but the files typically appear in
<my-app>/.idea/runConfigurations/. Look for temporary configurations in
<my-app>/.idea/workspace.xmland look under the<component name="RunManager" ...>node. For example:<component name="RunManager" selected="Gradle.PlantTest"> … <configuration name="PlantTest" type="AndroidJUnit" factoryName="Android JUnit" nameIsGenerated="true"> <module name="Sunflower.app" /> <useClassPathOnly /> <extension name="coverage"> <pattern> <option name="PATTERN" value="com.google.samples.apps.sunflower.data.*" /> <option name="ENABLED" value="true" /> </pattern> </extension> <option name="PACKAGE_NAME" value="com.google.samples.apps.sunflower.data" /> <option name="MAIN_CLASS_NAME" value="com.google.samples.apps.sunflower.data.PlantTest" /> <option name="METHOD_NAME" value="" /> <option name="TEST_OBJECT" value="class" /> <option name="PARAMETERS" value="" /> <option name="WORKING_DIRECTORY" value="$MODULE_DIR$" /> <method v="2"> <option name="Android.Gradle.BeforeRunTask" enabled="true" /> </method> </configuration>
Improved Upgrade Assistant for AGP
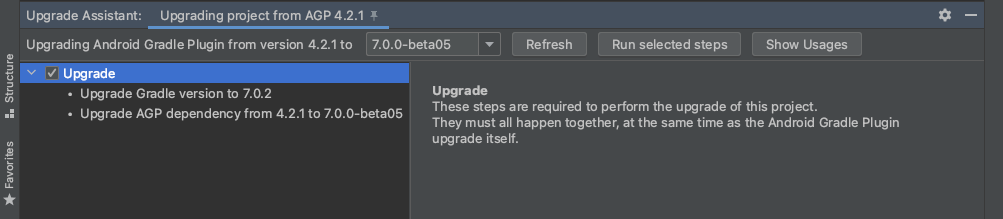
The Upgrade Assistant for Android Gradle plugin now has a persistent tool window with the list of steps that will be completed. Additional information is also presented on the right side of the tool window. If needed, you can also choose a different version of AGP to upgrade to. Clicking on the Refresh button updates the corresponding update steps.
Refactoring for non-transitive R classes
You can use non-transitive R classes with the Android Gradle plugin to build faster builds for applications with multiple modules. Doing so helps prevent resource duplication by ensuring that each module’s R class only contains references to its own resources, without pulling references from its dependencies. This leads to more up-to-date builds and the corresponding benefits of compilation avoidance.
You can access this feature by going to Refactor > Migrate to Non-transitive R Classes.
New Background Task Inspector
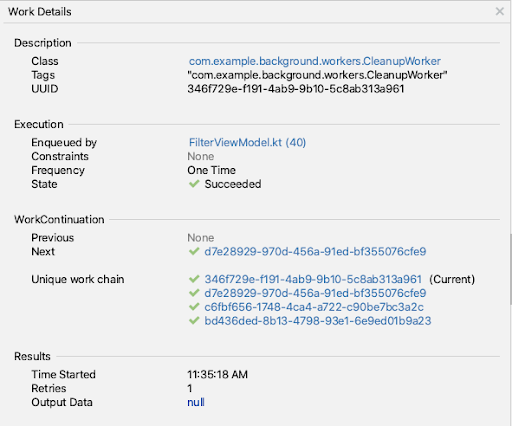
You can visualize, monitor, and debug your app's background workers using the new Background Task Inspector. To get started, deploy your app to a device running WorkManager library 2.5.0 or higher, and select View > Tool Windows > App Inspection from the menu bar.
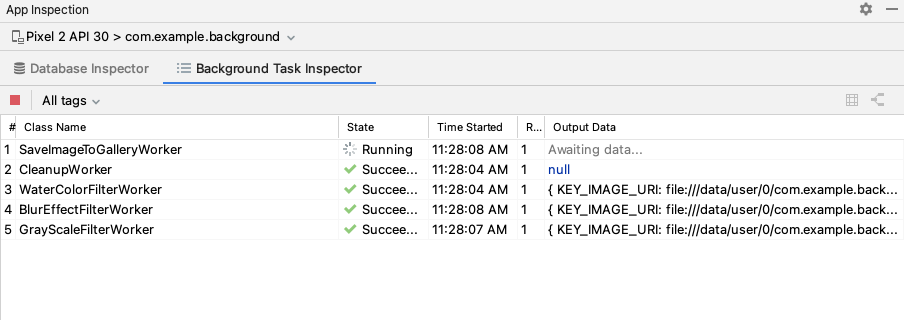
You can view more detailed information by clicking on a worker. For example, you can see the description of the worker, how it was executed, details of its worker chain, and the result of the execution.
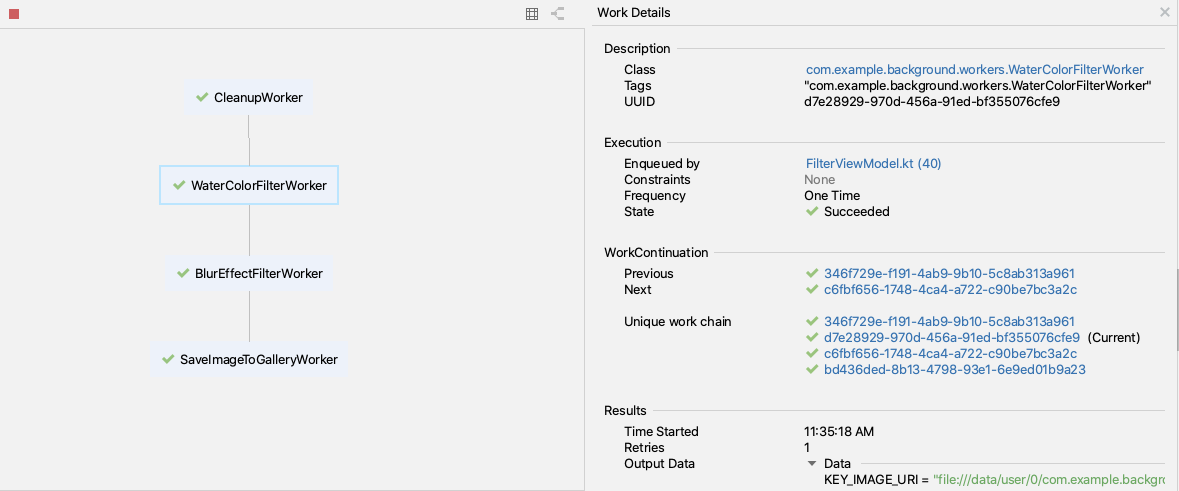
You can also view a visual representation of a worker chain by selecting a
worker from the table and clicking Show Graph View  from the toolbar. You can then select any worker in the chain to see its details,
or stop it if it’s currently enqueued or running. To return to the table, click
Show List View
from the toolbar. You can then select any worker in the chain to see its details,
or stop it if it’s currently enqueued or running. To return to the table, click
Show List View  .
.
To help you investigate issues from workers that fail execution, you can stop a
currently running or enqueued worker by selecting it from the table and clicking
Cancel Selected Worker  from the toolbar. You can also filter workers in the table by tags you’ve
assigned to them using the All tags dropdown menu.
from the toolbar. You can also filter workers in the table by tags you’ve
assigned to them using the All tags dropdown menu.
Updates Database Inspector
The Database Inspector is now included in the new App Inspection tool window, where you can also find the new Background Task Inspector. Open the App Inspection tool window from the tool window bar, or select View > Tool Windows > App Inspection from the menu bar.
Export data from the Database Inspector
In Arctic Fox, you can easily export databases, tables, and query results from the Database Inspector to save, share, or recreate locally. When you open up an app project in Android Studio and inspect the app for that project in the Database Inspector, you can start exporting data in one of the following ways:
- Select a database or table in the Databases panel and click Export to file near the top of the panel.
- Right-click on a database or table in the Databases panel and select Export to file from the context menu.
- When inspecting a table or query results in a tab, click Export to file above the table or query results.
After selecting an export action, you use the Export dialog to help you through the final steps, as shown below. Depending on whether you are trying to export a database, table, or query results, you have the option of exporting the data in one or more of the following formats: DB, SQL, or CSV.

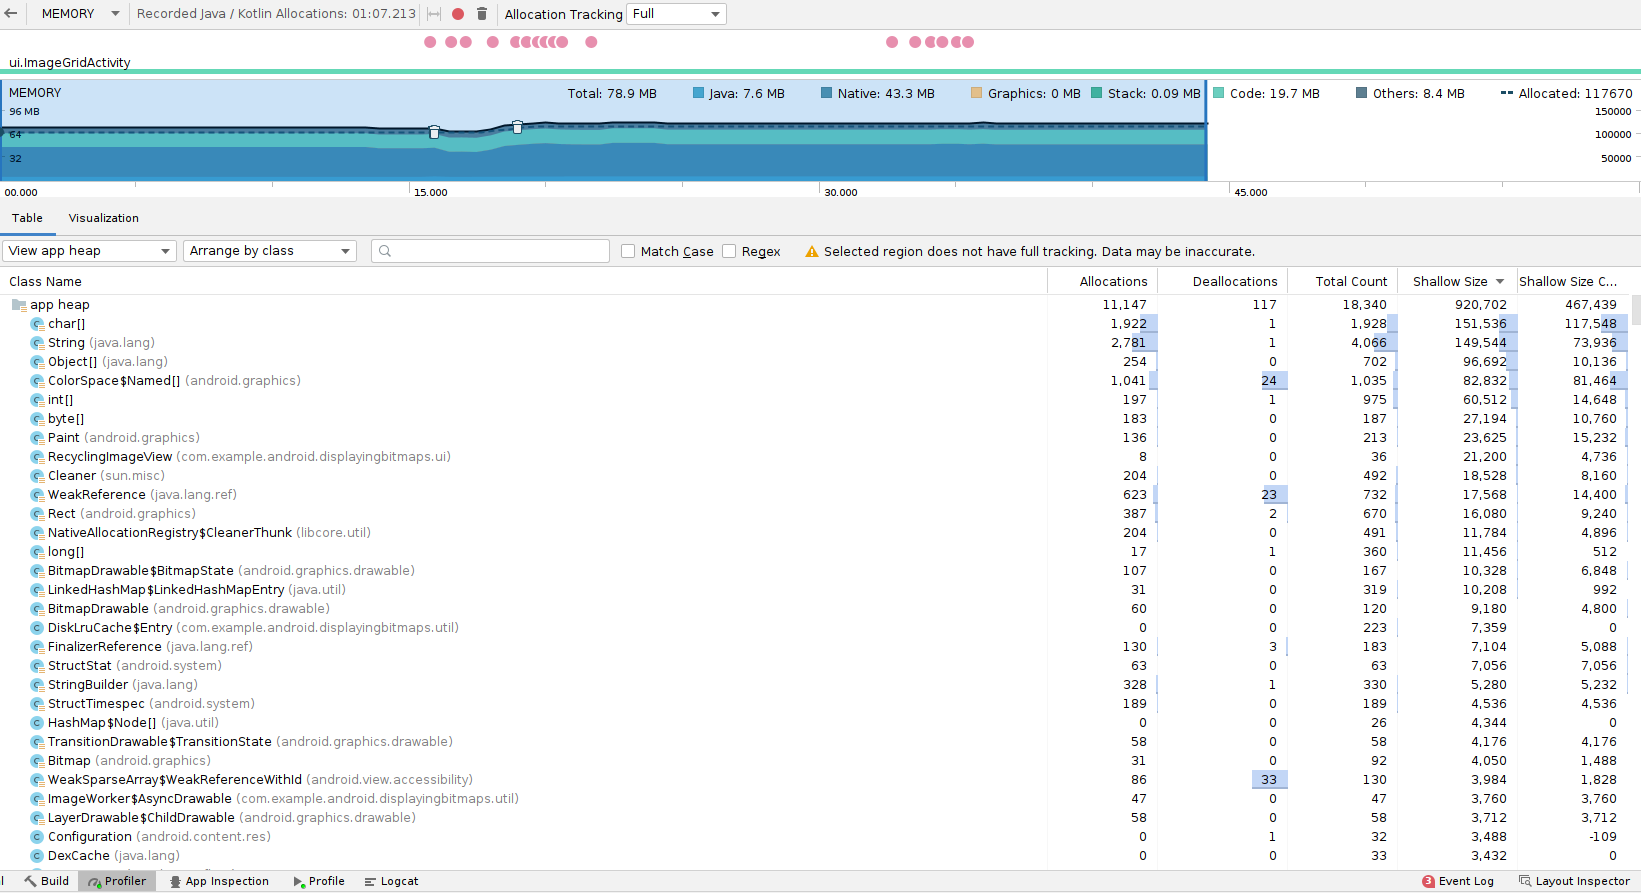
Updated UI for recording in Memory Profiler
We have consolidated the Memory Profiler user interface (UI) for different recording activities, such as capturing a heap dump and recording Java, Kotlin, and native memory allocations.
The Memory Profiler provides the following options:
- Capture heap dump: View objects in your app that are using memory at a specific point in time.
- Record native allocations: View how each C/C++ object was allocated over a period of time.
- Record Java/Kotlin allocations: View how each Java/Kotlin object was allocated over a period of time.
Here's how to use these three options:
To capture a heap dump, select Capture heap dump, then select Record. After the profiler finishes capturing the heap dump, the Memory Profiler UI transitions to a separate screen displaying the heap dump.

To record native allocations on devices running Android 10 and higher, select Record native allocations, then select Record. The recording continues until you click Stop
 ,
after which the Memory Profiler UI transitions into a separate screen
displaying the native recording.
,
after which the Memory Profiler UI transitions into a separate screen
displaying the native recording.On Android 9 and lower, the Record native allocations option is not available.
To record Java and Kotlin allocations, select Record Java / Kotlin allocations, then select Record. If the device is running Android 8 or higher, the Memory Profiler UI transitions to a separate screen displaying the ongoing recording. You can interact with the mini timeline above the recording (for example, to change the selection range). To complete the recording, select Stop
 .
.
On Android 7.1 and lower, the memory profiler uses legacy allocation recording, which displays the recording on the timeline until you click Stop.
Updates to Refresh Linked C++ Project
We have moved files unrelated to configuration from the .cxx/ folder into the
build/ folder. CMake C++ builds require a configuration phase that generates
the Ninja project that's used to execute the compile and link steps. Projects
generated by CMake are expensive to generate and are expected to survive across
gradle clean. For this reason, they're stored in a folder called .cxx/, next
to the build/ folder. Typically, Android Gradle plugin will notice
configuration changes and automatically regenerate the Ninja project. However,
not all cases can be detected. When this happens, the "Refresh Linked C++
Project" option can be used to manually regenerate the Ninja project.
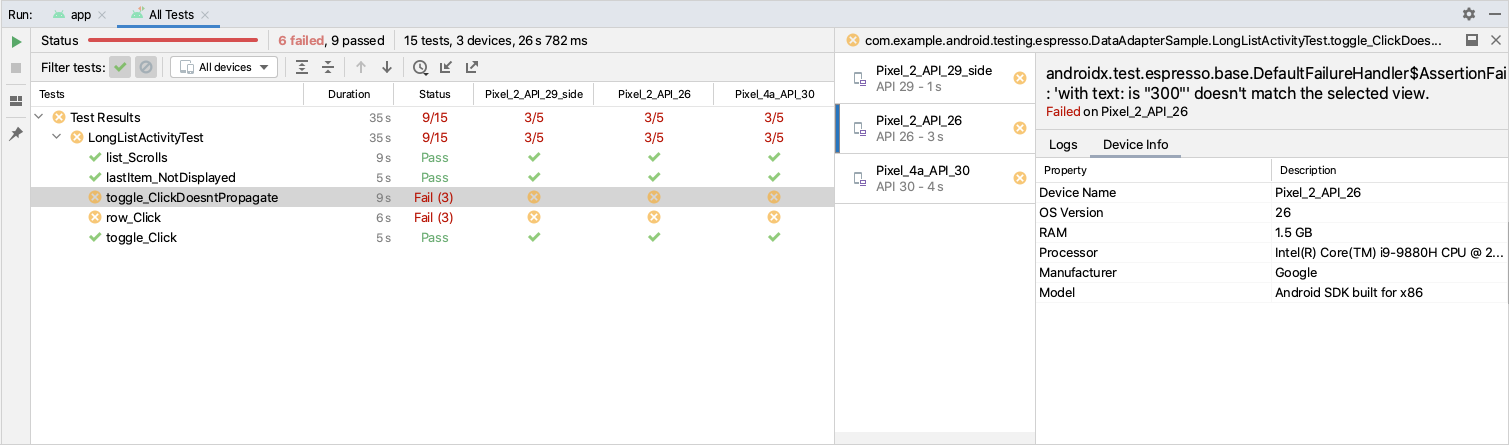
New test matrix for multi-device testing
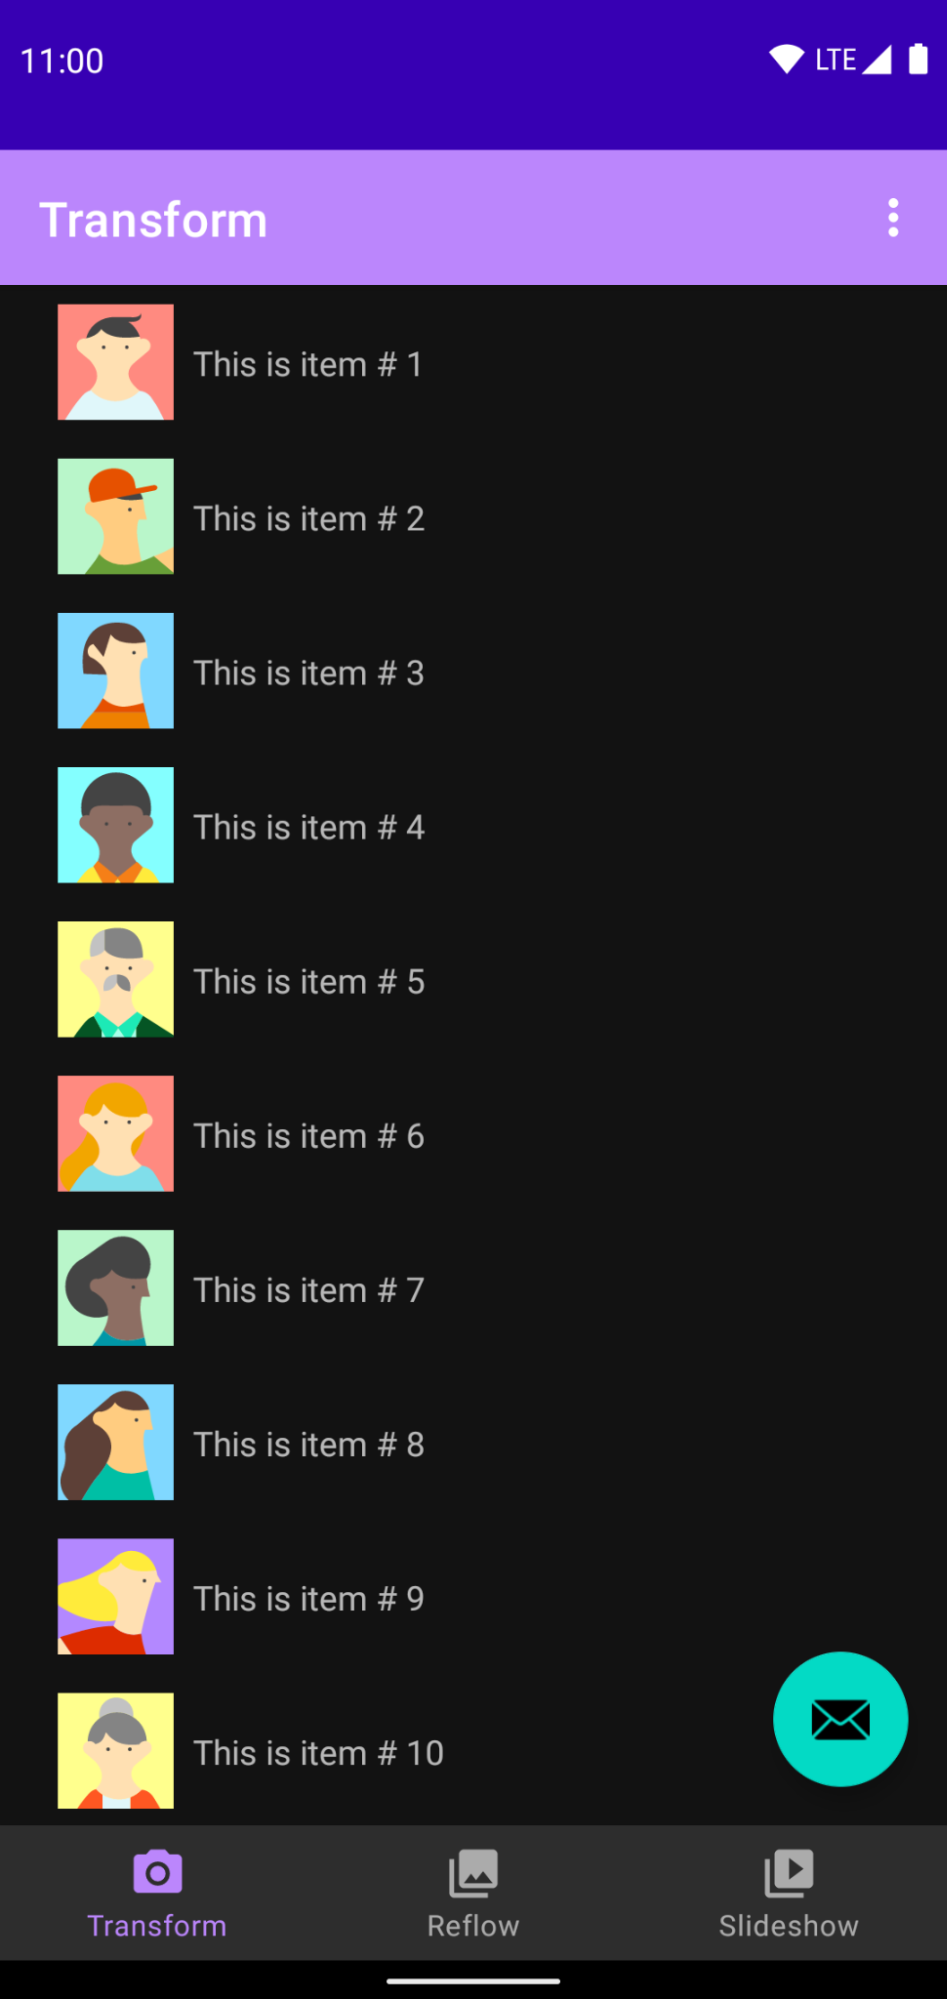
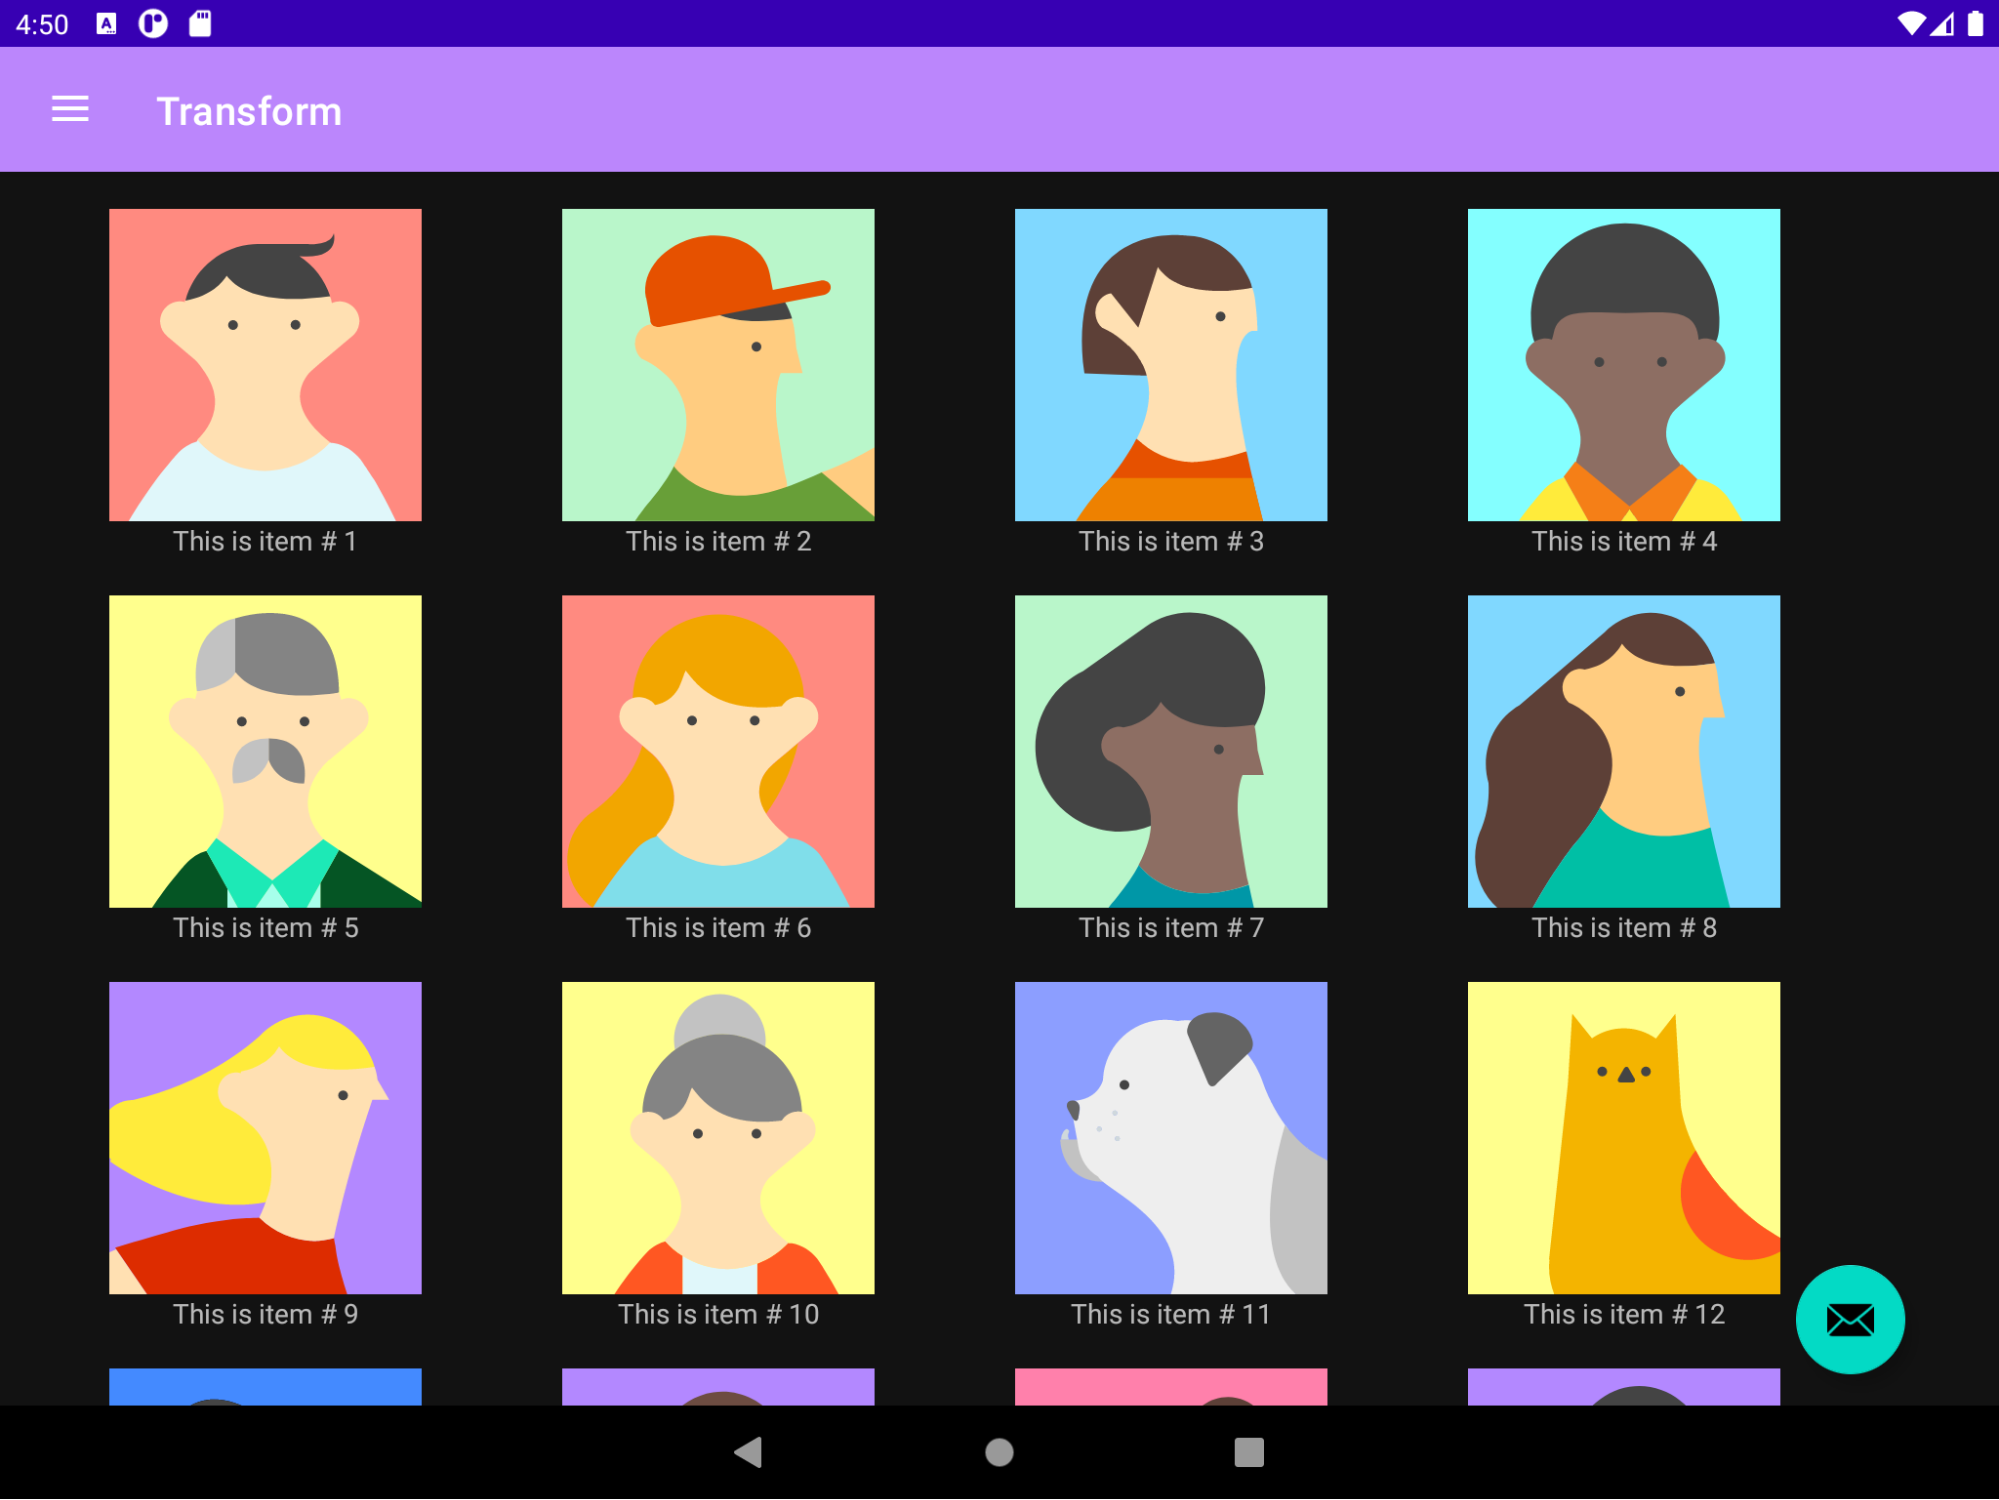
Instrumentation tests can now run across multiple devices in parallel and can be investigated using a specialized instrumentation test results panel. Using this panel, you can determine if tests are failing due to API level or hardware properties.
Testing your app across a wide variety of API levels and form factors is one of the best ways to ensure that all users have a great experience when using your app.
To take advantage of this feature:
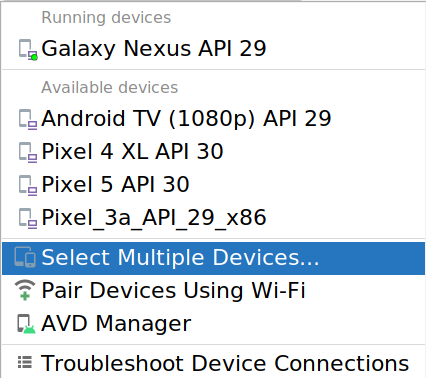
Choose Select Multiple Devices in the target device dropdown menu from the top-center of the IDE).
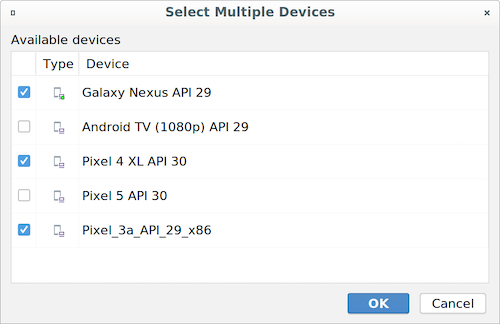
Select the target devices and click OK.
Run your tests.
To view your test results in the Run panel, go to View > Tool Windows > Run.
The new test results panel allows you to filter your test results by status, device, and API level. Additionally, you can sort each column by clicking the header. By clicking on an individual test, you can view logs and device information individually for each device.
StateFlow support in data binding
For Kotlin apps that use coroutines, you can now use
StateFlow
objects as a data binding source to automatically notify the UI about
changes in the data. Your data bindings will be lifecycle aware and
will only be triggered when the UI is visible on the screen.
To use a StateFlow object with your binding class, you need to specify a
lifecycle owner to define the scope of the StateFlow object, and in your
layout, assign the properties and methods of your ViewModel component to the
corresponding views using binding expressions, as shown in the following
example:
class ViewModel() {
   val username: StateFlow<String>
}
<TextView
    android:id="@+id/name"
    android:text="@{viewmodel.username}" />
If you're in a Kotlin app that uses AndroidX, StateFlow support is
automatically included in the functionality of data binding, including the
coroutines dependencies.
To learn more, see Work with observable data objects.
Improved suggested import
We’ve improved the number of libraries that are supported by the suggested import feature and update the index more frequently. Suggested import helps you quickly and easily import certain Google Maven artifacts into both your class and Gradle project. When Android Studio detects unresolved symbols from certain Google libraries, the IDE suggests importing the library into both the class and the project.
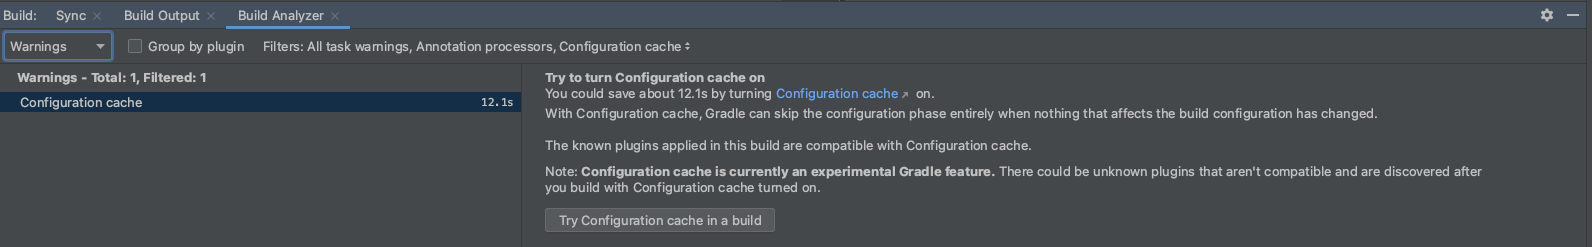
Support for configuration cache in Build Analyzer
Build Analyzer now identifies when a project doesn't have configuration cache enabled, and offers it as an optimization. Build Analyzer runs a compatibility assessment to inform you if there are any issues with configuration cache in your project before it gets enabled.
Support for Jetpack Compose tooling
We now offer additional support for previewing and testing apps that use Jetpack Compose. For the best experience developing with Jetpack Compose, you should use the latest version of Android Studio Arctic Fox so that you can benefit from smart editor features, such as New Project templates and the ability to immediately preview your Compose UI.
Compose preview
The following parameters for @Preview methods are now available:
- showBackground: Switch on and off a background for your preview.
- backgroundColor: Set a color that is only used in the preview surface.
- uiMode: This new parameter can take any of the Configuration.UI_* constants and allows you to change the behavior of the preview to, for example, set it to Night Mode to see how the theme reacts.

Interactive preview
You can use this feature to interact with your UI components, click them, and
see how the state changes. It's a quick way to get feedback on how your UI
reacts and to preview the animations. To enable it, click the Interactive
icon
![]() ,
and the preview will switch modes.
,
and the preview will switch modes.
To stop, click on Stop Interactive Preview in the top toolbar.
Deploy to device
You can use this feature to deploy a snippet of your UI to a device. This helps test small parts of your code in the device without having to start the full application.
Click the Deploy to Device icon
![]() next to the
next to the @Preview annotation or at the top of the preview, and Android Studio
will deploy that @Preview to your connected device or emulator.
Live Edit of literals
We have added Live Edit of literals to help developers using Compose quickly edit literals (strings, numbers, booleans) in their code and see the results immediately without needing to wait for compilation. The goal of this feature is to help increase your productivity by having code changes appear near instantaneously in the previews, emulator, or physical device.
Compose support in the Layout Inspector
The Layout Inspector allows you to see rich detail about your app's layout running on your connected device. You can interact with your app and see live updates in the tool to quickly debug issues that might arise.
You can inspect layouts written with the new Android declarative UI framework, Jetpack Compose. Whether your app uses layouts fully written in Compose or layouts that use a hybrid of Compose and Views, the Layout Inspector helps you understand how your layouts are rendered on your running device.
Get started
To get started, deploy your app to a connected device and then open the Layout Inspector window by selecting View > Tool Windows > Layout Inspector. If the Layout Inspector doesn't automatically connect to your app process, select the desired app process from the process pulldown. You should soon see your app's layout rendered in the tool window. To get started inspecting your Compose layout, select the layout component visible in the rendering or select it from the Component Tree.
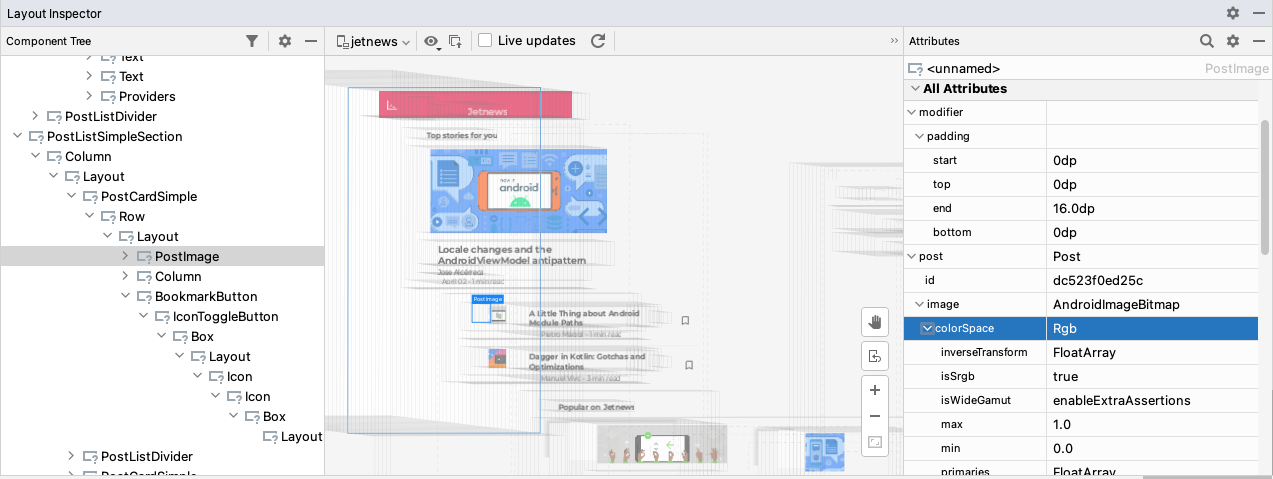
The Attributes window shows you detailed information about the Compose function currently selected. In this window, you can inspect the function's parameters and their values, including modifiers and lambda expressions. For lambda expressions, the inspector provides a shortcut to help you navigate to the expression in your source code.
The Layout Inspector shows all Compose functions in the call stack that emit
components to your app's layout. In many cases, this includes Compose functions
that are called internally by the Compose Library. If you want to see only the
Compose functions in the Component Tree that your app calls directly, click
the filter ![]() action, which might help reduce the number of nodes shown in the tree to the
ones you are likely to want to inspect.
action, which might help reduce the number of nodes shown in the tree to the
ones you are likely to want to inspect.
Improved deploy dropdown
The device dropdown now distinguishes between different kinds of errors within your chosen device configuration. Iconography and stylistic changes now differentiate between errors (device selections that result in a broken configuration) and warnings (device selections that may result in unexpected behavior but are still runnable).
In addition, Android Studio will now warn you if you attempt to launch your project to a device that has an error or a warning associated with it.
New Wear OS pairing assistant
The new Wear OS pairing assistant guides developers step-by-step through pairing Wear OS emulators with physical or virtual phones directly in Android Studio. The assistant can help you get the right Wear OS Companion app installed on your phone and set up a connection between the two devices. You can get started by going to the device dropdown > Wear OS Emulator Pairing Assistant.

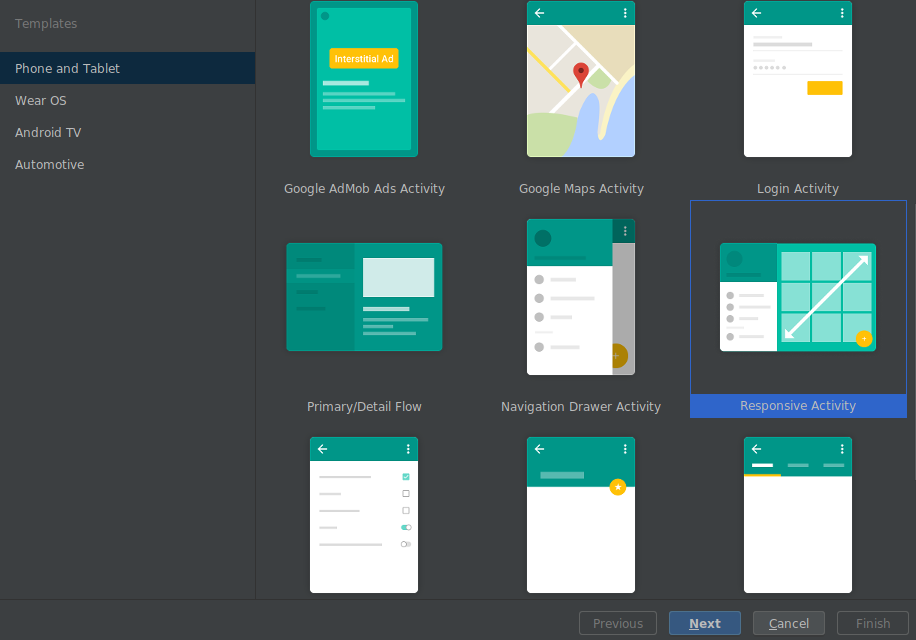
Responsive layout template
Android Studio Arctic Fox now includes a new layout template that adapts to various display dimensions and app resizing, such as phones, foldables, tablets, and split screen modes. When creating a new project or module, select the Responsive Activity template to create a layout with components that dynamically resize.
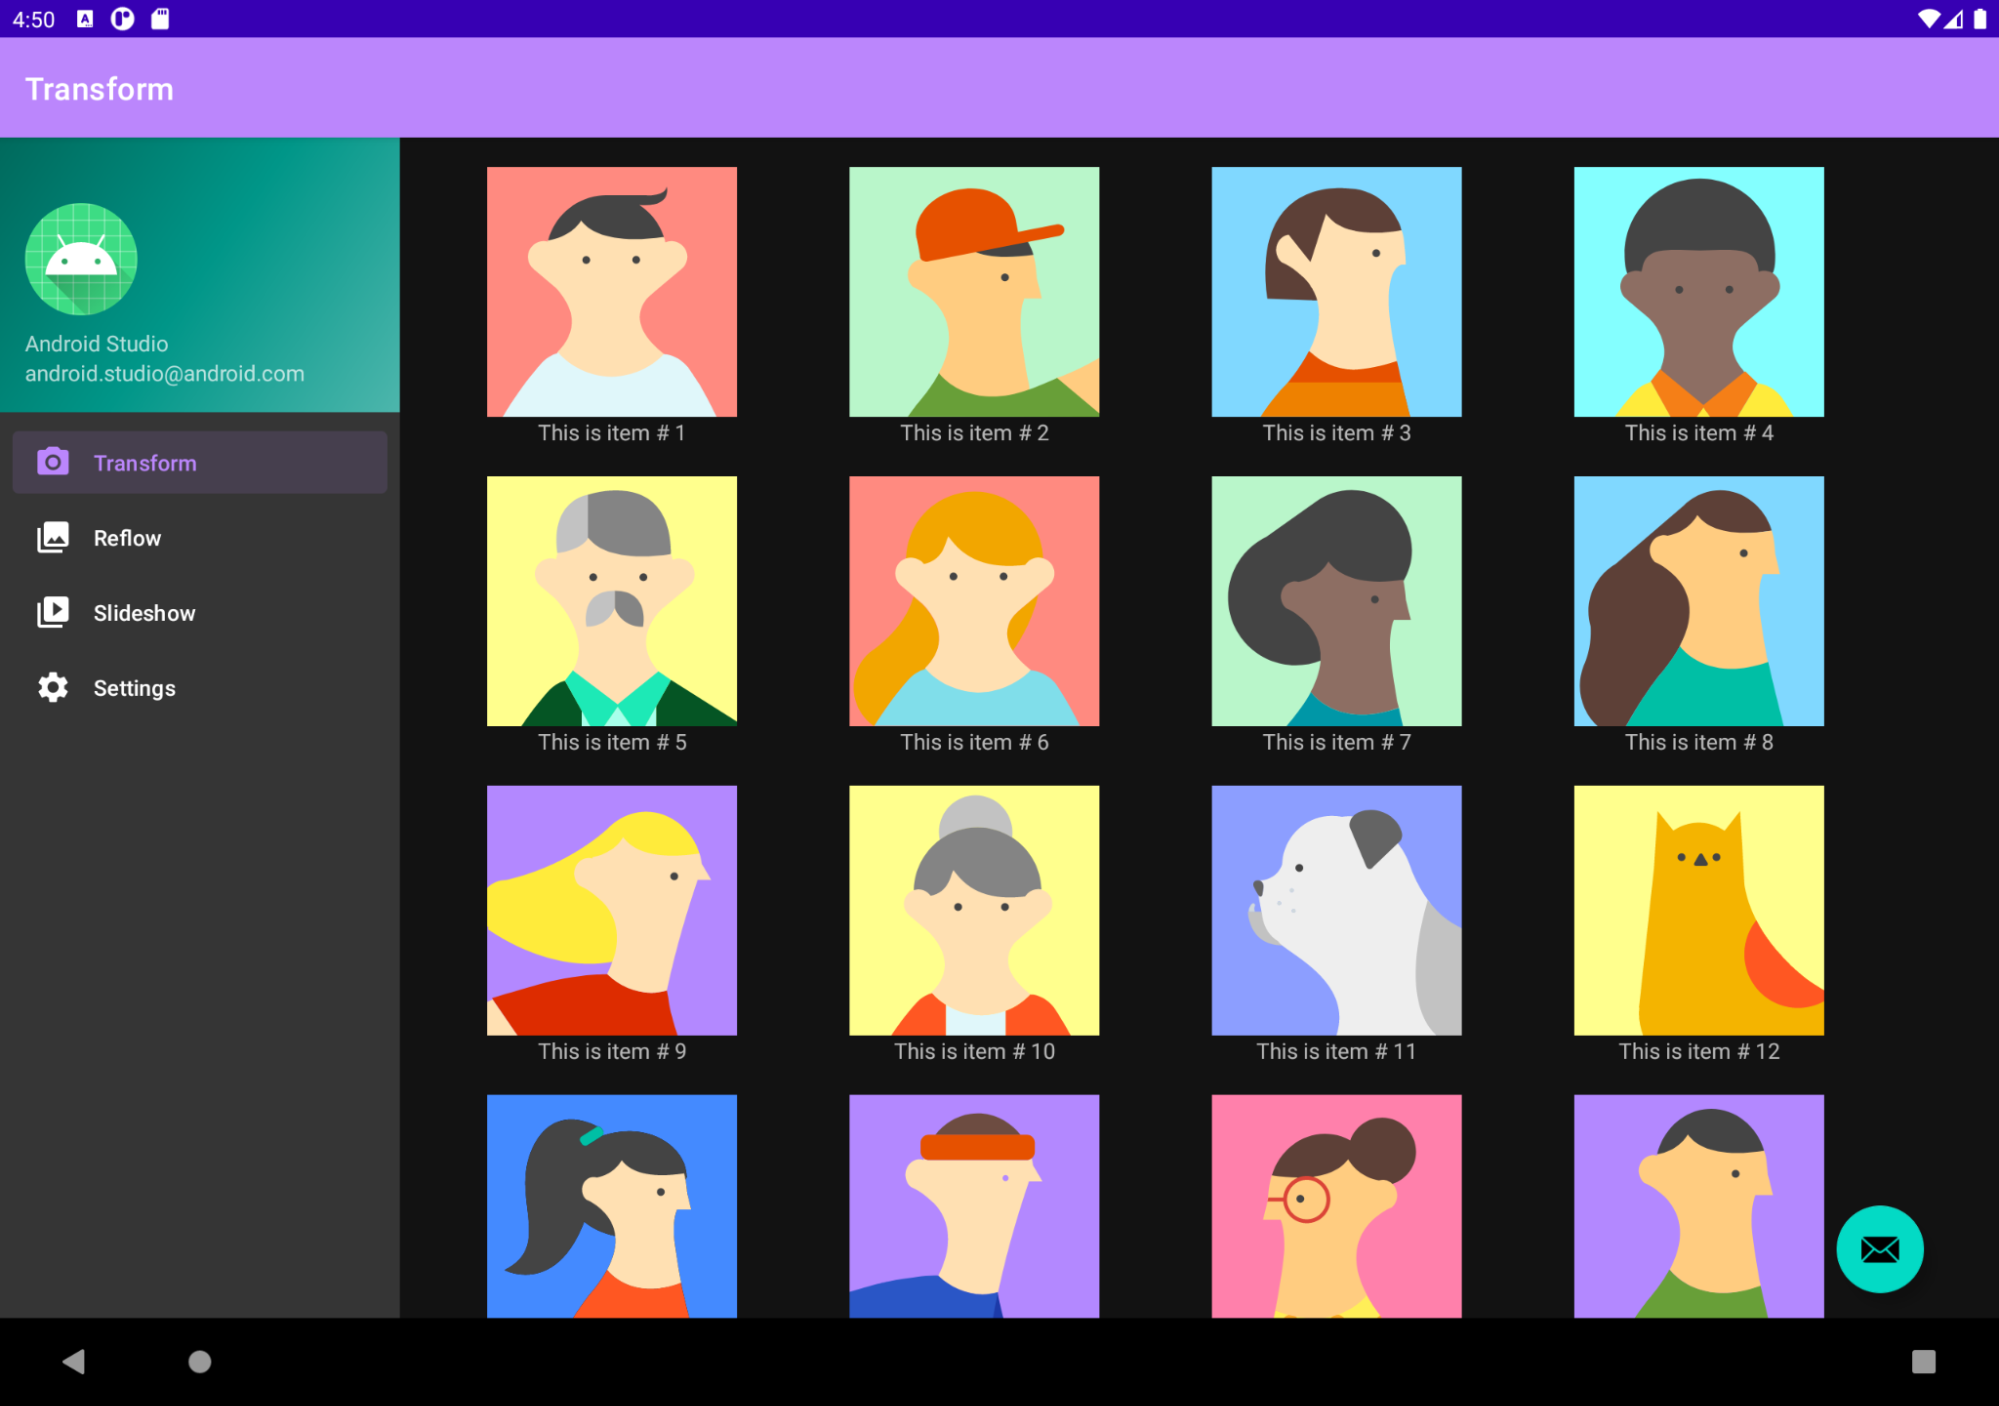
To get started, navigate to File > New, select either New Project or New Module, and select the Responsive Activity template.
Accessibility Scanner for Layout Editor
We have integrated Android Accessibility Test Framework in Android Studio to
help you find accessibility issues in your layouts. The tool reports
accessibility related issues and offers suggested fixes for some common problems
(i.e. missing content descriptions, or low contrast). To launch the panel, click
on the error report button
 in the Layout Editor.
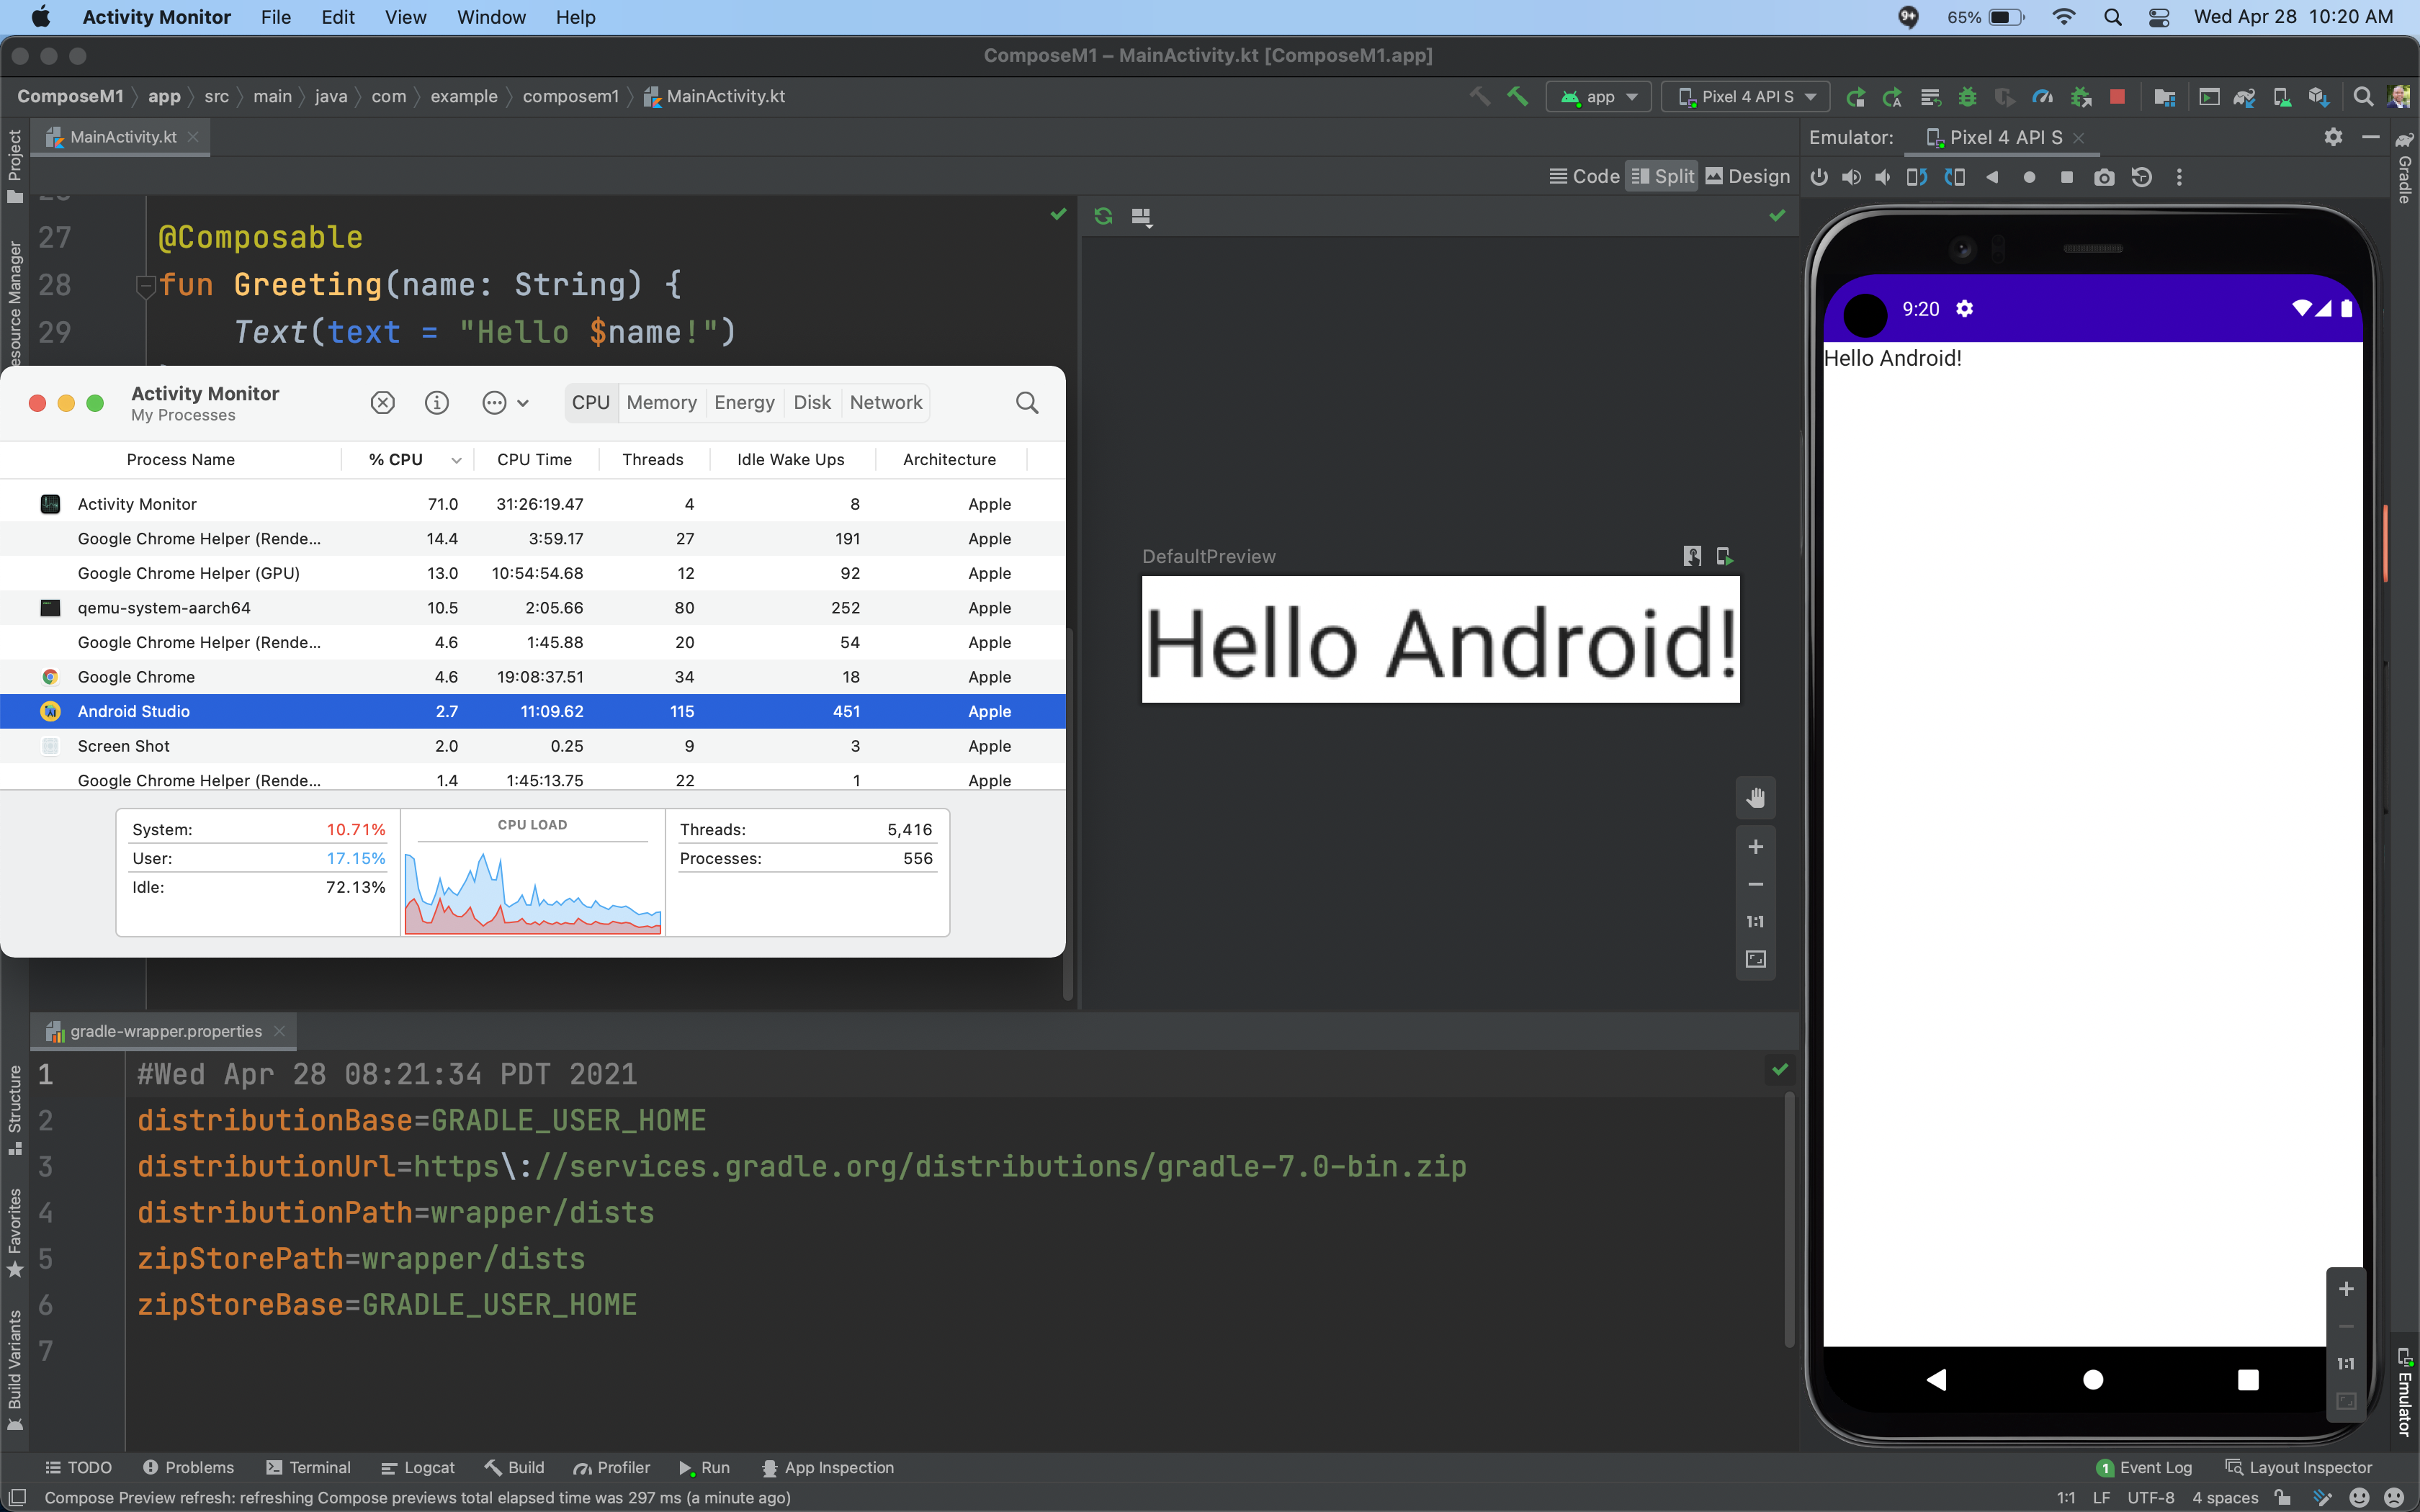
Support for Apple silicon
Android Studio and Android Emulator now contain initial support for core developer workflows when running the Apple silicon (arm64) hardware architecture, including corresponding emulator system images.
Support is not yet available for all SDK and NDK command-line tools. You may have to run Rosetta 2 on your machine to run some tools.
Known issues for Arctic Fox
This section describes current known issues in Android Studio Arctic Fox.
Patches not working on Windows for v3.6-v4.1
Patches on Windows platform for v3.6-v4.1 to Android Studio Arctic Fox stable may not work.
Patch releases
The following are patch releases in Android Studio Arctic Fox.
Android Studio Arctic Fox | 2020.3.1 Patch 4 (December 2021)
This minor update includes the following bug fixes:
- Android Gradle Plugin
- Setting a
ProviderforVariantOutput.versioncan break with configuration cache gradeResValues.xmlnot updated on signing for release
- Setting a
- D8/R8
java.lang.ClassCastExceptionthrown in class' constructor in build minified by R8- Unreachable type adjustment during dex merging
java.lang.VerifyError: Verifier failed to verify because instance field cannot be accessed from object of typeReference.java.lang.Object
- Lint
- Disable
MediaCapabilitieslint check - Lint reports false positive [Instantiable] error when
shrinkResourcesis enabled
- Disable
- Templates
Import Module option grayed out
For more information, see the 2020.3.1 Patch 4 blog post.
Android Studio Arctic Fox | 2020.3.1 Patch 3 (October 2021)
This minor update includes the following bug fixes:
- Android Gradle Plugin
- lint standalone plugin doesn't handle
gradleApi()dependency properly - JPS build triggered while Gradle build runs outside of Studio
- Enabling both KSP and Kapt in a project with both containing
processors that generate sources breaks
BundleLibraryClassesInputs
- lint standalone plugin doesn't handle
- C++ Editor
- UI freezes due to long
JniReferencesSearchcomputation in background
- UI freezes due to long
- Database Inspector
- Allow saving DBs
- Unable to export data using App Inspection/Database Inspector with blank space in path
- Dexer (D8)
- Java lambdas cause unexpected behavior when subclassing subclasses
- Shrinker (R8)
Cannot constrain typeerror during r8 minification- Issue while executing R8 3.0.69 (from AGP 7.0.2) and 3.0.72
For more information, see the 2020.3.1 Patch 3 blog post.
Android Studio Arctic Fox | 2020.3.1 Patch 2 (September 2021)
This minor update includes the following bug fixes:
- Android Gradle Plugin
- Gradle sync launched 10 TIMES on upgrade from AS Arctic Fox Canary 7 to Canary 8
- Desugaring and reproducible builds
- C++ Build
- Android Gradle Plugin 7.0.0 does not include jniLibs in APK if tasks.whenTaskAdded closure is used
- Editing
- MergedManifestRefreshListener gets stuck in an infinite loop in Arctic Fox
- Lint
- "Lint check for lint checks" not running
- Shrinker (R8)
- ClassNotFoundException when running build with R8 in AGP7
For more information, see the 2020.3.1 Patch 2 blog post.
Android Studio Arctic Fox | 2020.3.1 Patch 1 (August 2021)
This update includes fixes for the following issues:
- Android Gradle Plugin
- TypedefRemover uses ASM5 and is incompatible with JDK 11 sources that require ASM7
- Some new DSL blocks can't be used from Groovy DSL in AGP 7.0.0
- AGP 7.0.0 stable throws an ExternalApiUsageException on libraryVariants.all{applicationId}
- C++ Debugger
- AS Arctic Fox Error while starting native debug session on Mac M1, "Found broken LLDB configuration"
- Resource Manager
- (Windows) New > Vector Asset > picture.svg: invalid 'minus' character in generated xml
- Shrinker (R8)
- NPE in BridgeHoisting
- After upgrade to 7.0.0, R8 crashes with "Unexpected usage left in method after inline" error
For more information, see the 2020.3.1 Patch 1 blog post.