Stay organized with collections
Save and categorize content based on your preferences.
Similar to devices running on the Android platform, apps on Go devices
should still be performant for end-users. There are ways to minimize inefficient
uses of resources, such as CPU, memory, graphics, network, or device battery.
To fix performance issues, you can use the profiling and benchmarking tools,
along with the guidance provided for Android at
Profile your app performance.
Testing requirements
Here are a few key guidelines to keep in mind when profiling and testing your
Android (Go edition) app:
Test on a device that supports Android 8.1 (API level 27) or above. It's
important to use real devices (if possible) instead of an emulator, as CPU
performance may impact results.
Monitor your RAM usage through tools like Android Studio Memory Profiler
or Perfetto to keep
track of how much memory is being consumed. Identifying memory leaks and
memory churn can lead to a reduction in app crashes and overall jank.
To incrementally release memory based on certain system constraints, you
can implement onTrimMemory.
This callback allows apps to release resources to help provide a more
responsive system overall, and also directly benefits the end-user
experience for your app by allowing the system to keep your process alive
longer. For more information, see the documentation on
ComponentCallbacks.
Ensure that you disable all features
not supported
on Android (Go edition).
Android vitals for Go devices
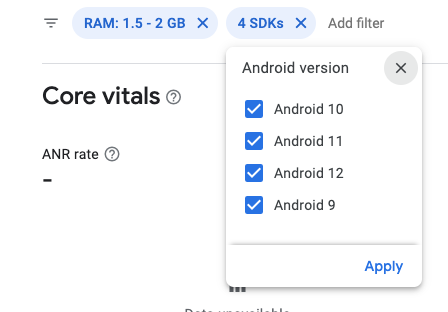
To view Android vitals statistics for your apps
running on Android (Go edition) devices, navigate to the Google Play Console and
set the following filters and device configurations:
Device type: Android Go
Android version: 8.1 & above
RAM: 2GB (as of Android 13 (API level 33) and higher). For a full list
of device and hardware specifications, see Minimum hardware specifications.
Figure 1. Set the following filters in the Play console
to see metrics for your apps running on Android (Go edition) devices.
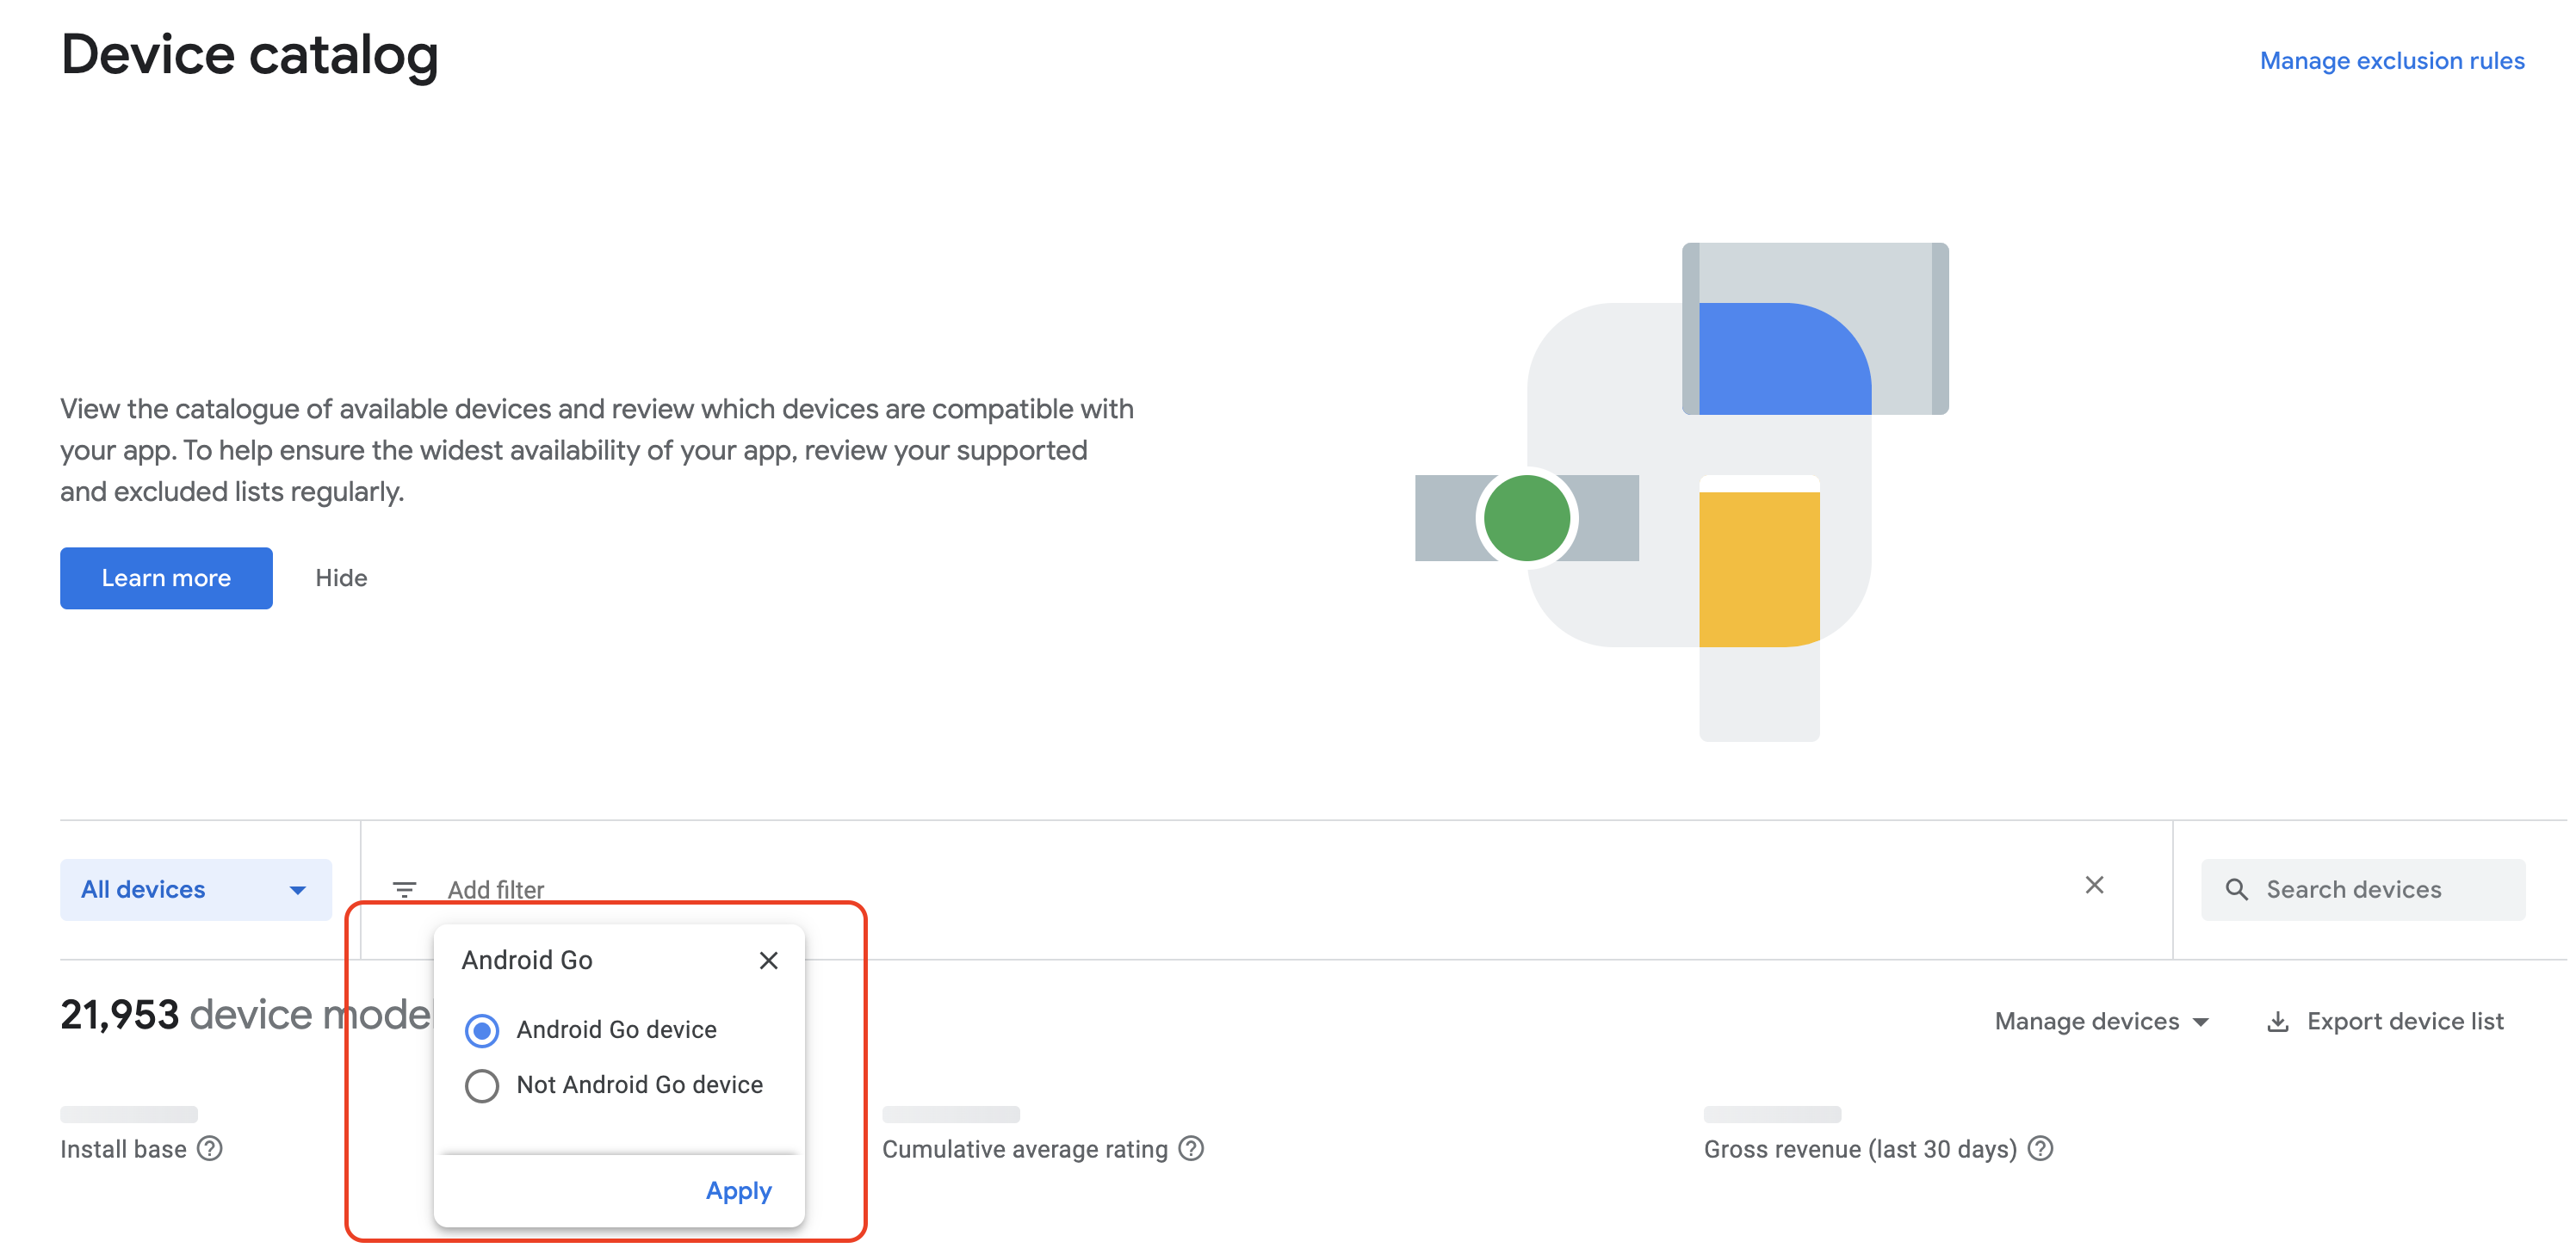
To view any apps running specifically on Android (Go edition) devices, you
can apply the Android Go filter in the Device Catalog as shown in Figure 2.
Figure 2. Apply the Android Go
device filter in the
Play console to fetch metrics for users running
on Android (Go edition) devices.
Content and code samples on this page are subject to the licenses described in the Content License. Java and OpenJDK are trademarks or registered trademarks of Oracle and/or its affiliates.
Last updated 2023-05-09 UTC.
[[["Easy to understand","easyToUnderstand","thumb-up"],["Solved my problem","solvedMyProblem","thumb-up"],["Other","otherUp","thumb-up"]],[["Missing the information I need","missingTheInformationINeed","thumb-down"],["Too complicated / too many steps","tooComplicatedTooManySteps","thumb-down"],["Out of date","outOfDate","thumb-down"],["Samples / code issue","samplesCodeIssue","thumb-down"],["Other","otherDown","thumb-down"]],["Last updated 2023-05-09 UTC."],[],[],null,["# Test Android (Go edition) apps\n\nSimilar to devices running on the Android platform, apps on Go devices\nshould still be performant for end-users. There are ways to minimize inefficient\nuses of resources, such as CPU, memory, graphics, network, or device battery.\n\nTo fix performance issues, you can use the profiling and benchmarking tools,\nalong with the guidance provided for Android at\n[Profile your app performance](/studio/profile).\n\nTesting requirements\n--------------------\n\nHere are a few key guidelines to keep in mind when profiling and testing your\nAndroid (Go edition) app:\n\n- Test on a device that supports Android 8.1 (API level 27) or above. It's important to use real devices (if possible) instead of an emulator, as CPU performance may impact results.\n- Monitor your RAM usage through tools like Android Studio [Memory Profiler](/studio/profile/memory-profiler) or [Perfetto](https://perfetto.dev/docs/data-sources/memory-counters) to keep track of how much memory is being consumed. Identifying memory leaks and memory churn can lead to a reduction in app crashes and overall jank.\n - To incrementally release memory based on certain system constraints, you can implement [`onTrimMemory`](/reference/android/content/ComponentCallbacks2#onTrimMemory(int)). This callback allows apps to release resources to help provide a more responsive system overall, and also directly benefits the end-user experience for your app by allowing the system to keep your process alive longer. For more information, see the documentation on [`ComponentCallbacks`](/reference/android/content/ComponentCallbacks2).\n- Ensure that you disable all features [not supported](/guide/topics/androidgo#differences_from_android) on Android (Go edition).\n\nAndroid vitals for Go devices\n-----------------------------\n\nTo view [Android vitals](/topic/performance/vitals) statistics for your apps\nrunning on Android (Go edition) devices, navigate to the Google Play Console and\nset the following filters and device configurations:\n\n- **Device type**: Android Go\n- **Android version**: 8.1 \\& above\n- **RAM** : 2GB (as of Android 13 (API level 33) and higher). For a full list of device and hardware specifications, see [Minimum hardware specifications](/guide/topics/androidgo#hardware-reqs).\n\n**Figure 1.** Set the following filters in the Play console to see metrics for your apps running on Android (Go edition) devices.\n\nTo view any apps running specifically on Android (Go edition) devices, you\ncan apply the **Android Go** filter in the Device Catalog as shown in Figure 2.\n**Figure 2.** Apply the Android Go device filter in the Play console to fetch metrics for users running on Android (Go edition) devices."]]