
These examples show how to use system tracing with Macrobenchmark, along with memory profiling, to measure and improve certain kinds of performance problems.
Debugging app startup using systrace
When debugging startup time, we recommend using systrace logs. Systrace is a system that uses pre-instrumented code to output how long certain events take when they happen. These traces allow you to see what is happening in your application, or even in other processes across the system. The Android platform and Jetpack libraries have instrumentation around many key events in an application, and these are logged accordingly. You can also instrument your applications with your own custom traces, which will show up in the same systrace visualization tools, to give an overall picture of what happened in the application.
Using systrace or Perfetto
To learn more about basic systrace usage, see the following video: Debugging Application Performance.
In order to analyze startup time, you must first understand what happens during startup. If you want more information than what is explained on this page, the documentation on App startup time provides an overview of the application startup process.
The stages of app startup are:
- Launch the process
- Initialize generic application objects
- Create and initialize activity
- Inflate the layout
- Draw the first frame
Startup types have the following stages:
- Cold start: This occurs when the application is being started for the first time since boot, or since the application process was killed, either by the user or by the system. Startup creates a new process with no saved state.
- Warm start: This occurs when the application is already running in the background, but the activity must be recreated and brought to the foreground. The activity is either recreated while reusing the existing process, or the process is recreated with saved state. The Macrobenchmark testing library supports consistent warm startup testing using the first option.
- Hot start: This occurs when the process and activity are still running and merely need to be brought to the foreground, possibly recreating some objects as necessary, as well as rendering the new foreground activity. This is the shortest startup scenario.
We recommend capturing systraces using the on-device system tracing app available in Developer Options. If you'd like to use command-line tools, Perfetto is available for use with Android 10 (API level 29) and higher, while devices on earlier versions should use systrace.
Note that the term “first frame” is a bit of a misnomer since applications can vary significantly in how they handle startup after creating the initial activity. Some applications will continue inflation for several frames, while others will even immediately launch into a secondary activity.
When possible, we recommend that you include a
reportFullyDrawn
call (available on Android 10 and higher) when startup is completed from the
application’s perspective.
Some things to look for in these system traces include:

Figure 1. Competition for monitor-protected resources can introduce
significant delay in app startup.
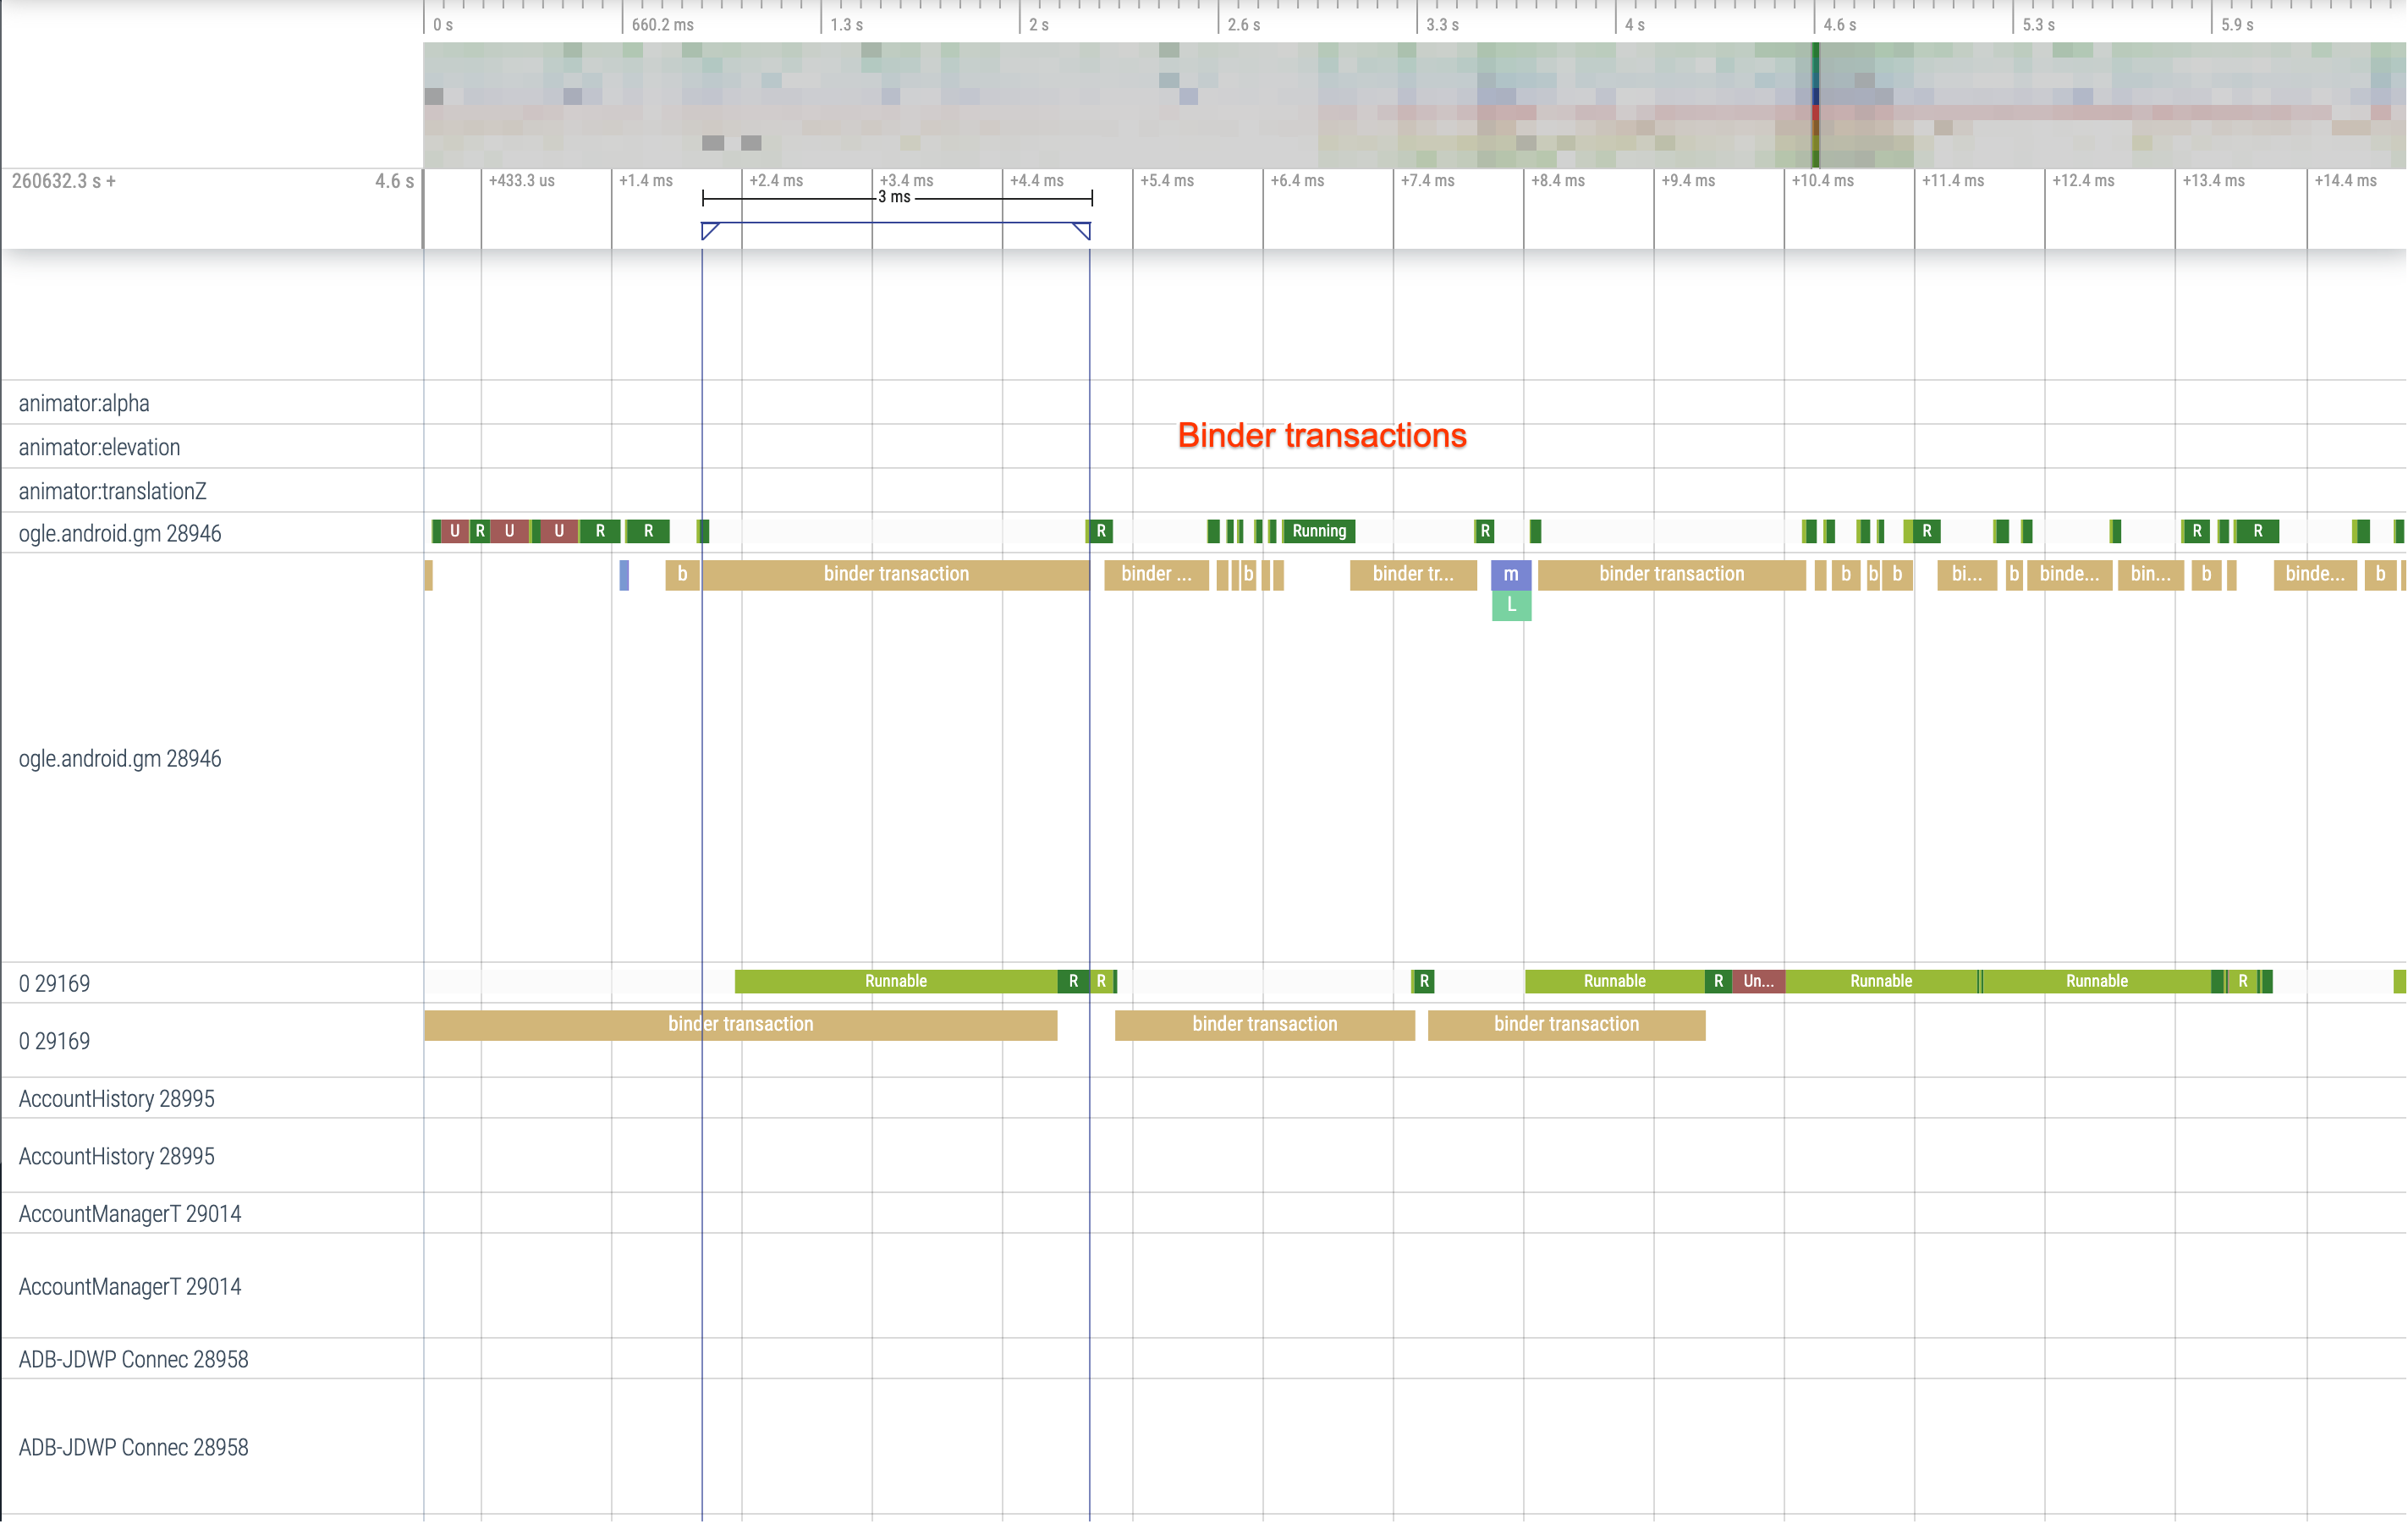
Figure 2. Look for unnecessary transactions in your application’s critical path.
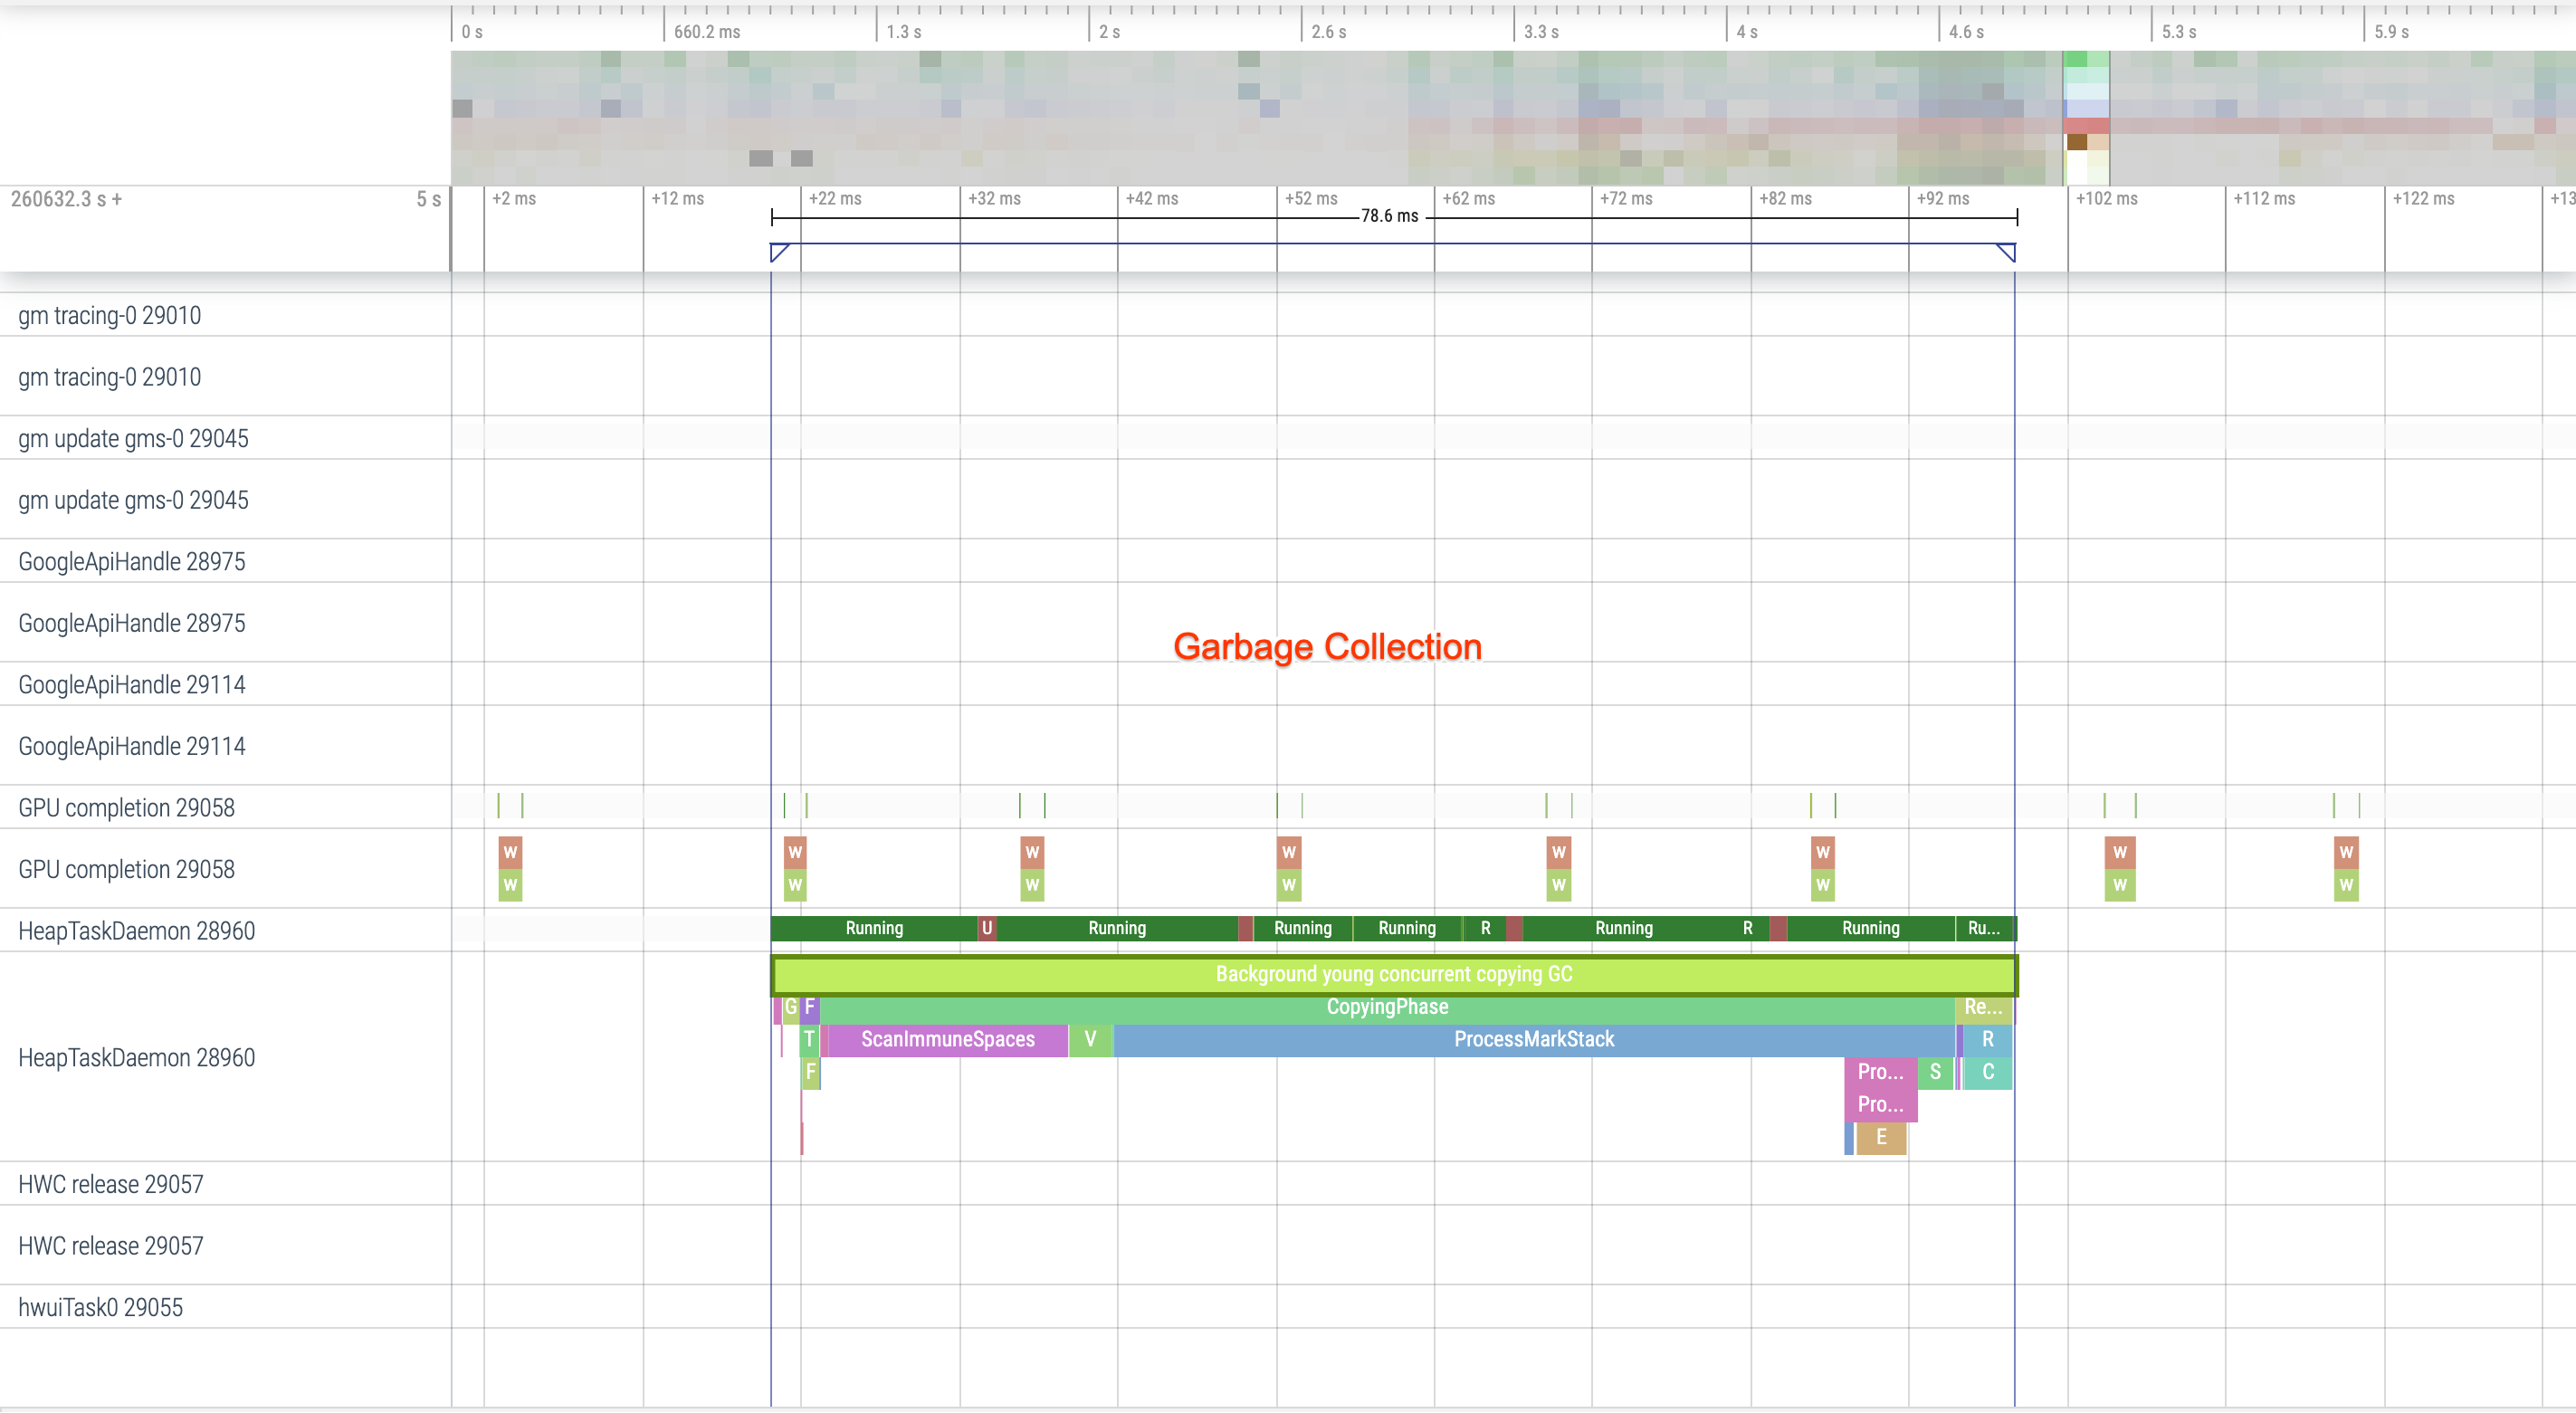
Figure 3. Concurrent garbage collection is common and has relatively low
impact, but if you’re hitting it often consider investigating it with the
Android Studio memory profiler.
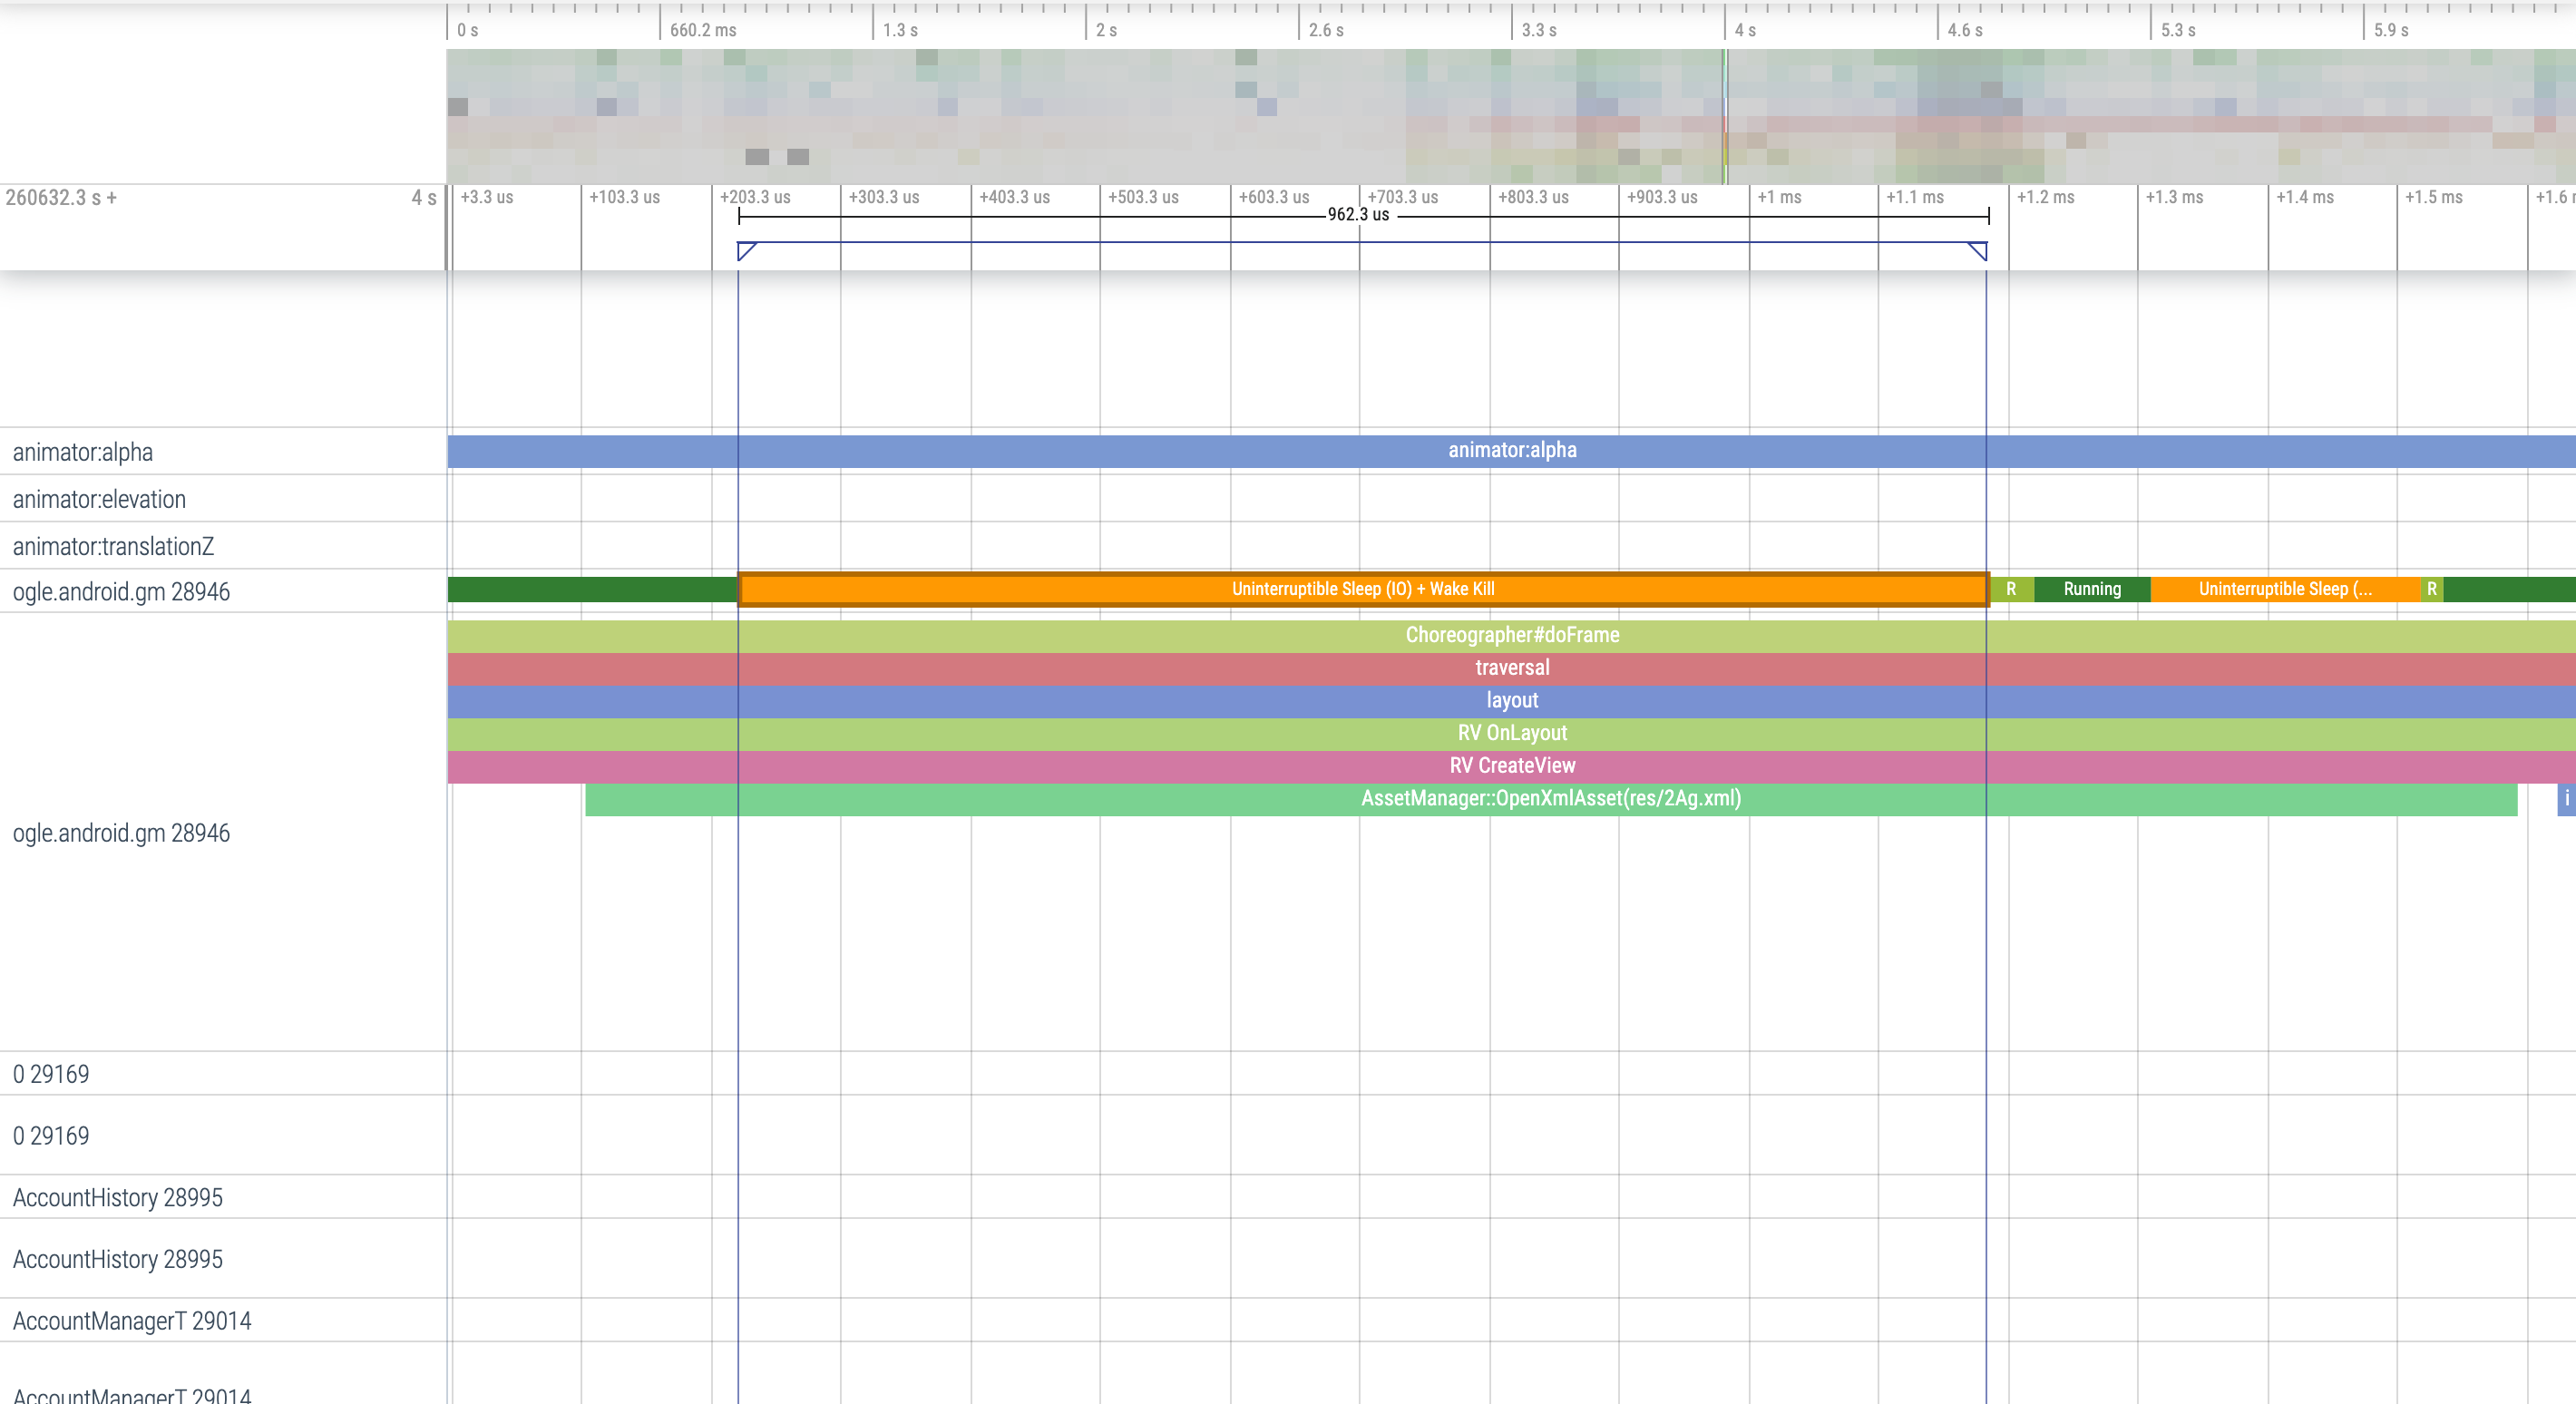
Figure 4. Check for I/O during startup and look for long
stalls.
With figure 4, note that other processes performing I/O at the same time can cause I/O contention, so ensure that other processes are not running.
Significant activity on other threads can interfere with the UI thread, so watch out for background work during startup. Note that devices can have different CPU configurations, so the number of threads that can run in parallel can vary across devices.
Also check out the guide on common sources of jank
Use Android Studio memory profiler
The Android Studio memory profiler is a powerful tool to reduce memory pressure that could be caused by memory leaks or bad usage patterns. It provides a live view of object allocations and collections.
To fix memory problems in your app, you can use the memory profiler to track why and how often garbage collections happen, as well as whether there are possible memory leaks causing your heap to constantly increase over time.
Profiling app memory breaks down into the following steps:
1. Detect memory problems
To detect memory problems, start by recording a memory profiling session for your app. Next, look for an object whose memory footprint is increasing, eventually triggering a garbage collection event.
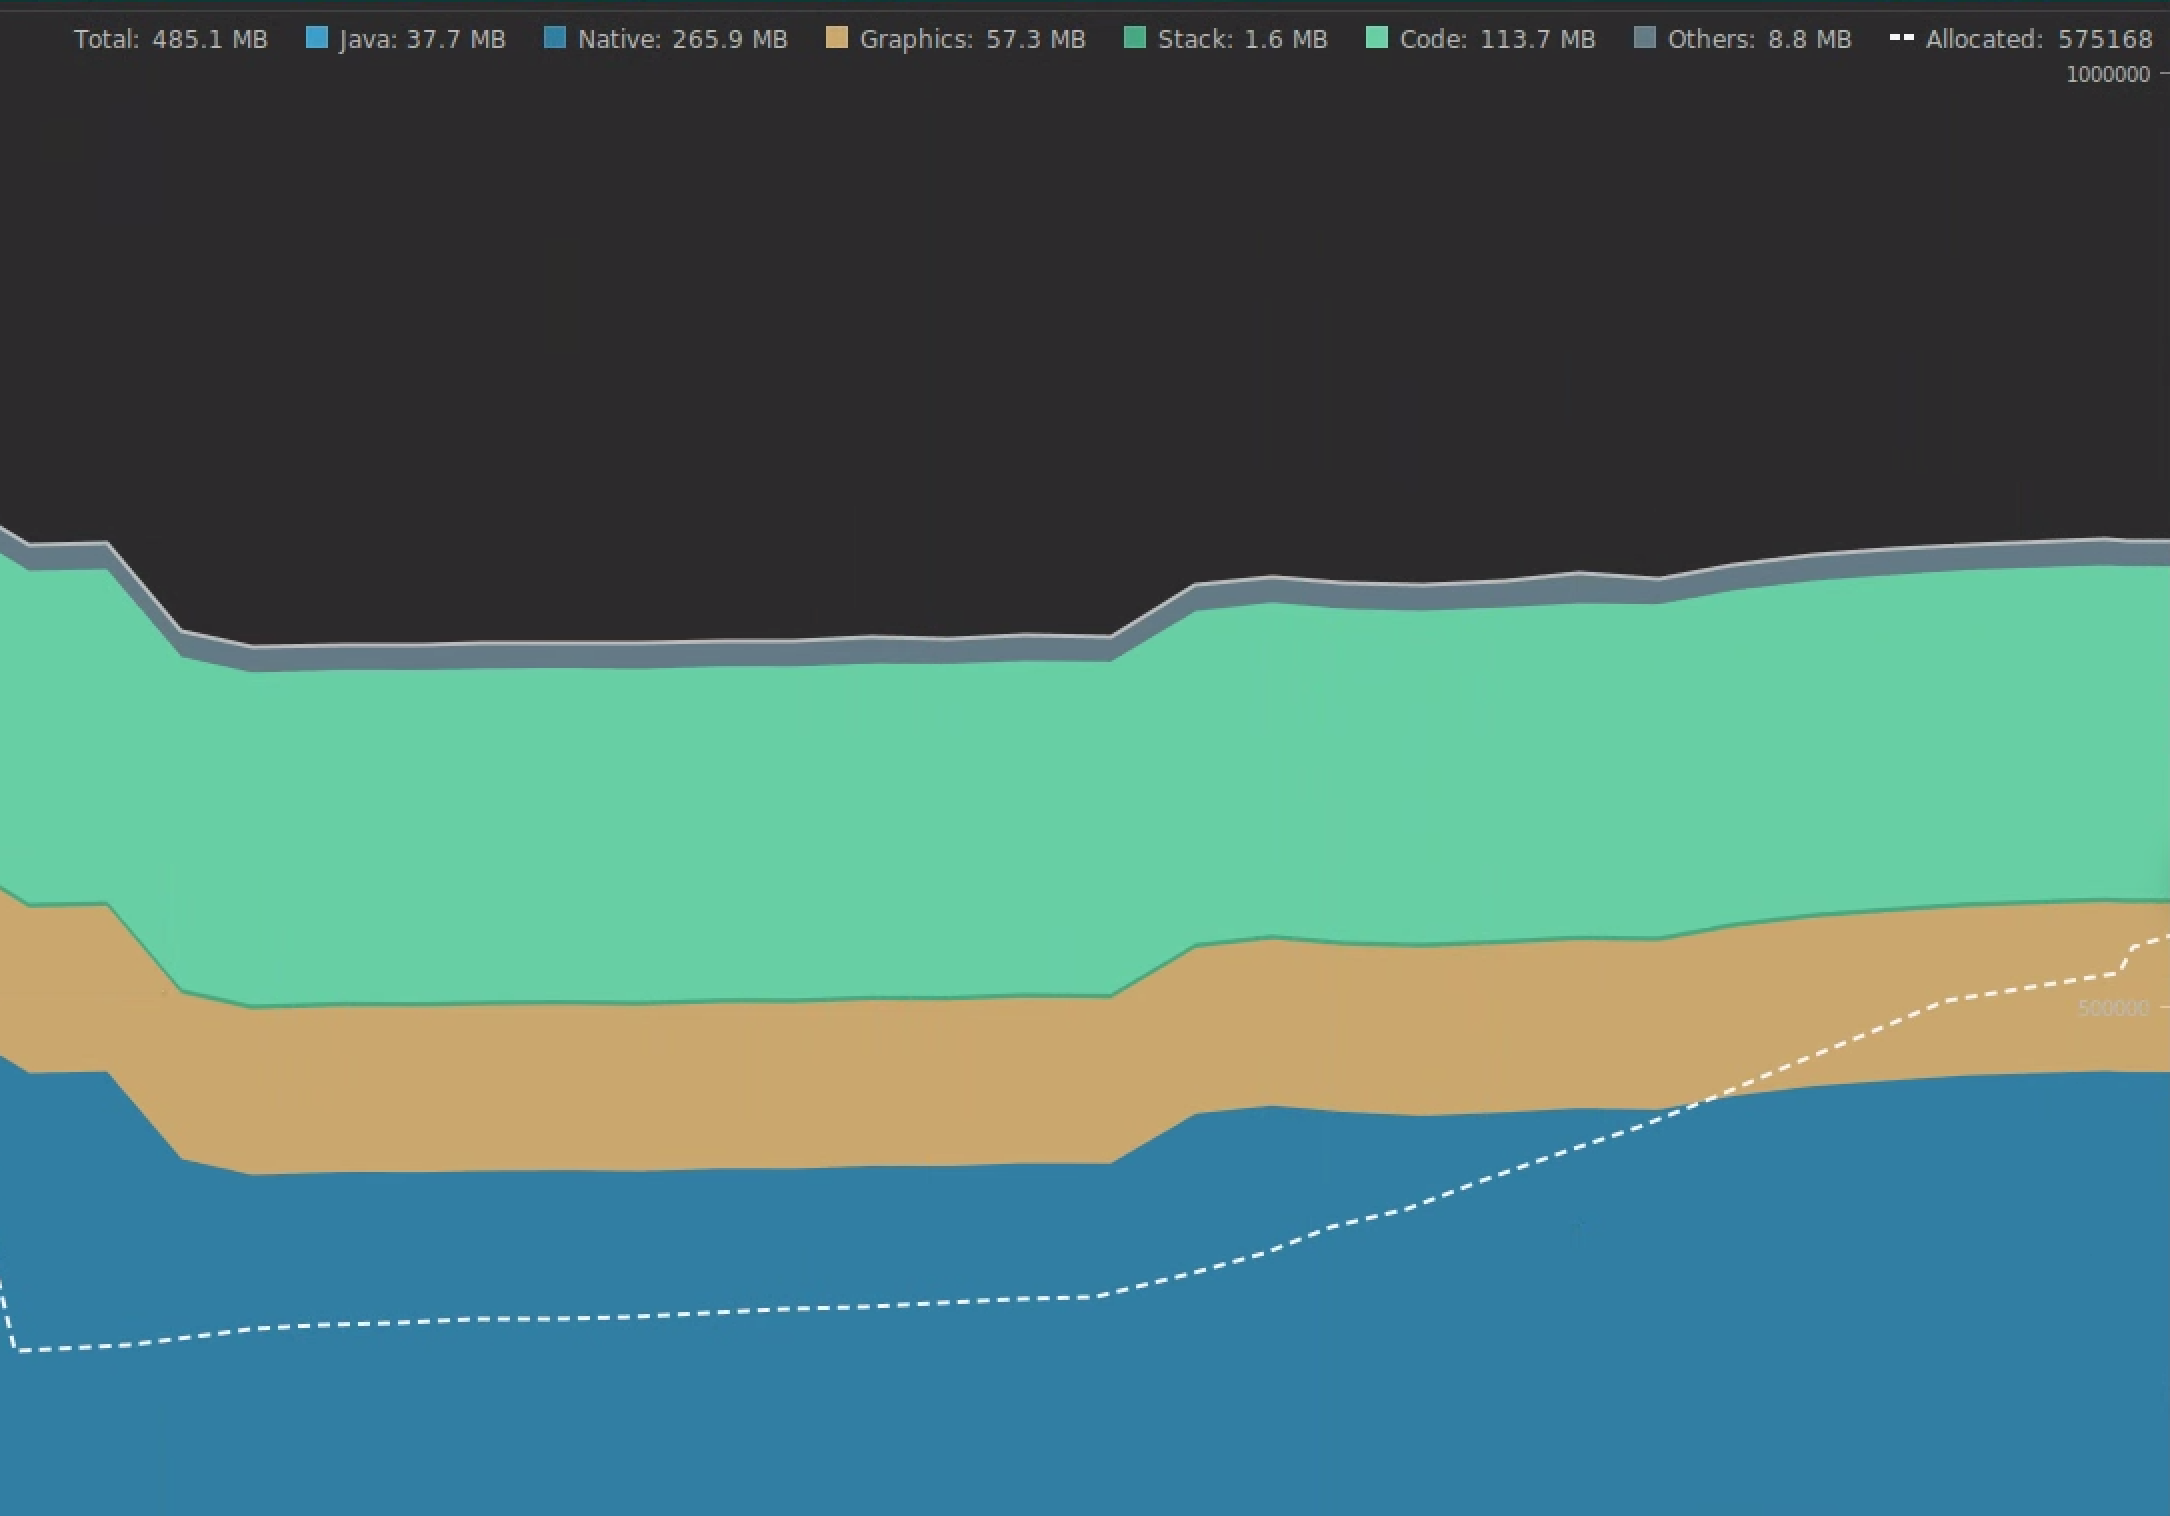
Figure 5. The memory profiler showing increased allocations of objects
over time.
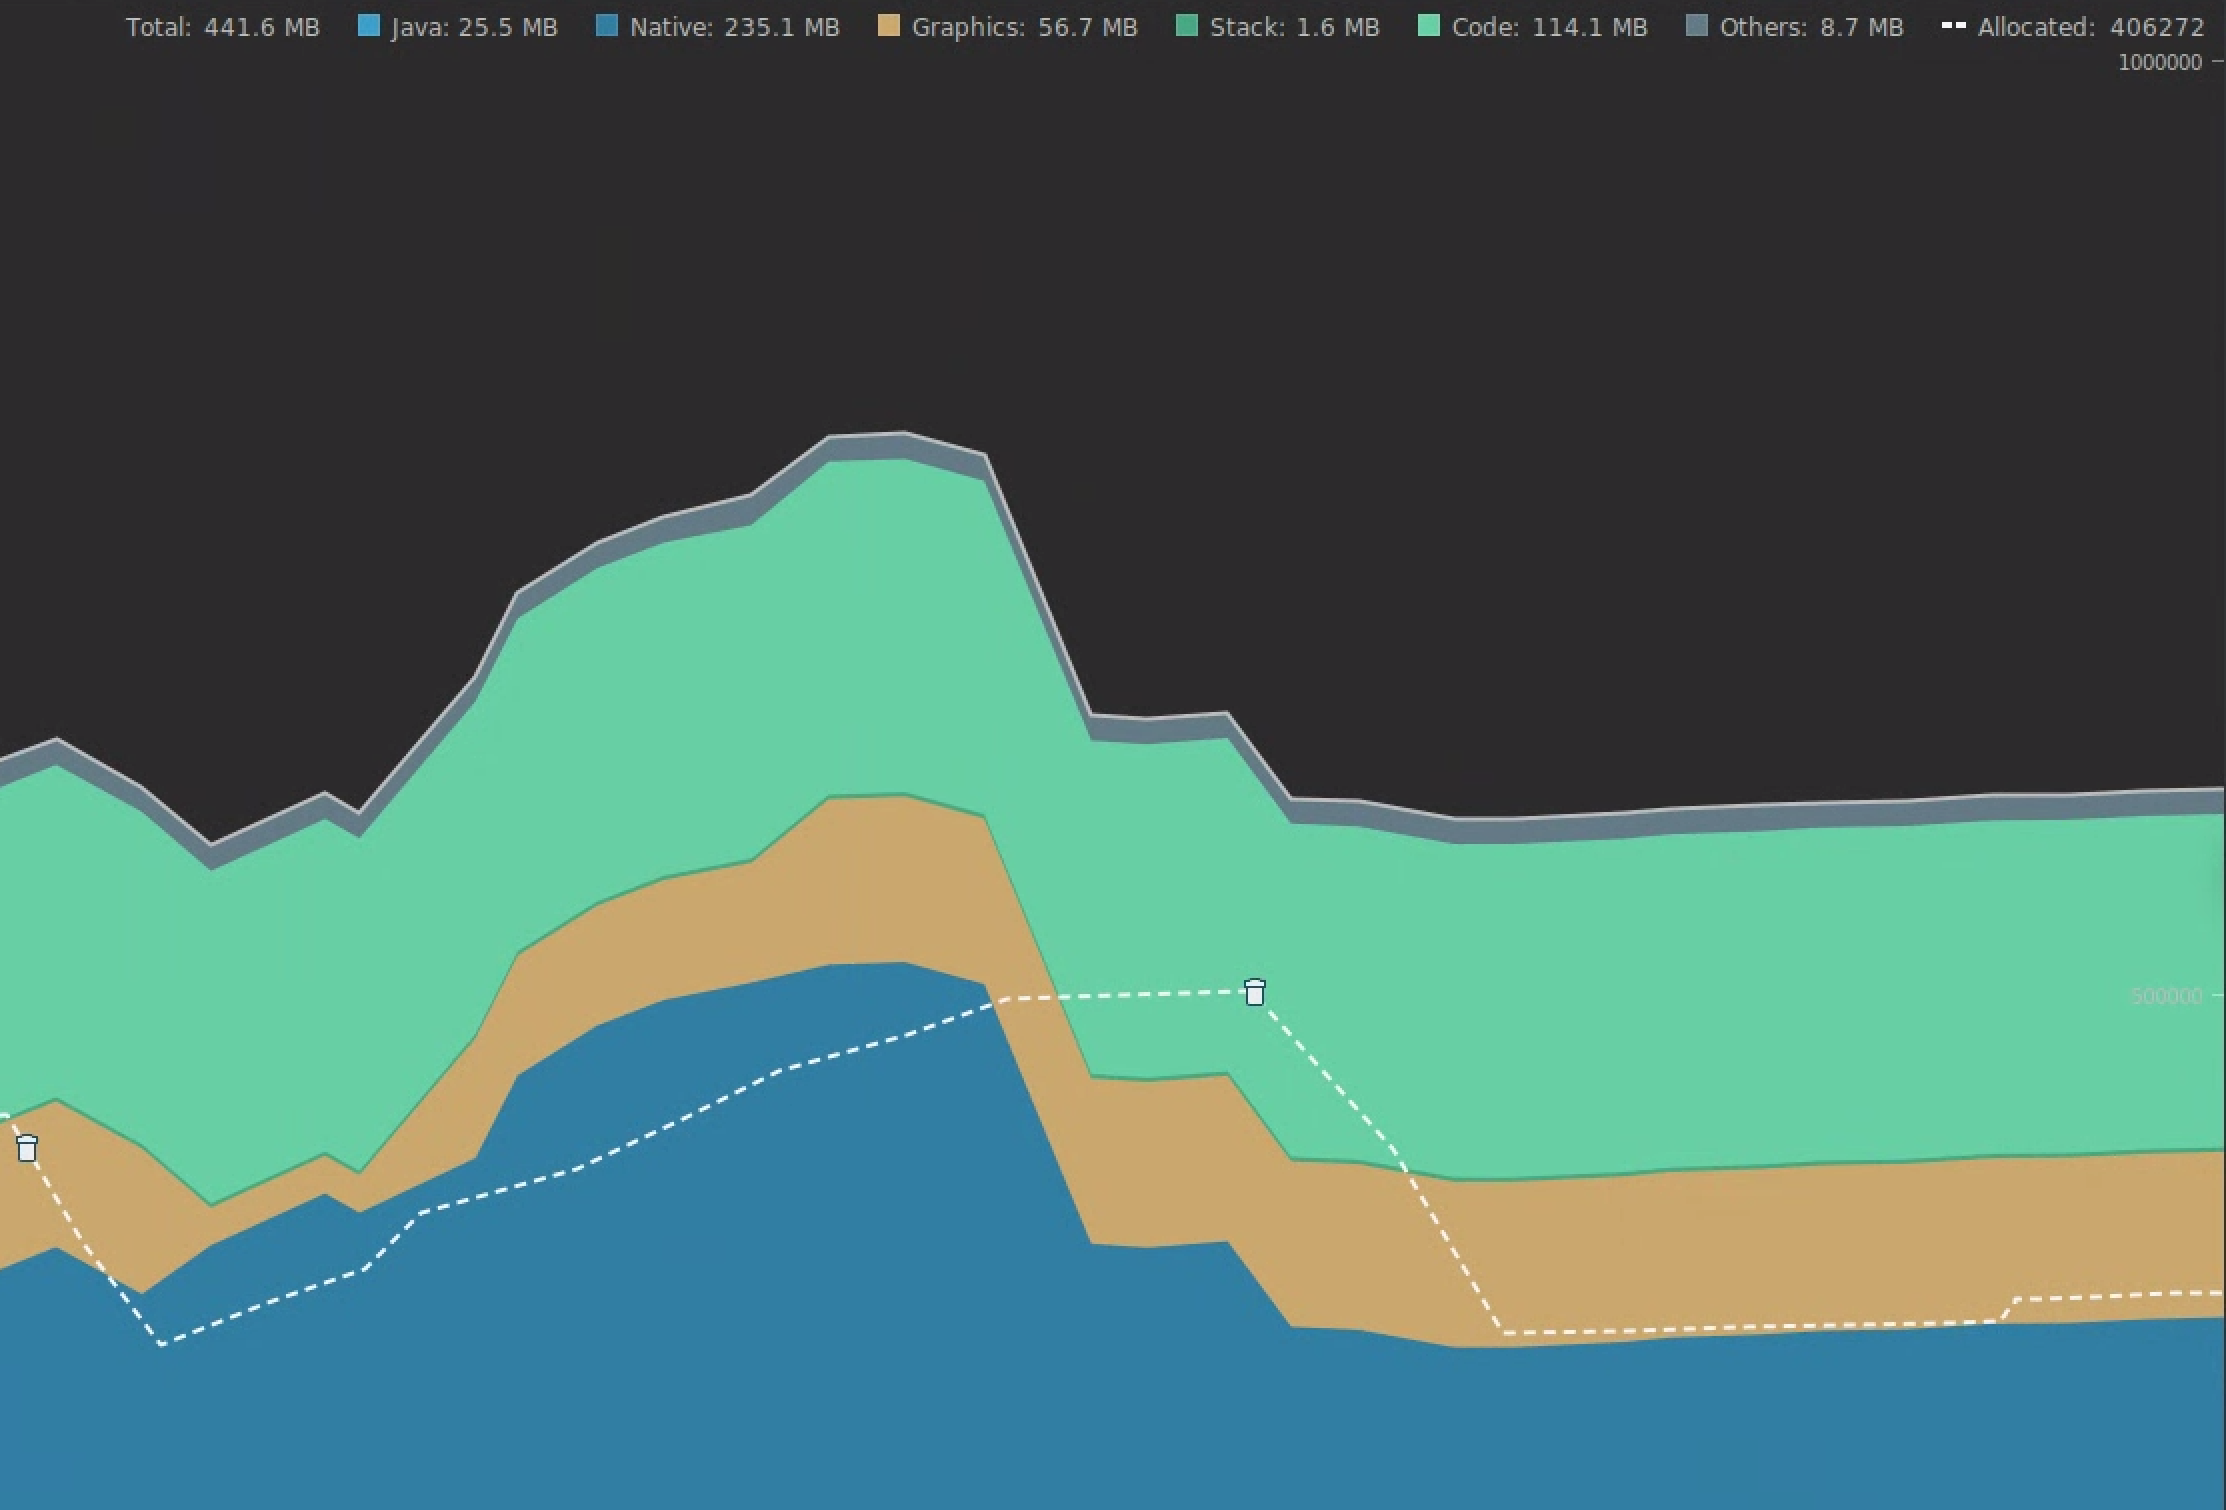
Figure 6. The memory profiler showing garbage collection events.{.:image-caption}
Once you have identified a use case that is adding memory pressure, start analyzing for root causes.
2. Diagnose memory pressure hot spots
Select a range in the timeline to visualize both allocations and shallow size.
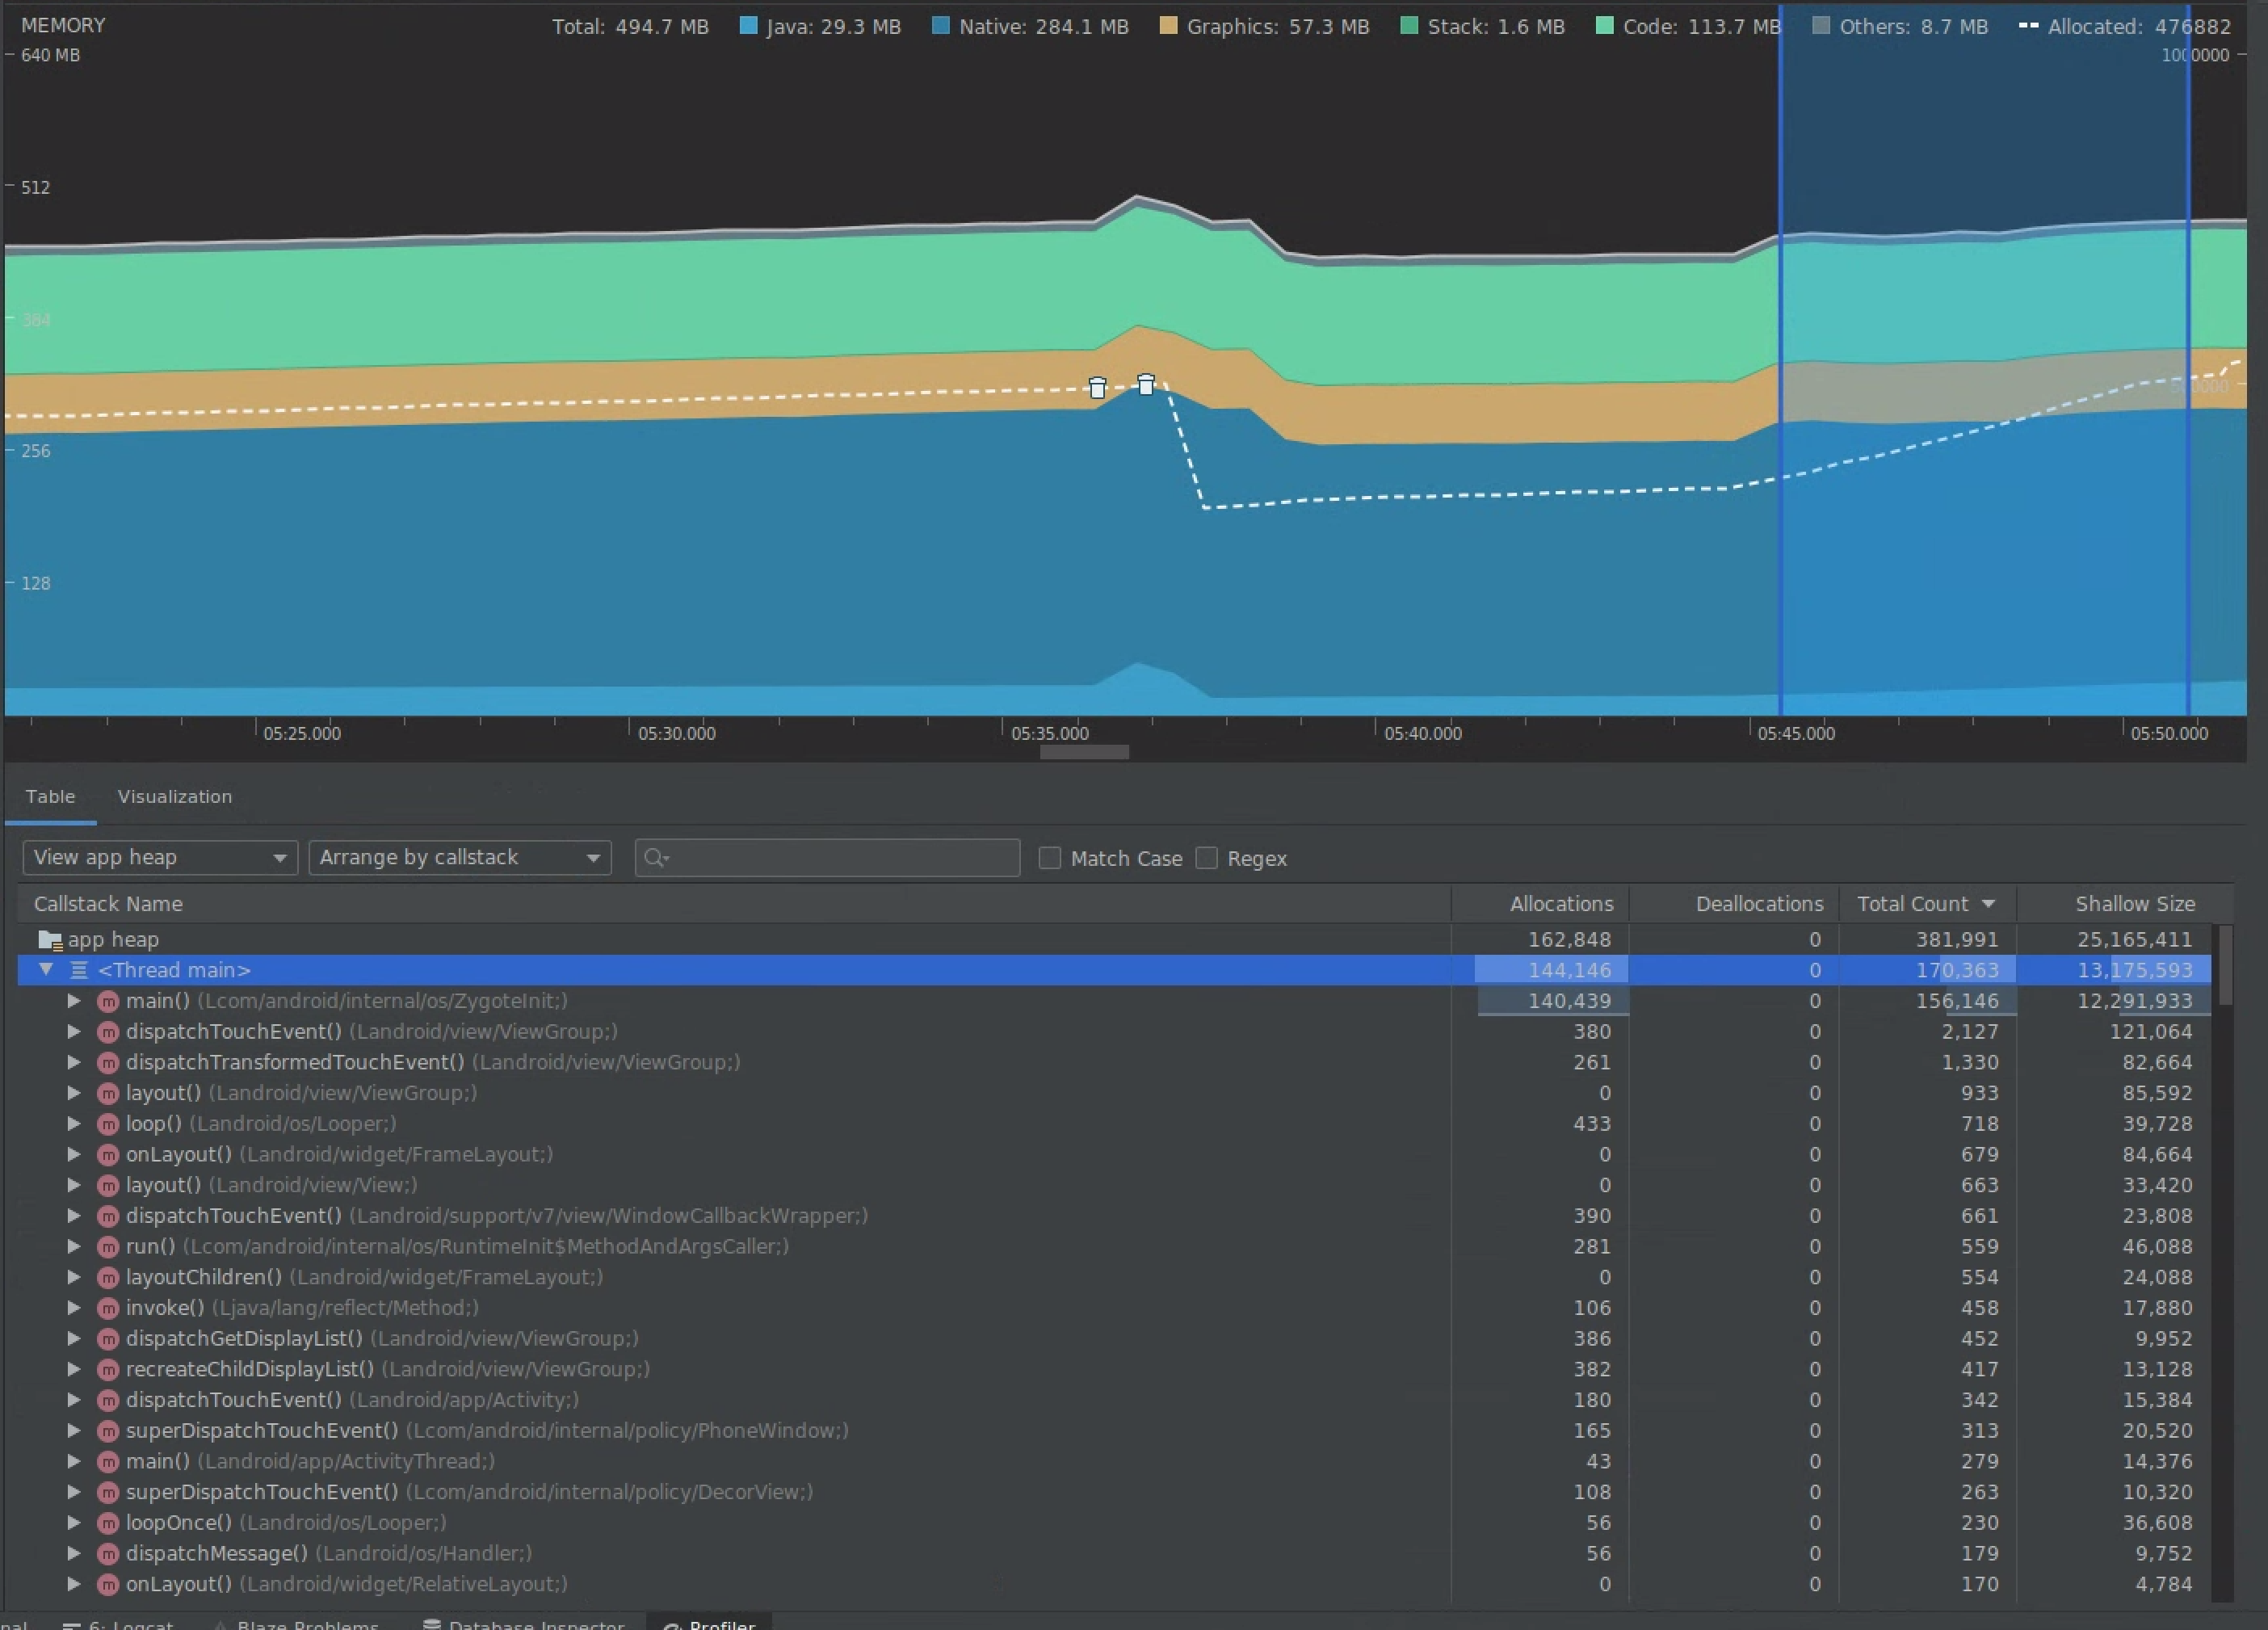
Figure 7. The memory profiler showing allocations and sizes for a selected
range in the timeline.
There are multiple ways to sort this data. The following sections provide some examples of how each view can help you analyze problems.
Arrange by class
Arranging by class is useful when you want to find classes that are generating objects that should otherwise be cached or reused from a memory pool.
For example, imagine you see an app creating 2,000 objects of class called “Vertex” every second. This would increase the allocations count by 2,000 every second and you would see it when sorting by class. Should such objects be reused to avoid generating that garbage? If the answer is yes, then likely implementing a memory pool will be needed.
Arrange by callstack
Arranging by callstack is useful when there is a hot path where memory is being allocated, such as inside a loop or a specific function doing a lot of allocation work. Viewing by callstack will allow you to see those allocation hotspots.
Shallow versus retained size
Shallow size tracks only the memory of the object itself, so it is most useful for tracking simple classes composed of primarily primitives.
Retained size shows the total memory allocated by the object directly as well as other objects allocated that are solely referenced by the object. It is useful for tracking memory pressure due to complex objects that require allocation of other objects and not just primitive fields. To get this value, create a memory dump using the memory profiler. The objects allocated in that heap are added to the display.

Figure 8. You can create a memory dump at any time by clicking on the Dump
Java heap button in the memory profiler toolbar.
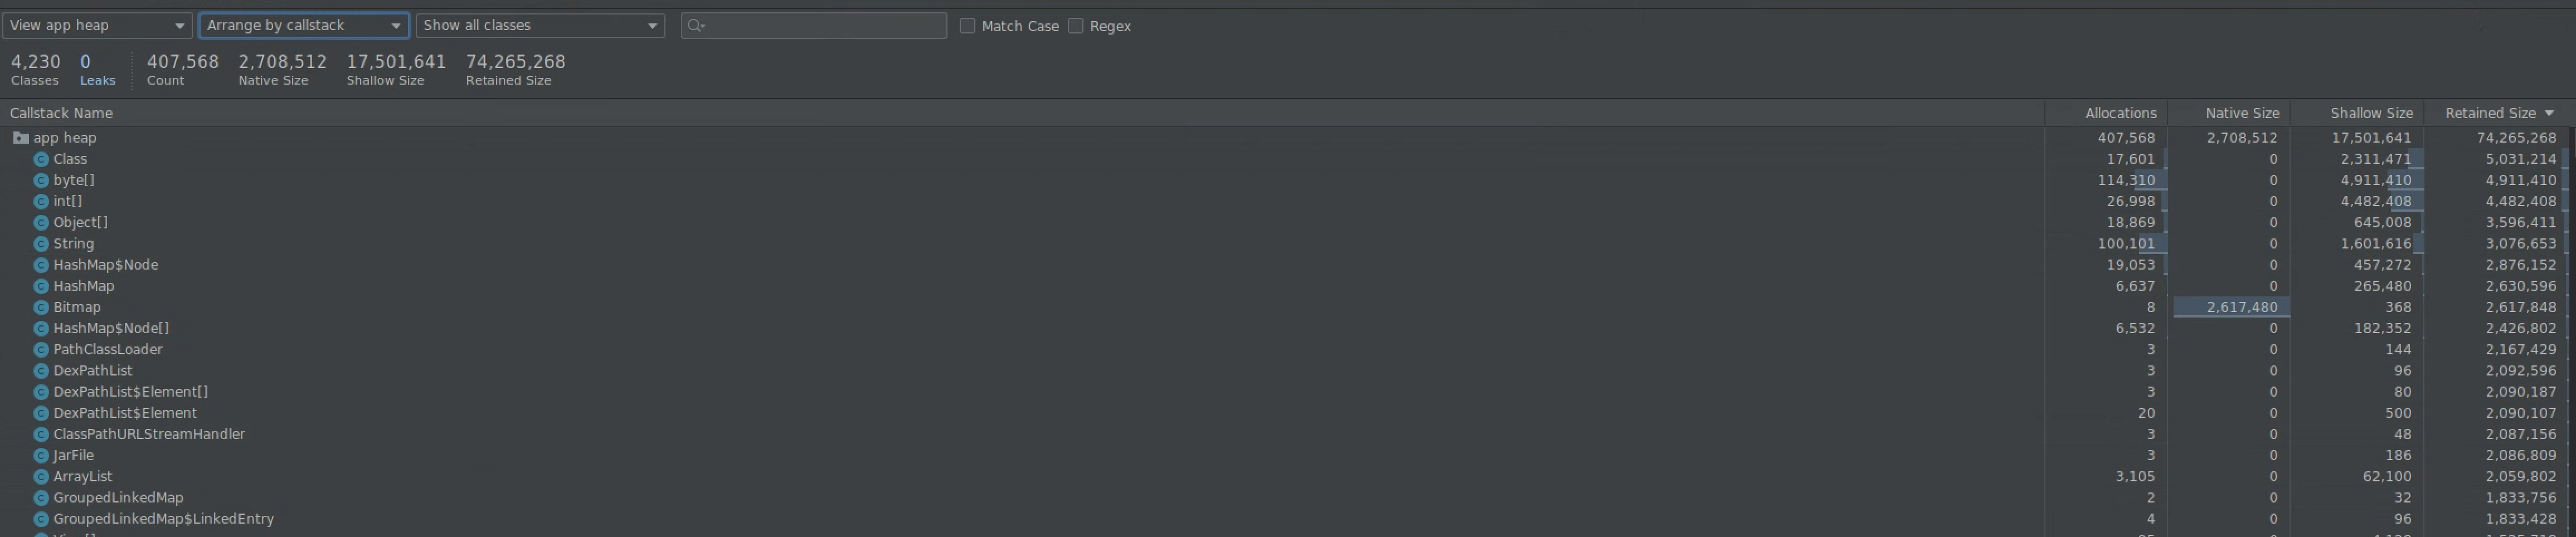
Figure 9. Crearting a memory dump displays a column showing object
allocations in that heap.
3. Measure impact of an optimization
One memory optimization improvement that is easy to measure is garbage collection. When an optimization reduces memory pressure, you should see fewer garbage collections (GCs). To measure this, measure the time between GCs in the profiler timeline. You should see longer durations between GCs after memory optimizations.
The ultimate impact of memory improvements such as these is:
- The app will be killed less often due to Out of Memory issues if the app does not constantly have memory pressure.
- Having fewer GCs improves jank metrics. This is because GCs cause CPU contention, which can lead to rendering tasks being deferred while GC is happening.
Recommended for you
- Note: link text is displayed when JavaScript is off
- Capture Macrobenchmark metrics
- App startup analysis and optimization {:#app-startup-analysis-optimization}