
Recording device activity over a short period of time is known as system tracing. System tracing produces a trace file that you can use to generate a system report. This report helps you identify how best to improve your app or game's performance.
For a comprehensive introduction to tracing and profiling, see the Tracing 101 page in the Perfetto documentation.
The Android platform provides several different options for capturing traces:
- Android Studio CPU and memory profiler
- Perfetto command-line tool (Android 10 and higher)
- System tracing utility
- Systrace command-line tool
The Android Studio CPU profiler inspects your app's CPU usage and thread
activity in real time while you interact with your app. You can also inspect the
details in recorded method traces, function traces, and system traces. The
memory profiler gives an overview of memory usage in relation to touch events,
Activity changes, and garbage collection
events.
Perfetto is the platform-wide tracing tool introduced in Android 10. It is a sophisticated open source tracing project for Android, Linux, and Chrome. It offers a superset of data sources compared to Systrace and lets you record arbitrarily long traces in a protocol buffer binary stream. You can open these traces in the Perfetto UI.
The System tracing utility is an Android tool that saves device activity to a trace file. On a device running Android 10 (API level 29) or higher, trace files are saved in Perfetto format, as shown later in this document. On a device running an earlier version of Android, trace files are saved in the Systrace format.
Systrace is a legacy platform-provided command-line tool that records device activity over a short period of time in a compressed text file. The tool produces a report that combines data from the Android kernel, such as the CPU scheduler, disk activity, and app threads. Systrace works on all Android platform versions, but we recommend Perfetto for devices running Android 10 and higher.

Figure 1. A sample Perfetto trace view, which shows about 20 seconds of interaction with an app.
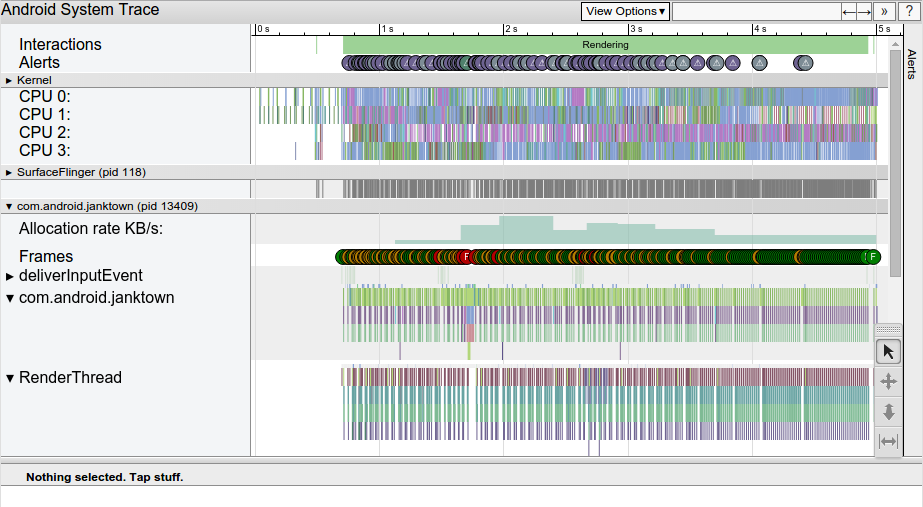
Figure 2. A sample Systrace HTML report, which shows five seconds of interaction with an app.
Both reports provide an overall picture of an Android-powered device's system processes for a given period of time. The report also inspects the captured tracing information to highlight problems that it observes, such as UI jank or high power consumption.
Perfetto and Systrace are interoperable:
- Open both Perfetto files and Systrace files in the Perfetto UI. Open Systrace files with the legacy Systrace viewer in the Perfetto UI by clicking the Open with legacy UI link.
- Convert a Perfetto trace to the legacy Systrace text
format using the
traceconvtool.
System tracing guides
To learn more about system tracing tools, see the following guides:
- Inspect CPU activity with CPU Profiler
- Shows how to profile your app's CPU usage and thread activity in Android Studio.
- Capture a system trace on a device
- Explains how to capture a system trace directly on any device running Android 9 (API level 28) or higher.
- Capture a system trace on the command line
- Defines the different options and flags that you can pass into the command-line interface for Systrace.
- Run Perfetto using adb
- Describes how to run the
perfettocommand-line tool to capture traces. - Quickstart: Record traces on Android
- External documentation that describes how to build and run the
perfettocommand-line tool to capture traces. - Quickstart: Record traces on Android
- The Perfetto web-based trace viewer opens Perfetto traces and displays a complete report. You can also open Systrace traces in this viewer using the legacy UI option.
- Navigate a Systrace report
- Lists the elements of a typical report, presents keyboard shortcuts for navigating through the report, and describes how to identify types of performance problems.
- Define custom events
- Describes how you can apply custom labels to specific sections of your code, allowing for easier root-cause analysis in Systrace or Perfetto.
- Use AI-powered analysis features
- Explains how to use AI-assisted features with your preferred AI agent to explore Perfetto traces and build custom SQL queries.