
This document helps you identify and fix key performance issues in your app.
Key performance issues
There are many problems that can contribute to bad performance in an app, but the following are some common issues to look for:
- Startup latency
Startup latency is the amount of time it takes between tapping on the app icon, notification, or other entry point, and the user's data showing on the screen.
Aim for the following startup goals in your apps:
- Cold start in less than 500ms. A cold start happens when the app being launched isn't present in the system's memory. This happens when it is the app's first launch since reboot or since the app process was stopped by either the user or the system. A cold start requires the most work from the system, as it has to load everything from storage and initialize the app. Try to make cold starts take 500ms or less.
- Warm start in less than 200ms and hot start in less than 150ms. A warm start occurs when the application's process is already running in the background, but the system needs to re-initialize the UI or bring the activity back to the foreground, such as when a user exits the app and re-opens it shortly after. A hot start is even faster because the app's activity is already cached in memory and only needs to be brought to the foreground, without the need to re-create the view hierarchy. Aim to keep warm starts under 200ms and hot starts under 150ms.
- P95 and P99 latencies very close to the median latency. P95 and P99 represent the 95th and 99th percentiles of startup times, while the median is the 50th percentile. When the app takes a long time to start, it makes a poor user experience. Interprocess communications (IPCs) and unnecessary I/O during the critical path of app startup can experience lock contention and introduce inconsistencies.
- Scroll jank
Jank is the term that describes the visual hiccup that occurs when the system isn't able to build and provide frames in time to draw them to the screen at the requested cadence of 60hz or higher. Jank is most apparent when scrolling, when instead of smoothly animated flow, there are hiccups. Jank appears when the movement pauses along the way for one or more frames, as the app takes longer to render content than the duration of a frame on the system.
Target 90Hz refresh rates in your apps. Conventional rendering rates are 60Hz, but many newer devices operate in 90Hz mode during user interactions, such as scrolling. Some devices support even higher rates of up to 120Hz.
To see what refresh rate a device is using at a given time, enable an overlay using Developer Options > Show refresh rate in the Debugging section.
- Transitions that aren't smooth
This is apparent during interactions such as switching between tabs or loading a new activity. These types of transitions must be smooth animations and not include delays or visual flicker.
- Power inefficiencies
Doing work reduces battery charge and, ultimately, battery life.
Memory allocations, which come from creating new objects in code, cause work in the system. Not only do the allocations themselves require effort from the Android Runtime (ART), but freeing these objects later (garbage collection) also requires time and effort.
Both memory allocation and garbage collection have become much faster and more efficient, especially for temporary objects. Although it used to be best practice to avoid allocating objects whenever possible, we recommend you do what makes the most sense for your app and architecture. Saving on allocations at the risk of unmaintainable code isn't the best practice, given what ART is capable of.
However, allocations do require effort, so keep in mind that they can contribute to performance problems if you are allocating many objects in your inner loop.
Identify issues
To remedy performance issues, identify and inspect the following critical user journeys:
- Common startup flows, including from launcher and notification.
- Screens where the user scrolls through data.
- Transitions between screens.
- Long-running flows, like navigation or music playback.
For each of these flows, inspect what is happening using the following debugging tools:
- Perfetto: lets you see what is happening across the entire device with precise timing data.
- Memory Profiler: lets you see what memory allocations are happening on the heap.
- Simpleperf: shows a flamegraph of what function calls are using the most CPU during a certain period of time. When you identify something that's taking a long time in Systrace, but you don't know why, Simpleperf can provide additional information.
To understand and debug these performance issues, it's critical to manually debug individual test runs. You can't replace the preceding steps by analyzing aggregated data. However, to understand what users are actually seeing and identify when regressions might occur, it's important to set up metrics collection in automated testing and in the field:
- Startup flows
- Field metrics: Play Console startup time
- Lab tests: test startup with Macrobenchmark
- Jank
- Field metrics
- Play Console frame vitals: within the Play Console, you can't narrow down metrics to a specific user journey. It only reports overall jank throughout the app.
- Custom measurement with
FrameMetricsAggregator: you can useFrameMetricsAggregatorto record jank metrics during a particular workflow.
- Lab tests
- Scrolling with Macrobenchmark.
- Macrobenchmark collects frame timing using
dumpsys gfxinfocommands that bracket a single user journey. This is a way to understand variation in jank over a specific user journey. TheRenderTimemetrics, which highlight how long frames are taking to draw, are more important than the count of janky frames for identifying regressions or improvements.
- Field metrics
App Links verification issues
App Links are deep links based on your website URL that are verified to belong to your website. App Link verifications can fail for the following reasons:
- Incorrect intent filter scopes: only add
autoVerifyto intent filters for URLs that your app can respond to. - Unverified protocol switches: unverified server-side and subdomain
redirects are considered security risks and fail verification. They cause
all
autoVerifylinks to fail. For example, redirecting links from HTTP to HTTPS, such as example.com to www.example.com, without verifying the HTTPS links can cause fail verification. Make sure to verify App Links by adding intent filters. - Non-verifiable links: adding non-verifiable links for testing purposes can cause the system to not verify App Links for your app.
- Unreliable servers: make sure your servers can connect to your client apps.
Set up your app for performance analysis
It's essential to properly set up to get accurate, repeatable, actionable benchmarks from an app. Test on a system that is as close to production as possible, while suppressing sources of noise. The following sections show a number of APK- and system-specific steps you can take to prepare a test setup, some of which are use-case specific.
Tracepoints
Apps can instrument their code with custom trace events.
While traces are being captured, tracing does incur a small overhead of roughly 5μs per section, so don't put it around every method. Tracing larger chunks of work, >0.1ms, can give significant insights into bottlenecks.
APK considerations
Debug variants can be helpful for troubleshooting and symbolizing stack samples,
but they have severe impacts on performance. Devices running Android 10 (API
level 29) and higher can use profileable android:shell="true" in their
manifest to enable profiling in release builds.
Use your production-grade code shrinking configuration. Depending on the resources your app uses, this can have a substantial impact on performance. Some ProGuard configurations remove tracepoints, so consider removing those rules for the configuration you're running tests on.
Compilation
Compile your app on-device to a known state—generally speed for
simplicity, or speed-profile to more closely match production performance
(though this requires warming up the application and dumping profiles or
compiling the app's baseline profiles).
Both speed and speed-profile reduce the amount of code running interpreted
from dex, and consequently the amount of background just-in-time (JIT)
compilation which can cause significant interference. Only speed-profile
reduces the impact of runtime class loading from dex.
The following command compiles the application using the speed mode:
adb shell cmd package compile -m speed -f com.example.packagename
The speed compilation mode compiles the app's methods completely. The
speed-profile mode compiles the app's methods and classes according to a
profile of the utilized code paths that is collected during app usage. It can be
difficult to collect profiles consistently and correctly, so if you decide to
use them, confirm they are collecting what you expect. The profiles are located
in the following location:
/data/misc/profiles/ref/[package-name]/primary.prof
System considerations
For low-level and high-fidelity measurements, calibrate your devices. Run A/B comparisons across the same device and same OS version. There can be significant variations in performance, even across the same device type.
On rooted devices, consider using a lockClocks script for
Microbenchmarks. Among other things, these scripts do the following:
- Place CPUs at a fixed frequency.
- Disable small cores and configure the GPU.
- Disable thermal throttling.
We don't recommend using a lockClocks script for user-experience focused tests
such as app launch, DoU testing, and jank testing, but it can be essential for
reducing noise in Microbenchmark tests.
When possible, consider using a testing framework like Macrobenchmark, which can reduce noise in your measurements and prevent measurement inaccuracy.
Slow app startup: unnecessary trampoline activity
A trampoline activity can extend app startup time unnecessarily, and it's
important to be aware if your app is doing it. As shown in the following example
trace, one activityStart is immediately followed by another activityStart
without any frames being drawn by the first activity.
 Figure 1. A trace showing trampoline activity.
This can happen both in a notification entrypoint and a regular app startup entrypoint, and you can often address it by refactoring. For example, if you're using this activity to perform setup before another activity runs, factor this code out into a reusable component or library.
Unnecessary allocations triggering frequent GCs
You might see garbage collections (GCs) happening more frequently than you expect in a Systrace.
In the following example, garbage collection every 10 seconds during a long-running operation is an indicator that the app might be allocating unnecessarily but consistently over time:
 Figure 2. A trace showing space between GC events.
You might also notice in Memory Profiler that a specific call stack is making the vast majority of the allocations. You don't need to eliminate all allocations aggressively, as this can make code harder to maintain. Instead, start by working on hotspots of allocations.
Janky frames
The graphics pipeline is relatively complicated, and there can be some nuance in determining whether a user ultimately might see a dropped frame. In some cases, the platform can "rescue" a frame using buffering. However, you can ignore most of that nuance to identify problematic frames from your app's perspective.
When frames are being drawn with little work required from the app, the
Choreographer.doFrame() tracepoints occur on a 16.7ms cadence on a 60 FPS
device:
 Figure 3. A trace showing frequent fast frames.
If you zoom out and navigate through the trace, you sometimes see frames take a little longer to complete, but not more than their allotted 16.7ms time. These frames are OK:
 Figure 4. A trace showing frequent fast frames with periodic bursts of
work.
Figure 4. A trace showing frequent fast frames with periodic bursts of
work.
When you see a disruption to this regular cadence, it is a janky frame, as shown in figures 5 and 6:
 Figure 5. A trace showing a janky frame.
 Figure 6. A trace showing more janky frames.
In some cases, you need to zoom into a tracepoint for more information about
which UI components are being updated by Compose or, as in Figure 6, what
a LazyColumn is doing. When diagnosing these UI bottlenecks, standard system
tracing may not show which composables are the root cause. In these instances,
use Jetpack Compose composition tracing, which surfaces exact composable
functions directly within the trace, making it easier to pinpoint unexpected
recompositions. Figures 5 and 6 show the results of composition tracing.
For more information about optimizing Compose performance, see Jetpack Compose Performance. For more information about identifying janky frames and debugging their causes, see Slow rendering.
Common lazy layout mistakes
Invalidating the entire backing state of a lazy layout unnecessarily can lead to excessive recompositions, long frame rendering times, and jank. To minimize the number of list items that need to update, use item keys for your items and only mutate the specific state elements that change.
See Use lazy layout keys for ways to avoid costly full-list re-allocations, which cause content to update rather than replacing it entirely.
Improper implementation of nested scrolling lists can cause performance drops. Avoid nesting a scrolling lazy layout inside another scrolling container without explicit constraints. For more information, see Avoid nesting components scrollable in the same direction.
Not prefetching enough data, or not prefetching in a timely manner, can make reaching the bottom of a scrolling list jarring when a user needs to wait for more data from the server. Although this isn't technically jank, as no frame deadlines are being missed, you can significantly improve UX by modifying the timing and quantity of prefetching so that the user doesn't have to wait for data.
Debug your app
The following are methods for debugging your app's performance.
Debug app startup with Systrace
See App startup time for an overview of the app startup process, and see the following video for an overview of system tracing and using the Android Studio profiler.
You can disambiguate startup types in the following stages:
- Cold startup: starts by creating a new process with no saved state.
- Warm startup: either recreates the activity while reusing the process or recreates the process with the saved state.
- Hot startup: restarts the activity and starts at inflation.
We recommend capturing Systraces with the System Tracing app on the device. For Android 10 and higher, use Perfetto. For Android 9 and lower, use Systrace. We also recommend viewing trace files with the web-based Perfetto trace viewer. For more information, see Overview of system tracing.
Some things to look for include the following:
- Monitor contention: competition for monitor-protected resources can introduce significant delay in app startup.
Synchronous binder transactions: look for unnecessary transactions in your app's critical path. If a necessary transaction is expensive, consider working with the associated platform team to make improvements.
Concurrent GC: this is common and relatively low impact, but if you're experiencing it often, consider looking into it with the Android Studio memory profiler.
I/O: check for I/O performed during startup, and look for long stalls.
Significant activity on other threads: these can interfere with the UI thread, so watch out for background work during startup.
We recommend you call reportFullyDrawn when startup is completed from
the app's perspective for improved app startup metric reporting. See the Time
to full display section for more information about using reportFullyDrawn.
You can extract RFD-defined start times through the Perfetto trace processor,
and a user-visible trace event is emitted.
Use System Tracing on the device
You can use the system-level app called System Tracing to capture a system
trace on a device. This app lets you record traces from the device without
having to plug it in or connect it to adb.
Use Android Studio Memory Profiler
You can use the Android Studio Memory Profiler to inspect memory pressure that might be caused by memory leaks or bad usage patterns. It provides a live view of object allocations.
You can fix memory problems in your app by using the Memory Profiler to track why and how often GCs happen.
To profile app memory, perform the following steps:
Detect memory problems.
Record a memory profiling session of the user journey you want to focus on. Look for an increasing object count, as shown in figure 7, which eventually leads to GCs, as shown in figure 8.
 Figure 7. Increasing object count.
 Figure 8. Garbage collections.
After you identify the user journey that is adding memory pressure, analyze the root causes of the memory pressure.
Diagnose memory pressure hot spots.
Select a range in the timeline to visualize both Allocations and Shallow Size, as shown in figure 9.
 Figure 9. Values for Allocations and Shallow
Size.
Figure 9. Values for Allocations and Shallow
Size.There are multiple ways to sort this data. The following are some examples of how each view can help you analyze problems.
Arrange by class: useful when you want to find classes that are generating objects that otherwise are cached or reused from a memory pool.
For example, if an app is creating 2,000 objects of a particular class every second, it increases the Allocations count by 2,000 every second and you see it when sorting by class. If you want to reuse these objects to avoid generating garbage, implement a memory pool.
Arrange by callstack: useful when you want to find where there is a hot path in which memory is being allocated, such as inside a loop or inside a specific function doing a lot of allocation work.
Shallow Size: only tracks the memory of the object itself. It's useful for tracking simple classes composed mostly of primitive values.
Retained Size: shows the total memory due to the object itself plus any references that are solely referenced by the object. It's useful for tracking memory pressure due to complex objects. To get this value, take a full memory dump, as shown in figure 10. Retained Size is added as a column, as shown in figure 11.
 Figure 10. Full memory dump.
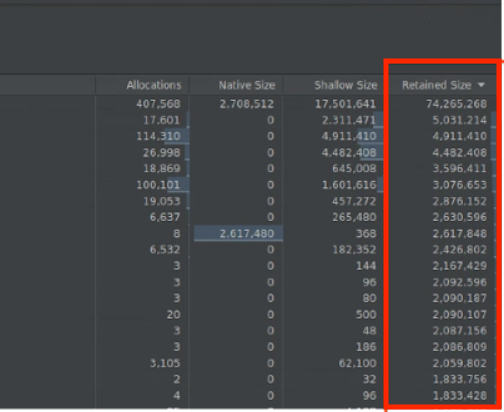
Figure 11. Retained Size column.
Measure impact of an optimization.
GCs are more evident and easier to measure the impact of in memory optimizations. When an optimization reduces memory pressure, you see fewer GCs.
To measure the impact of optimization, in the profiler timeline, measure the time between GCs. Positive impact results in longer time between GCs.
The ultimate impacts of memory improvements are the following:
- Out-of-memory shutdowns are likely reduced if the app doesn't constantly hit memory pressure.
- Having fewer GCs improves jank metrics, especially in the P99. This is because GCs cause CPU contention, which can lead to rendering tasks being deferred while GC is happening.
Recommended for you
- Note: link text is displayed when JavaScript is off
- App startup analysis and optimization {:#app-startup-analysis-optimization}
- Frozen frames
- Write a Macrobenchmark