
This guide explains how to navigate around and interpret a Systrace report. To interpret a Perfetto report, see the Trace Processor documentation.
Elements of a typical report
Systrace generates an output HTML file that contains a series of sections. The report lists the threads of each process. If a given thread renders UI frames, the report also indicates the rendered frames along the timeline. Time passes in the forward direction as you move left to right across the report.
From top to bottom, the report contains the following sections.
User interactions
The first section contains bars that represent specific user interactions within your app or game, such as tapping on the device's screen. These interactions serve as useful time markers.
CPU activity
The next section shows bars that represent thread activity within each CPU. The bars show CPU activity across all apps, including your app or game.
The CPU activity section is expandable, allowing you to view clock frequency for each CPU. Figure 1 shows an example of a collapsed CPU activity section, and Figure 2 shows an expanded version that displays clock frequency:


System events
The histograms in this section show specific system-level events, such as texture counts and the total size of specific objects.
A histogram worth checking more closely is the one labeled SurfaceView. The count represents the number of composed frame buffers that have been passed into the display pipeline and are waiting to be shown on the device's screen. Because most devices are double- or triple-buffered, this count is almost always 0, 1, or 2.
Other histograms depicting the Surface Flinger process, including VSync events and UI thread swap work, appear in Figure 3:

Display frames
This section, often the tallest in the report, depicts a multicolored line
followed by stacks of bars. These shapes represent the status and frame stack of
a particular thread that's been created. Each level of the stack represents a
call to beginSection(), or the beginning of a custom trace
event that you've defined for your app
or game.
The multicolored line above each stack of bars represents a particular thread's set of statuses over time. Each segment of the line can contain one of the following colors:
- Green: Running
- The thread is completing work related to a process or is responding to an interrupt.
- Blue: Runnable
- The thread is available to run but isn't currently scheduled.
- White: Sleeping
- The thread has no work to do, perhaps because the thread is blocked on a mutex lock.
- Orange: Uninterruptable sleep
- The thread is blocked on I/O or waiting for a disk operation to complete.
- Purple: Interruptable sleep
- The thread is blocked on another kernel operation, usually memory management.
Keyboard shortcuts
The following table lists the keyboard shortcuts that are available while viewing a Systrace report:
| Key | Description | |
|---|---|---|
| W | Zoom in to the trace timeline. | |
| A | Pan left on the trace timeline. | |
| S | Zoom out of the trace timeline. | |
| D | Pan right on the trace timeline. | |
| E | Center the trace timeline on the current mouse location. | |
| M | Frame the current selection. | |
| 1 | Change the currently-active selection model to the "select" mode. Corresponds to the 1st button that appears in the mouse selector toolbar (see image to the right). |
|
| 2 | Change the currently-active selection model to the "pan" mode. Corresponds to the 2nd button that appears in the mouse selector toolbar (see image to the right). |
|
| 3 | Change the currently-active selection model to the "zoom" mode. Corresponds to the 3rd button that appears in the mouse selector toolbar (see image to the right). |
|
| 4 | Change the currently-active selection model to the "timing" mode. Corresponds to the 4th button that appears in the mouse selector toolbar (see image to the right). |
|
| G | Show grid at the start of the currently-selected task. | |
| Shift + G | Show grid at the end of the currently-selected task. | |
| Left Arrow | Select the previous event on the currently-selected timeline. | |
| Right Arrow | Select the next event on the currently-selected timeline. | |
Investigate performance problems
When interacting with a Systrace report, you can inspect device CPU usage over the duration of the recording. For help navigating the HTML report, see the keyboard shortcuts section, or click the ? button in the top-right corner of the report.
The sections below explain how to inspect information in the report to find and fix performance problems.
Identify performance concerns
When navigating around a Systrace report, you can identify performance concerns more easily by doing one or more of the following:
- Select a time interval of interest by drawing a rectangle around the time interval.
- Mark or highlight a problem area using the ruler tool.
- Show each display refresh operation by clicking View Options > Highlight VSync.
Inspect UI frames and alerts
As shown in Figure 4, a Systrace report lists each process that renders UI frames and indicates each rendered frame along the timeline. Frames that render within the 16.6 milliseconds required to maintain a stable 60 frames per second are indicated with green frame circles. Frames that take longer than 16.6 milliseconds to render are indicated with yellow or red frame circles.
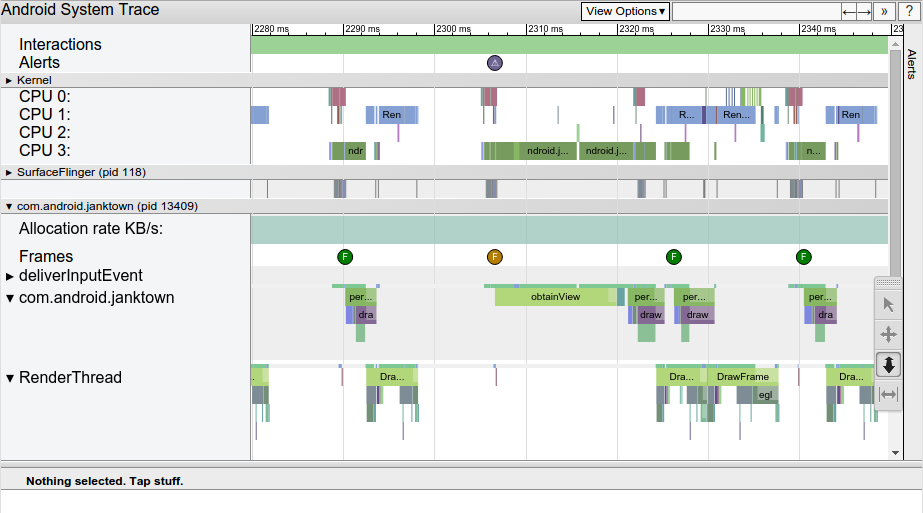
Clicking on a frame circle highlights it and provides additional information about the work done by the system to render that frame, including alerts. The report also shows you the methods that the system was executing while rendering that frame. You can investigate those methods to determine potential causes of UI jank.
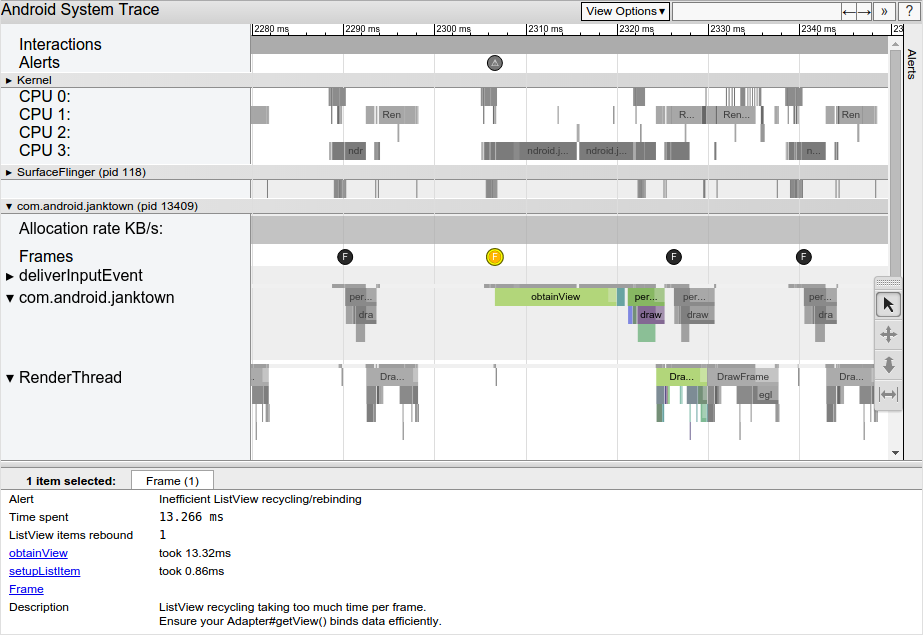
After you select a slow frame, you may see an alert in the bottom pane of the
report. The alert shown in Figure 5 calls out that the primary problem with the
frame is that too much time is spent inside
ListView recycling and rebinding. There
are links to the relevant events in the trace that explain more about what the
system is doing during this time.
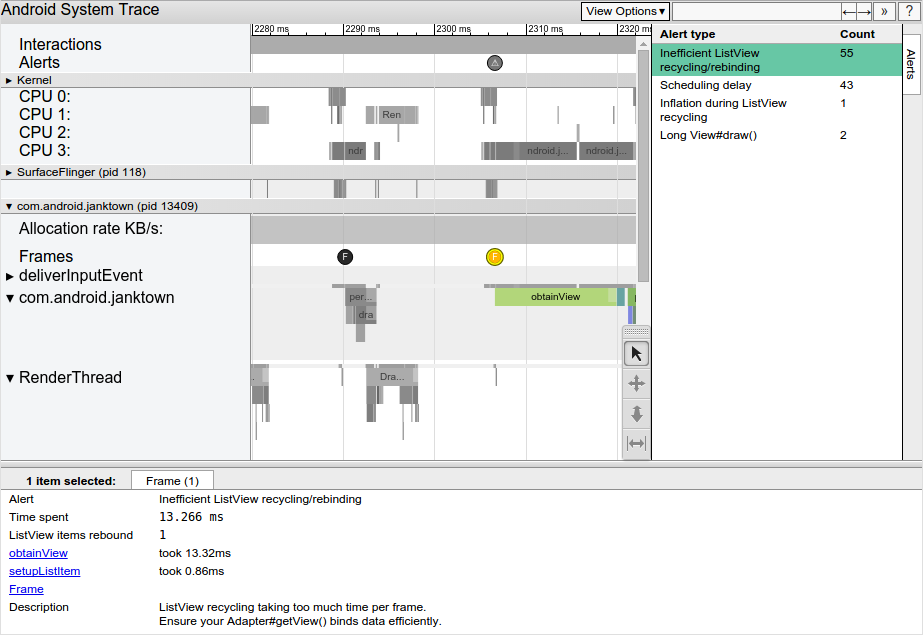
To see each alert that the tool discovered in your trace, as well as the number of times that the device triggered each alert, click the Alerts tab at the far right of the window, as shown in Figure 6. The Alerts panel helps you see which problems occur in the trace and how often they contribute to jank. You can think of this panel as a list of bugs to be fixed. Often, a small change or improvement in one area can remove an entire set of alerts.
If you see too much work being done on the UI thread, use one of the following approaches to help determine which methods are consuming too much CPU time:
- If you have an idea as to which methods could be causing bottlenecks, add trace markers to these methods. To learn more, see the guide on how to define custom events in your code.
- If you're unsure as to the source of UI bottlenecks, use the CPU Profiler that's available in Android Studio. You can generate trace logs, and then import and inspect them using the CPU Profiler.