
Devices running Android 9 (API level 28) or higher include a system-level app
called System Tracing. This app is similar to the
systrace command-line utility, but
the app lets you record traces directly from a test device itself, without
needing to plug in the device and connect to it over adb. You can then use the
app to share results from these traces with your development team.
Devices running Android 10 and higher record traces in Perfetto format, whereas earlier devices record them in Systrace format. We recommend using the Perfetto trace viewer to open both formats and then analyze traces.
It helps to record traces when addressing performance-related bugs in your app, such as slow startup, slow transitions, or UI jank.
Record a system trace
The System Tracing app lets you record a system trace using Quick Settings tile or a menu within the app itself. The following sections describe how to complete the recording process using these interfaces.
Record using Quick Settings tile
Quick Settings tile is usually the more convenient way to complete the on-device system tracing process.
Set up tile
If you're using System Tracing for the first time on your test device, or if you don't see the System Tracing tile in your device's Quick Settings panel, as shown in figure 2, complete the following setup steps:
- Enable developer options.
- Open the Developer Options settings screen.
- In the Debugging section, select System Tracing. The System Tracing app opens, showing the app menu.
From the app menu, enable Show Quick Settings tile, as shown in figure 1. The system adds the System Tracing tile to the Quick Settings panel, as shown in figure 2:
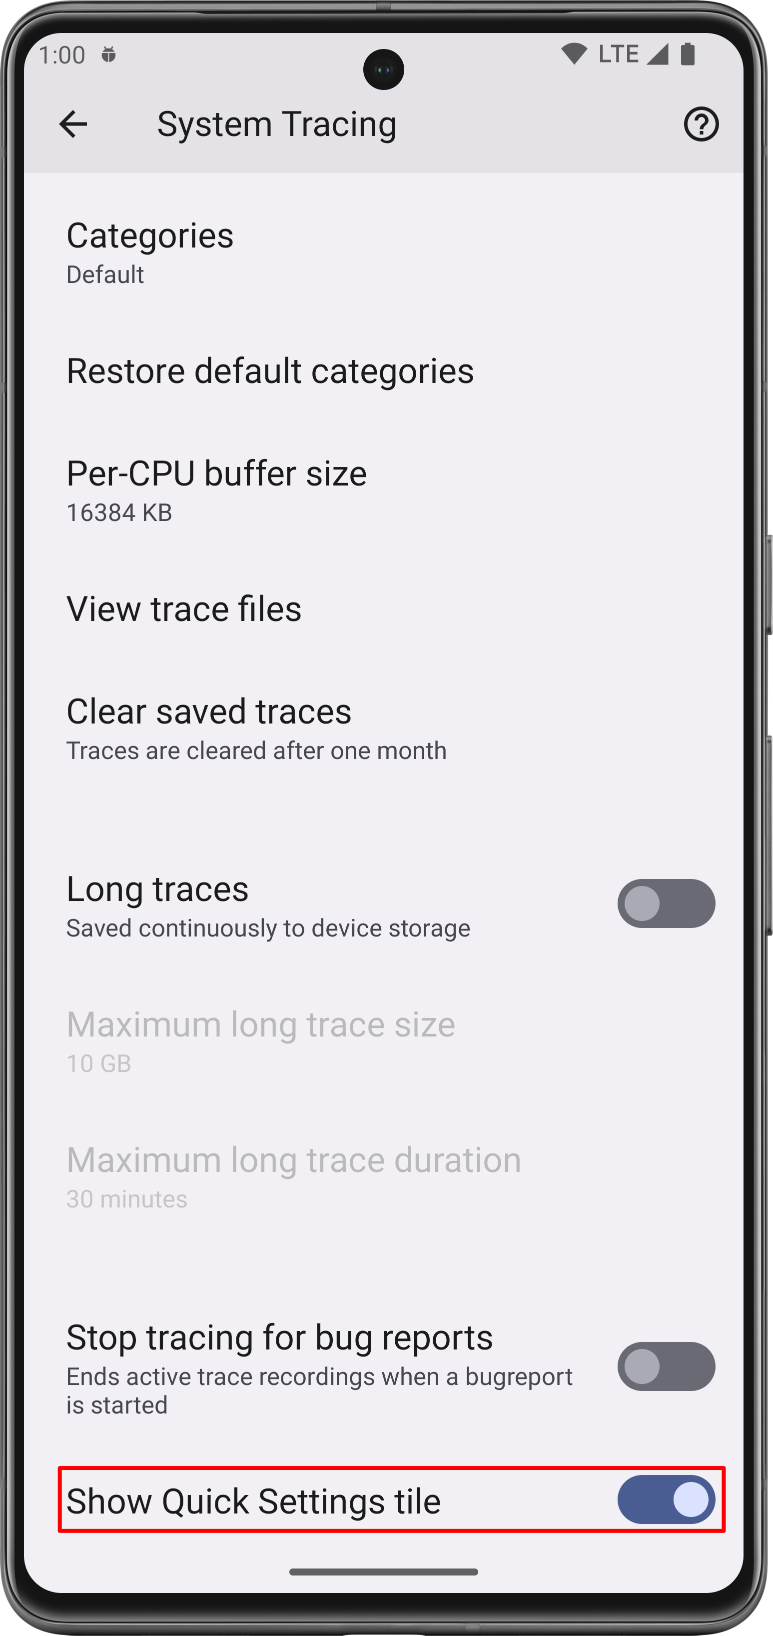
Figure 1. The Show Quick Settings tile switch in the System Tracing app. 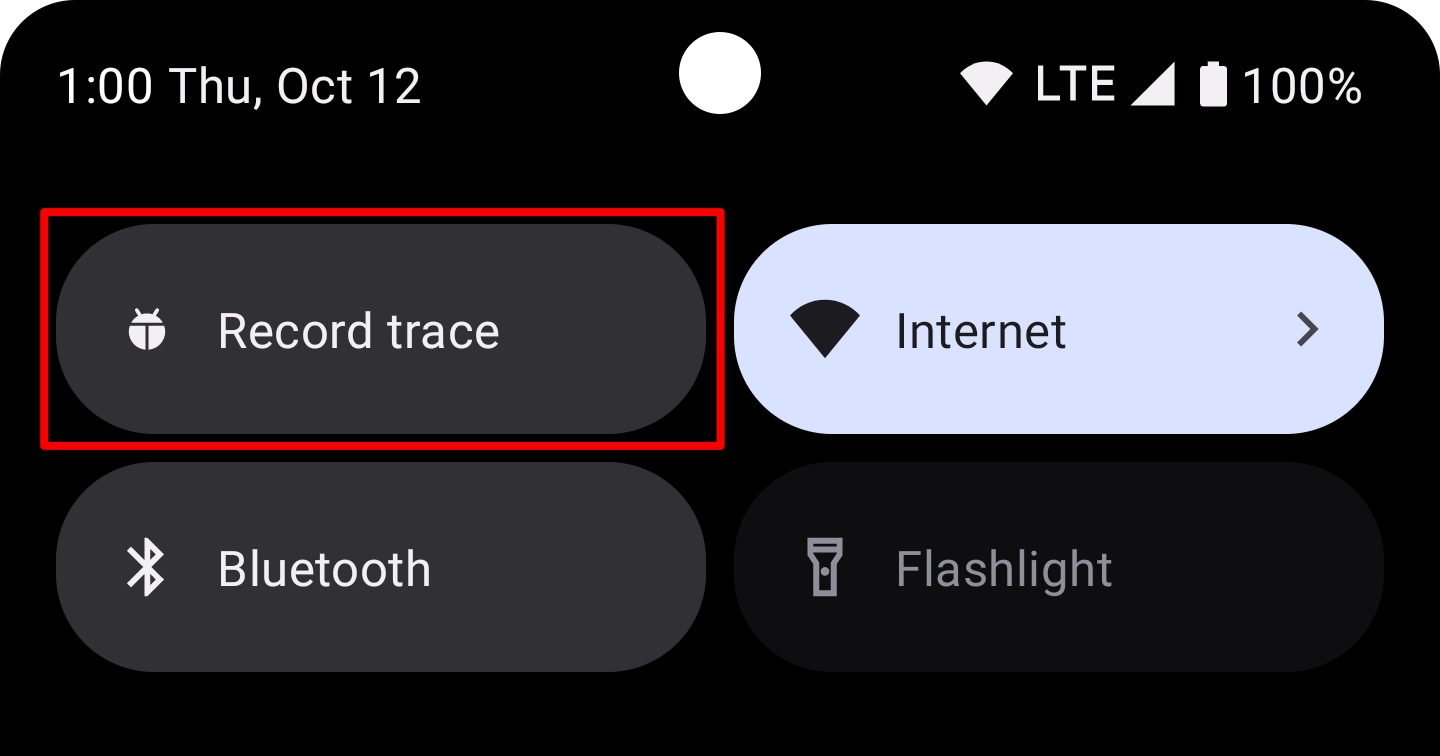
Figure 2. The System Tracing tile within the Quick Settings panel. Note: By default, the system adds the System Tracing tile as the first tile in the Quick Settings panel. If you want the tile to appear in a different position, use the panel's edit mode to move the tile.
Complete a system trace recording
To record a system trace using the Quick Settings panel, complete the following steps:
Tap the System Tracing tile, which has the label Record trace. The tile becomes enabled, and a persistent notification appears to notify you that the system is recording a trace, as shown in figure 3:
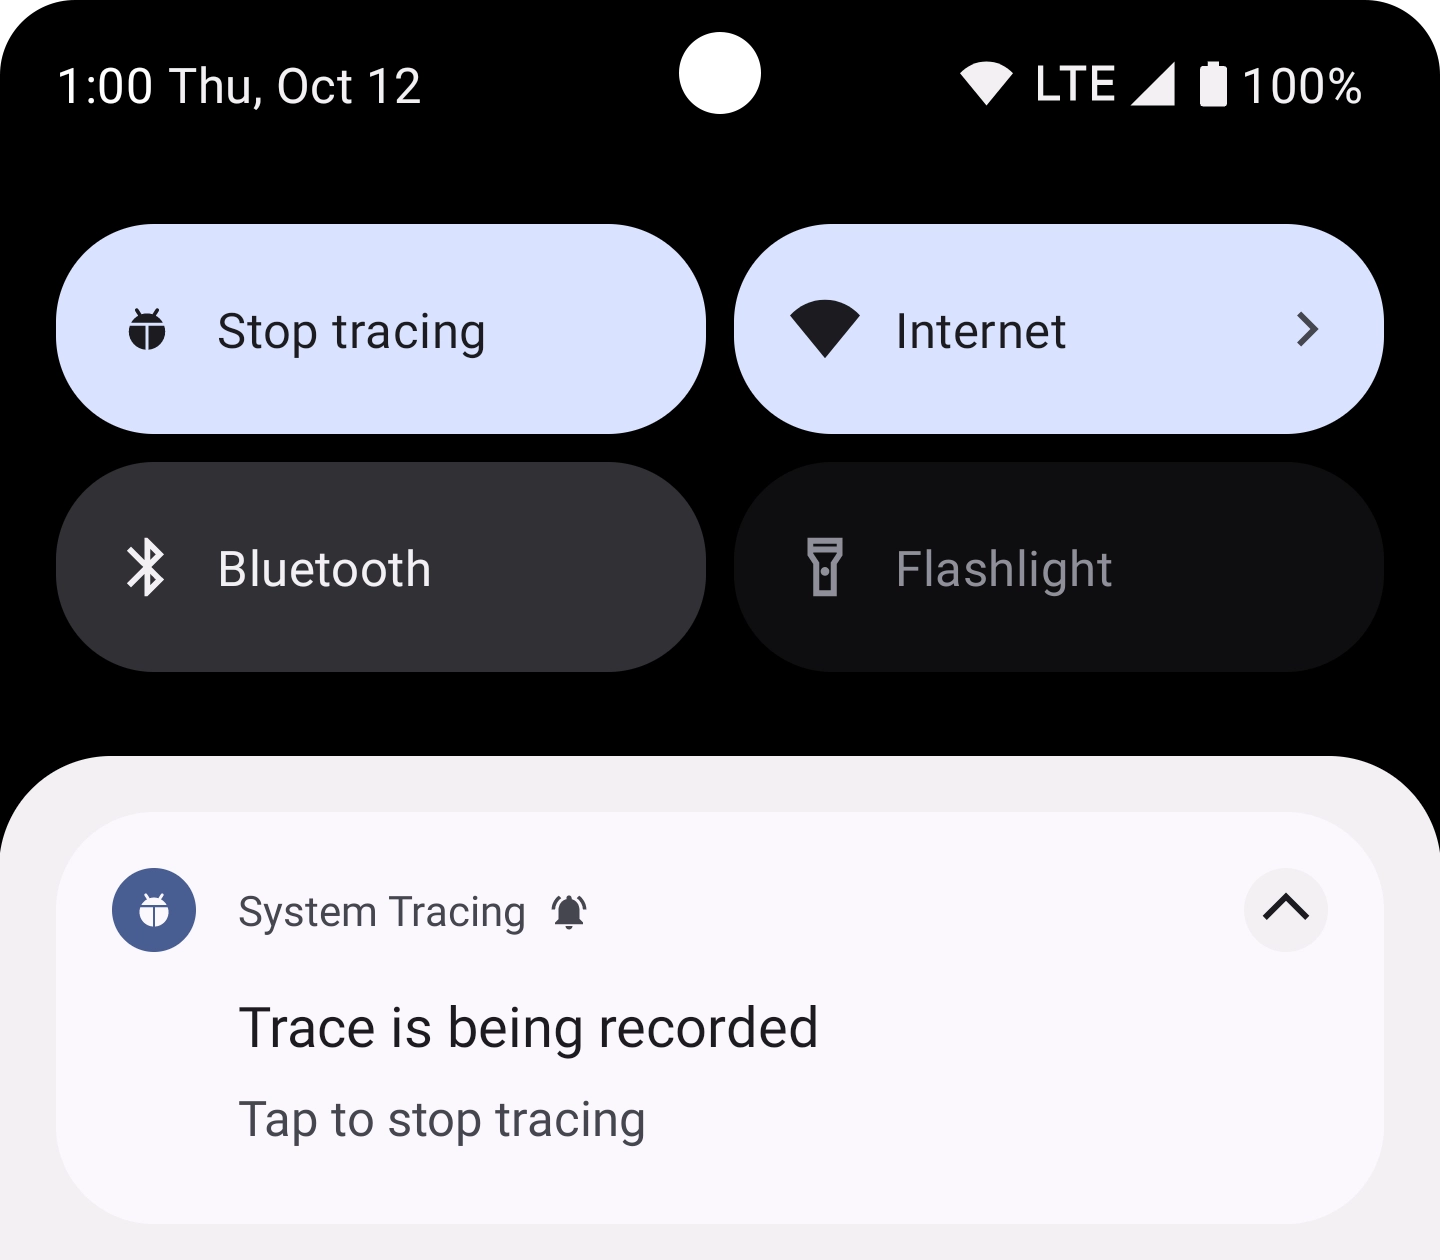
Figure 3. Persistent notification that appears after starting an on-device system trace. Perform the actions in your app that you want the system to inspect.
Stop tracing by tapping either the System Tracing tile in the Quick Settings panel or on the System Tracing notification.
The system displays a new notification that contains the message "Saving trace". When saving is complete, the system dismisses the notification and displays a third notification, confirming that your trace is saved and that you're ready to share the system trace, as shown in figure 4:
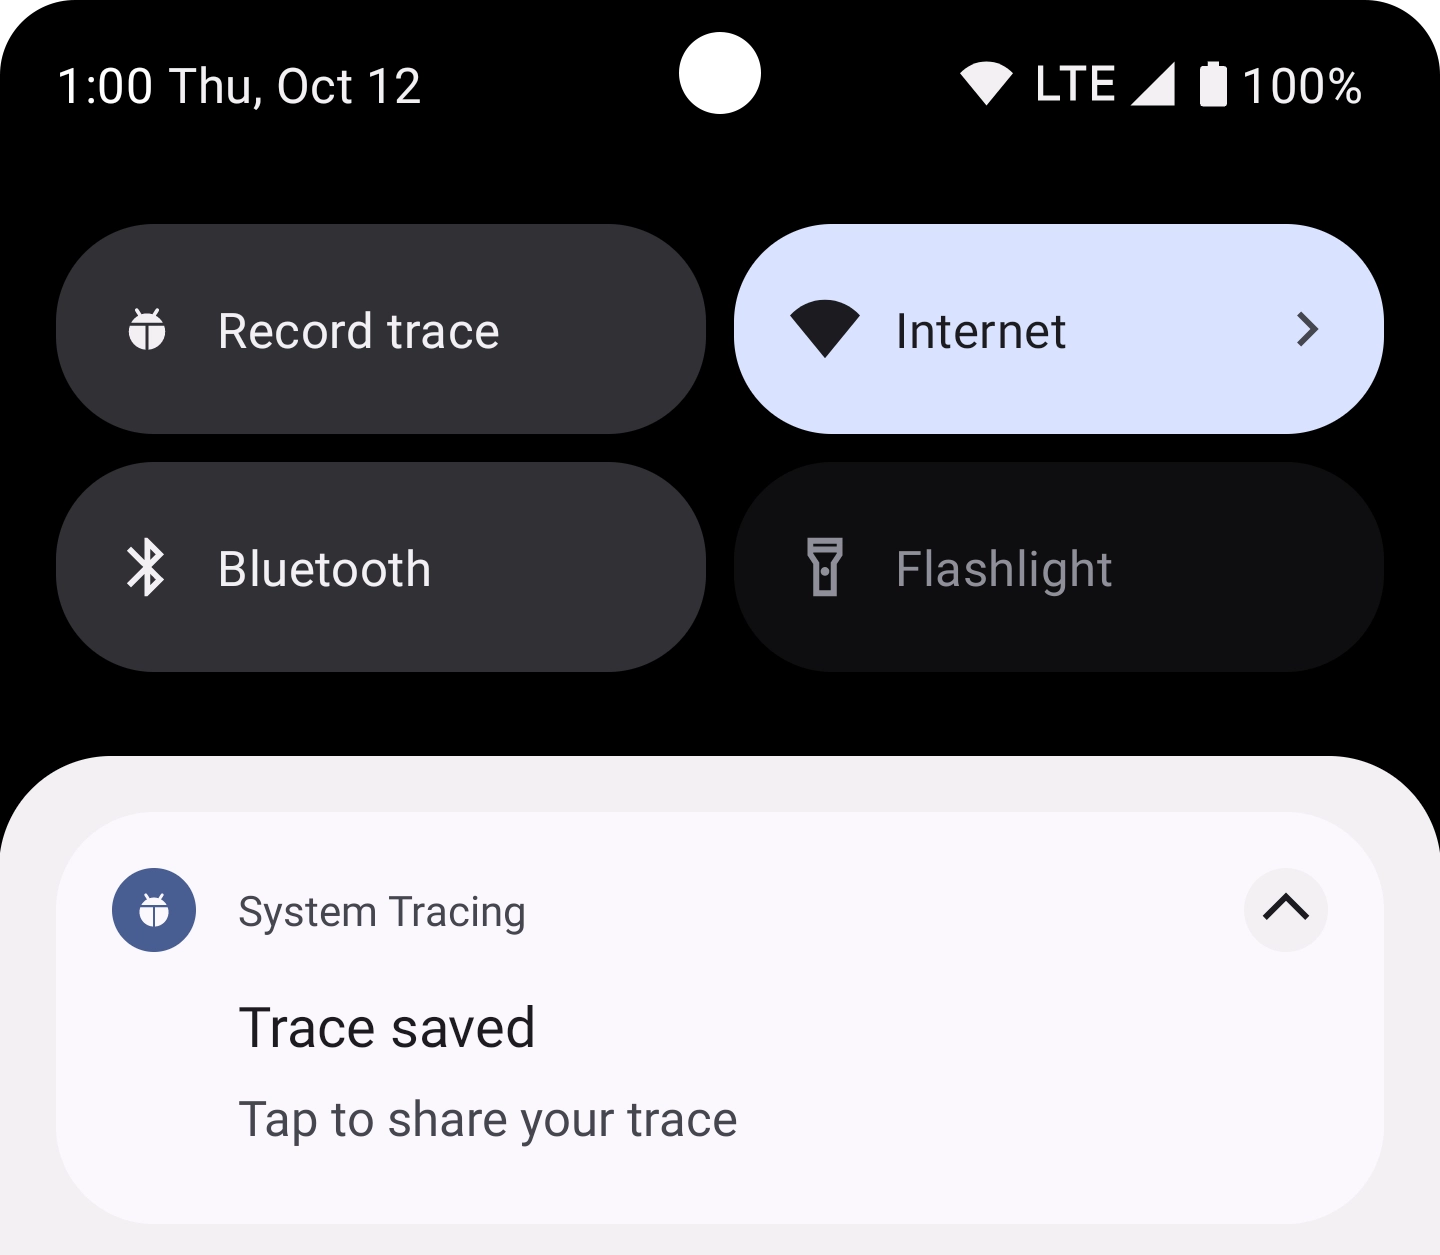
Figure 4. Persistent notification that appears after the system finishes saving a recorded trace.
Record using app menu
The app menu lets you configure several advanced settings related to system tracing and provides a switch for starting and stopping a system trace.
To record a system trace using the System Tracing app menu, complete the following steps:
- Enable developer options.
Open the Developer Options settings screen. In the Debugging section, select System Tracing. The System Tracing app opens.
Alternatively, if you set up the System Tracing tile, you can tap and hold the tile to enter the System Tracing app.
Make sure Trace debuggable applications is selected to include apps that have debugging enabled in the system trace.
Optionally, choose the Categories of system and sensor calls to trace, and choose a Per-CPU buffer size in KB. Choose categories that correspond to the use case that you're testing, such as the Audio category for testing Bluetooth operations or the Memory category for heap allocations.
Optionally, select Long traces to enable traces that are saved continuously to device storage. For this option, set limits for the Maximum long trace size and Maximum long trace duration.
Enable the Record trace switch, highlighted in figure 5. The tile becomes enabled, and a persistent notification appears to notify you that the system is recording a trace, as shown in figure 3.
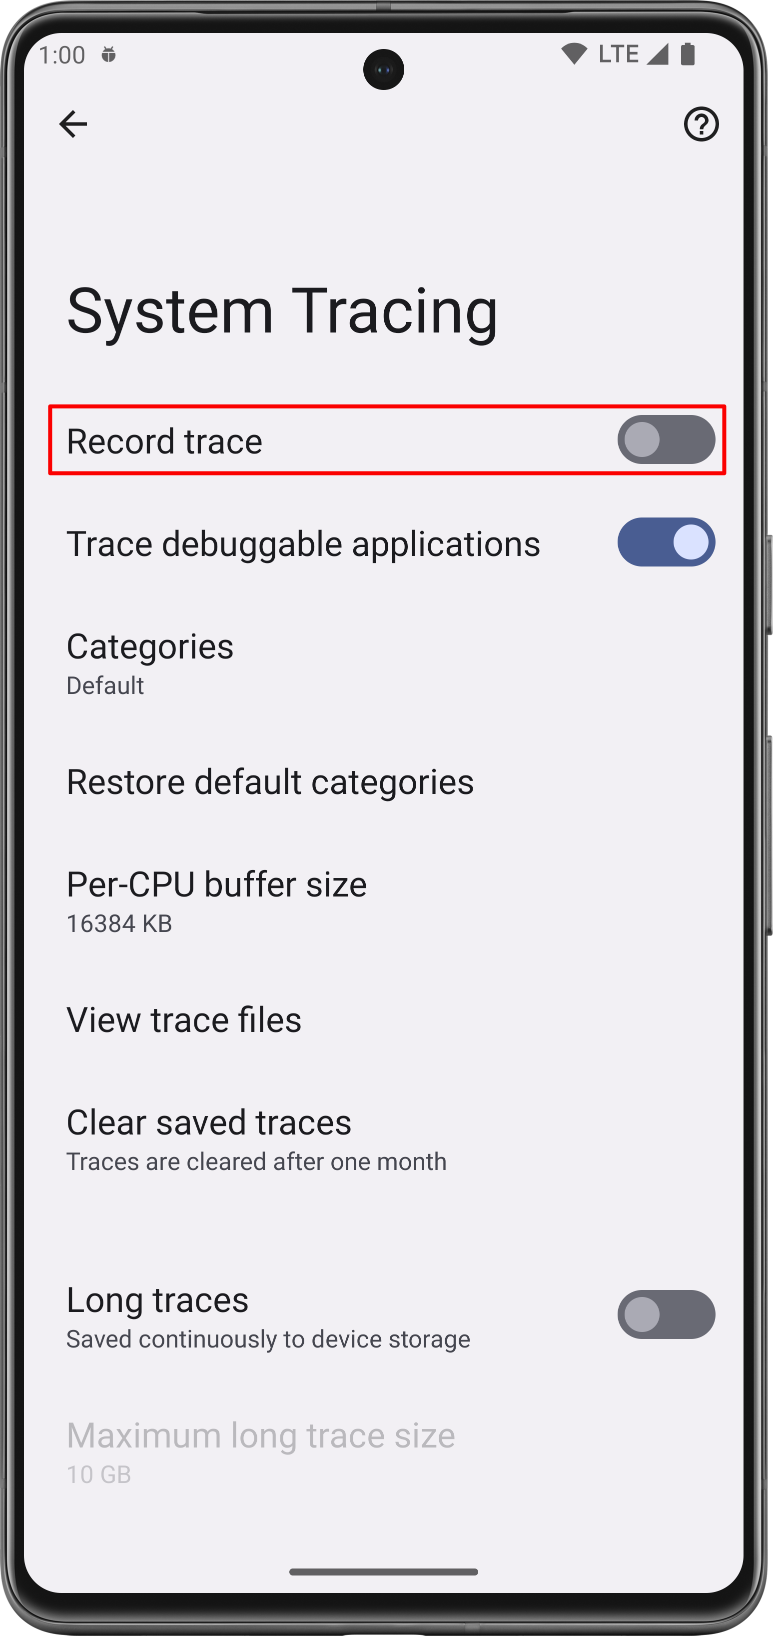
Figure 5. The Record trace switch in the System Tracing settings. Perform the actions in your app that you want the system to inspect.
Stop tracing by disabling the Record trace switch.
The system displays a new notification that contains the message "Saving trace". When saving is complete, the system dismisses the notification and displays a third notification, confirming that your trace is saved and that you're ready to share the system trace, as shown in figure 4.
Share a system trace
The System Tracing app helps you share system trace results as part of several
different workflows. On a device running Android 10 (API level 29) or higher, trace
files are saved with the .perfetto-trace filename extension and can be opened
in the Perfetto UI. On a device
running an earlier version of Android, trace files are saved with the .ctrace
filename extension, which denotes the Systrace format.
Share as a message
System Tracing lets you share your collected trace with other apps on your device. You can send the trace to your development team through an email or a bug-tracking app without needing to connect a device to your development machine.
After you record a system trace, tap on the notification that appears on the device, like the one shown in figure 4. The platform's intent picker appears, letting you share your trace using the messaging app of your choice.
Share from the Files app
On devices running Android 10 (API level 29) or higher, traces are shown in the Files app. You can share a trace from this app.
Download report using ADB
You can also extract a system trace from a device using adb. Connect the
device used to record the trace to your development machine, then run the
following commands in a terminal window:
cd /path-to-traces-on-my-dev-machine && \
  adb pull /data/local/traces/ .
Convert between trace formats
You can convert Perfetto trace files to the Systrace format. See Converting between trace formats for more information.
Create an HTML report
When sharing your trace, the report itself is in a .perfetto-trace file on
devices running Android 10
or higher, or a .ctrace file for all other versions.
Create an HTML report from the trace file using a web-based UI or from the command line.
Web-based UI
Use the Perfetto UI to open the trace file and generate the report.
For a Perfetto file, click Open trace file. For a Systrace file, click Open with legacy UI. The legacy UI has the same look and feel as the Systrace report.
Command line
Run the following commands in a terminal window to generate an HTML report from the trace file:
cd /path-to-traces-on-my-dev-machine && \
  systrace --from-file trace-file-name{.ctrace | .perfetto-trace}
If you don't already have the systrace command-line program, you can download
it from the
Catapult
project on GitHub, or directly from the Android Open Source
Project.
Recommended for you
- Note: link text is displayed when JavaScript is off
- Benchmark in Continuous Integration
- Capture a system trace on the command line