
The WebView DevTools app is an on-device utility for managing and debugging the system WebView component itself. It is separate from Chrome DevTools, which runs on your development machine and lets you remotely debug the live web content (HTML, CSS, and JavaScript) running within an instance of WebView.
WebView DevTools is a companion app that is automatically installed on your device along with the WebView system component. The app is divided into four areas:
- Home: View version information and switch the default WebView to a pre-release channel version.
- Crashes: List and upload WebView crash reports.
- Flags: Set developer flags to change the behavior of WebView.
- Net Logs: List and share WebView low-level networking logs.
Run WebView DevTools
On devices with Android 16 or higher that have Developer Mode enabled, you can launch WebView DevTools by navigating to Settings > System > Developer options > WebView DevTools.
On all recent Android releases, you can launch WebView DevTools using an adb command:
adb shell am start -a "com.android.webview.SHOW_DEV_UI"
Alternatively, if you install a pre-lease channel of WebView such as Beta, Dev, or Canary, you can use the WebView DevTools launcher icon.
The first time you run WebView DevTools, it will request notification permission in order to show a persistent notification listing the developer flags you enable.
Switch to a pre-release channel
The latest WebView features and bug fixes are made available in pre-release channels first. You can test your app against these changes by switching your device's WebView provider using WebView DevTools. Testing against pre-release channels helps make sure your app is compatible with upcoming WebView versions before they launch to users.
- Install the Beta, Dev, or Canary version of WebView, depending on your preferred trade-off between stability and access to the latest changes.
- Open the WebView DevTools app, and tap Change Provider.
- If you don't see that option, tap the three dots in the top-right corner and select Change WebView Provider.
For more information see Try out WebView Beta, Dev, or Canary.
WebView channels
WebView channels are based on the Chrome release channels. Each channel represents a different level of stability and freshness of the code. Here's a quick rundown of when to use each WebView channel:
Canary: Updated daily. This channel has the very latest changes, including new features and bug fixes as soon as they are merged into the Chromium codebase. Use this if you want to test how your web app runs in a WebView with a recently merged change, but be aware that this channel can be unstable or contain bugs.
Dev: Updated once or twice per week. This channel is more stable than Canary but still contains cutting-edge changes. It's best for developers who want to test new features but with less risk of unrelated bugs than Canary.
Beta: Updated about every week, with a major update every 4 weeks. This channel gives you a preview of the features in the next stable release of WebView about 4-6 weeks before the stable release. Use this to test your web app against the upcoming release of WebView to verify compatibility.
Stable: Updated every 4 weeks for major releases, with minor releases every 2-3 weeks for urgent bug fixes. This is WebView's production channel, rolled out to all users. It is the most stable channel, having been through testing in other channels. Use this if you want to experience your web app in a WebView the way most users do right now, perhaps to reproduce a bug that they reported.
Crash UI
If you experience WebView crashes while developing your app, you can list, upload, and file bug reports against them using WebView DevTools.
- After your app crashes, restart the app to make sure the crash report gets generated.
- Open the WebView DevTools app, and tap Crashes.
For more information, see the Crash UI documentation.
Flag UI
The WebView DevTools app lets you set several useful flags to change the behavior of all WebViews across your device. Most flags are only used for the development of WebView itself, but a few are useful to Android app developers.
highlight-all-webviews: Identify WebViews by adding a yellow tint on top of them.net-log: Enable low-level logging of WebView network activity.webview-log-js-console-messages: Make JavaScript console logs appear in Logcat.
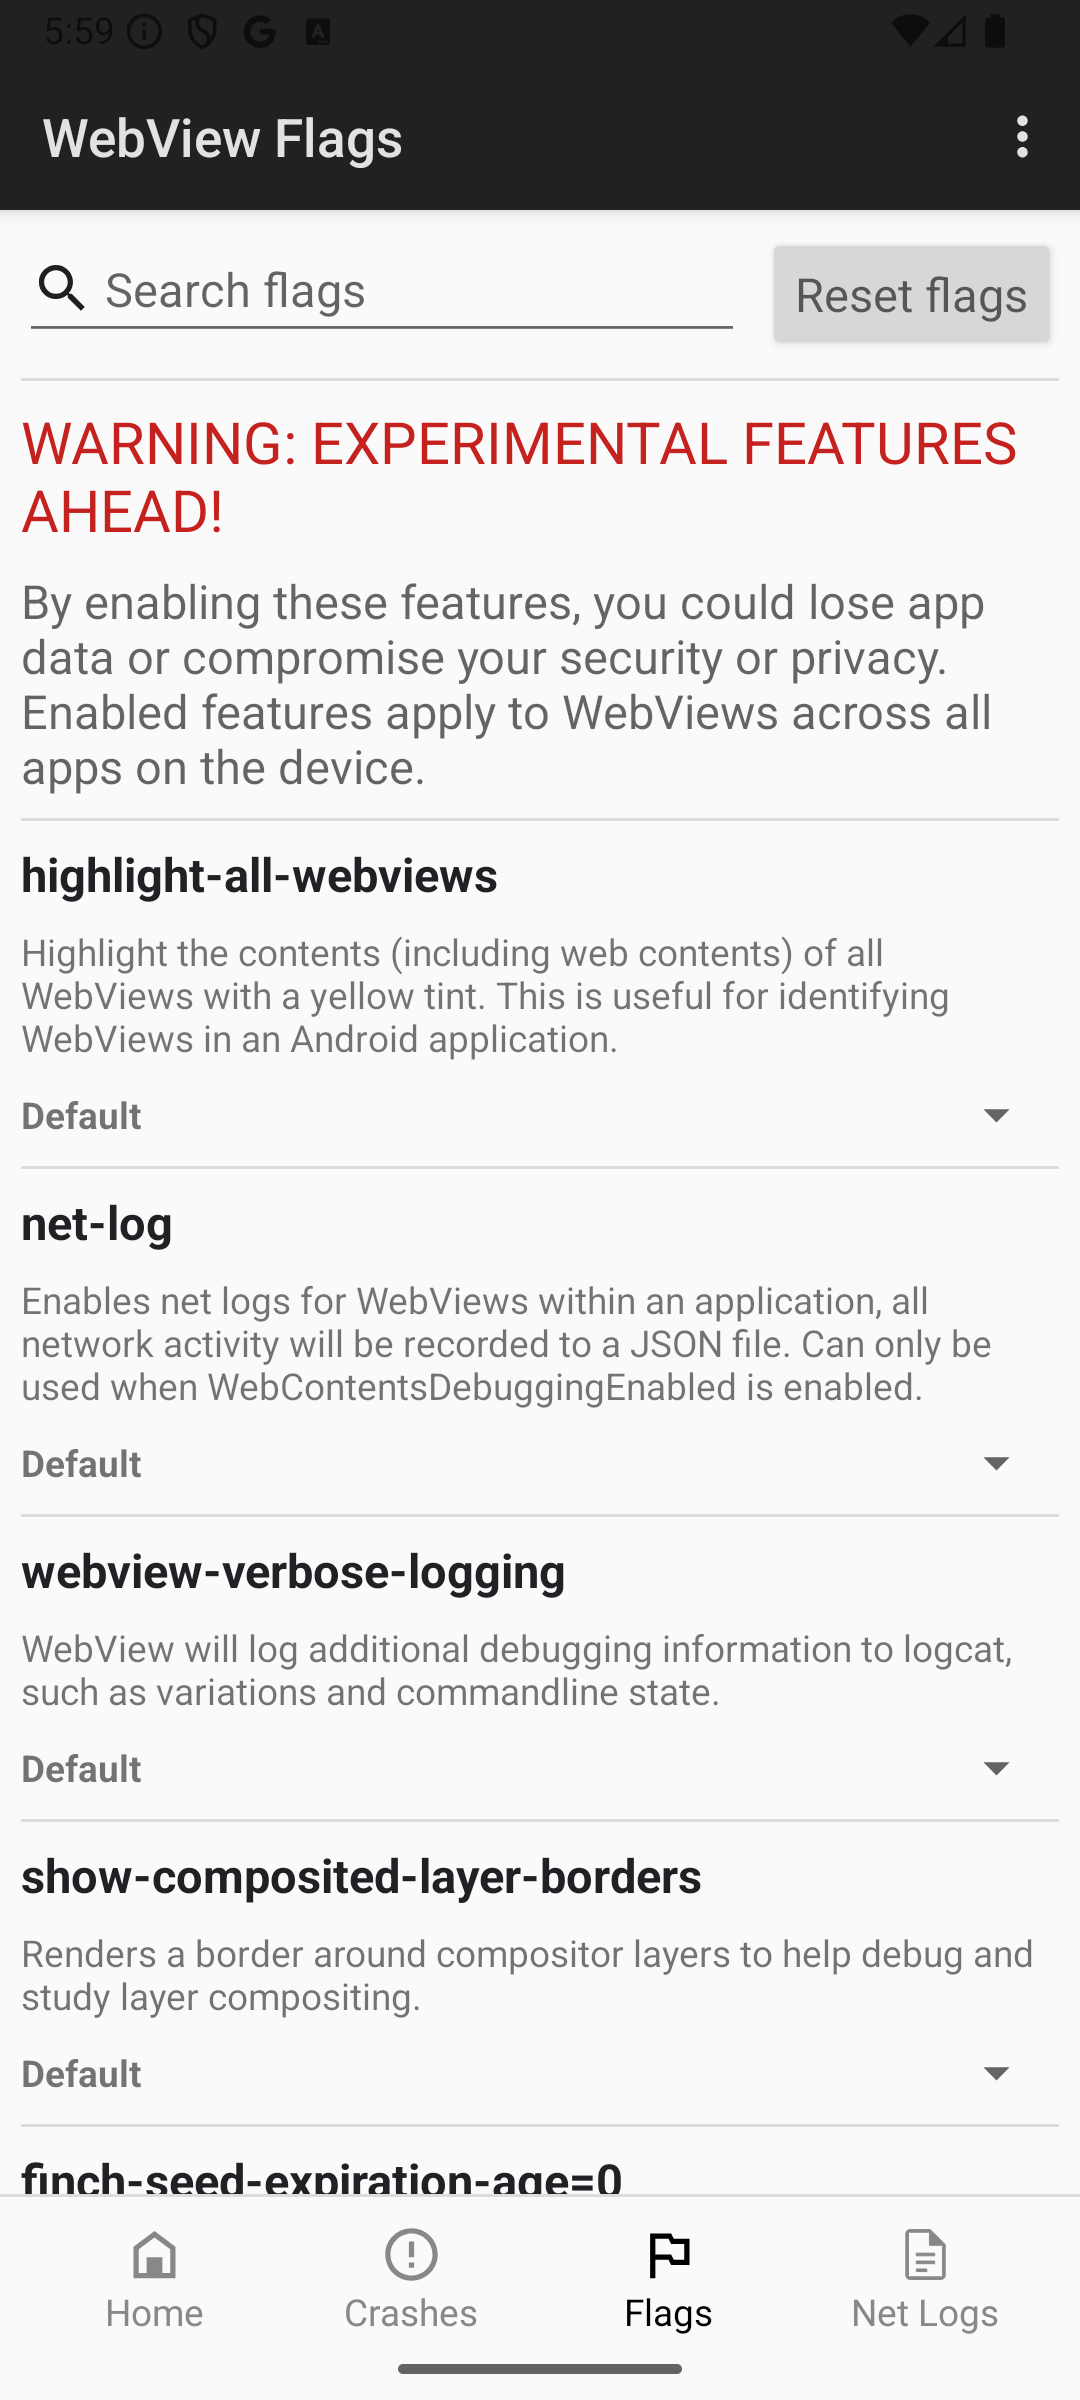
For more information, see the Flag UI documentation.
Net logs
If you're unable to resolve server connection issues in WebView using Chrome DevTools, use WebView DevTools to capture low-level network logs.
- Enable WebView debugging in your app code.
- In WebView DevTools, open Flags, find
net-log, and toggle it on. Restart your app for the flag to take effect. - Perform actions that trigger the network behavior you want to debug. After you have reproduced the issue, close your app.
- Open the Net Logs section of WebView DevTools to locate and share the net log file.
- You can load the JSON log file into the Netlog Viewer, an online tool for visualizing network logs, to inspect the low-level network events, socket information, and timing details.
For more information, see Net debugging in WebView.