
The androidx.tracing:tracing:2.0.2 library is a low-overhead Kotlin API
that lets you capture in-process trace events. These events can capture time
slices and their context. The library also supports context propagation for
Kotlin coroutines.
The library uses the same Perfetto trace packet format that Android
developers are familiar with. Also, Tracing 2.0 (unlike the 1.0.0-* APIs)
supports the notion of pluggable tracing backends and sinks, so other
tracing libraries can customize the output tracing format, and how context
propagation works in their implementation.
Dependencies
To start tracing, you need to define the dependencies in your
build.gradle.kts.
Kotlin Multiplatform projects
Libraries that only need to emit trace events should depend on the lightweight
androidx.tracing:tracing API. Apps that configure the tracing backend should
also depend on androidx.tracing:tracing-wire.
kotlin {
  sourceSets {
    commonMain {
      dependencies {
        // API definition
        implementation("androidx.tracing:tracing:2.0.2")
      }
    }
    androidMain {
      dependencies {
        // Android implementation (includes the Perfetto Sink and automatic initialization)
        implementation("androidx.tracing:tracing-wire:2.0.2")
      }
    }
    jvmMain {
      dependencies {
        // JVM implementation
        implementation("androidx.tracing:tracing-wire:2.0.2")
      }
    }
  }
}
Android-only projects
If you're targeting Android only, add the following to your application or
library's build.gradle.kts file:
dependencies {
    // For libraries and applications to emit events
    implementation("androidx.tracing:tracing:2.0.2")

    // For applications to configure the tracing backend
    implementation("androidx.tracing:tracing-wire:2.0.2")
}
Initialization and discovery
Before you can record trace events, you must initialize the tracing
infrastructure. This involves creating an AbstractTraceDriver and registering
its Tracer globally.
Android
On Android, if you include the androidx.tracing:tracing-wire dependency,
initialization happens automatically on application startup using the
androidx.startup library.
By default, this automatic initialization does the following:
Creates a
TraceDriverwith aTraceSinkthat writes Perfetto trace files toContext.noBackupFilesDir/perfetto_traces/.Registers the resulting
Tracerglobally.
Customize the TraceDriver instance
If you need to customize the configuration, for example to change where trace
files are saved or to use a custom TraceSink, you can provide your own
AbstractTraceDriver instance.
To customize the configuration, make your Application class implement
AbstractTraceDriver.Factory:
import android.app.Application
import androidx.tracing.AbstractTraceDriver
import androidx.tracing.wire.TraceDriver
import androidx.tracing.wire.TraceSink
import java.io.File

class App : Application(), AbstractTraceDriver.Factory {
    override fun create(): AbstractTraceDriver {
        val sink = TraceSink(
            context = this,
            fileProvider = { File(noBackupFilesDir, "traces") },
        )
        // Return the custom TraceDriver
        // You can also fully customize the instance of Tracer
        return TraceDriver(context = this, sink = sink)
    }
}
The automatic initializer detects that your Application subclass implements
Factory and uses your custom driver factory.
JVM
On the JVM, there's no automatic bootstrapping mechanism. The application is
responsible for initializing the TraceDriver and registering the Tracer
globally during startup, most commonly in your main function.
To register the tracer, call Tracer.setGlobalTracer().
import androidx.tracing.Tracer
import androidx.tracing.DelicateTracingApi
import androidx.tracing.wire.TraceDriver
import androidx.tracing.wire.TraceSink
import java.io.File

fun main() {
    // Create the TraceSink, and the `TraceDriver`
    val outputDirectory = File("/tmp/perfetto")
    val sink = TraceSink(directory = outputDirectory)
    val driver = TraceDriver(sink = sink, isEnabled = true)

    // Register the tracer
    @OptIn(DelicateTracingApi::class)
    Tracer.setGlobalTracer(driver.tracer)

    // Call driver.close() as a result of the process shutdown hook.
    Runtime.getRuntime().addShutdownHook(Thread {
        driver.close()
    })
}
Basic usage
A TraceSink defines how trace packets are serialized. Tracing 2.0.0 comes with
an implementation of a Sink that uses the Perfetto trace packet format. A
TraceDriver provides a handle to the Tracer and can be used to finalize a
trace.
Once the Tracer is initialized, either automatically on Android or manually on
the JVM, use the global Tracer.global instance to emit trace events.
You can also use the TraceDriver to disable all trace points in the
application, if you choose not to trace at all in some application variants. You
can optionally enable trace points for a given category by providing an
implementation for isCategoryEnabled when creating an instance of
TraceDriver.
val driver = TraceDriver(
    sink = sink,
    isCategoryEnabled = { category ->
        // Only enable trace points in the "com.example" package
        category.startsWith("com.example")
    }
)
Here's a basic example of emitting a trace event using Tracer.global on the
JVM, including manual setup:
import androidx.tracing.Tracer
import androidx.tracing.DelicateTracingApi
import androidx.tracing.wire.TraceDriver
import androidx.tracing.wire.TraceSink
import java.io.File

// Category names should also follow the same convention used for package names
// on Android and Java. This makes them easier to identify and filter.
internal const val CATEGORY_MAIN = "com.example"

fun createSink(): TraceSink {
    val outputDirectory = File("/tmp/perfetto")
    if (!outputDirectory.exists()) {
        outputDirectory.mkdirs()
    }
    return TraceSink(directory = outputDirectory)
}

fun createTraceDriver(): TraceDriver {
    return TraceDriver(sink = createSink(), isCategoryEnabled = {true})
}

fun main() {
    val driver = createTraceDriver()
    @OptIn(DelicateTracingApi::class)
    Tracer.setGlobalTracer(driver.tracer)

    driver.use {
        Tracer.global.trace(category = CATEGORY_MAIN, name = "basic") {
            // The block of code that needs to be traced.
            Thread.sleep(100L)
        }
    }
}
This generates the following trace.
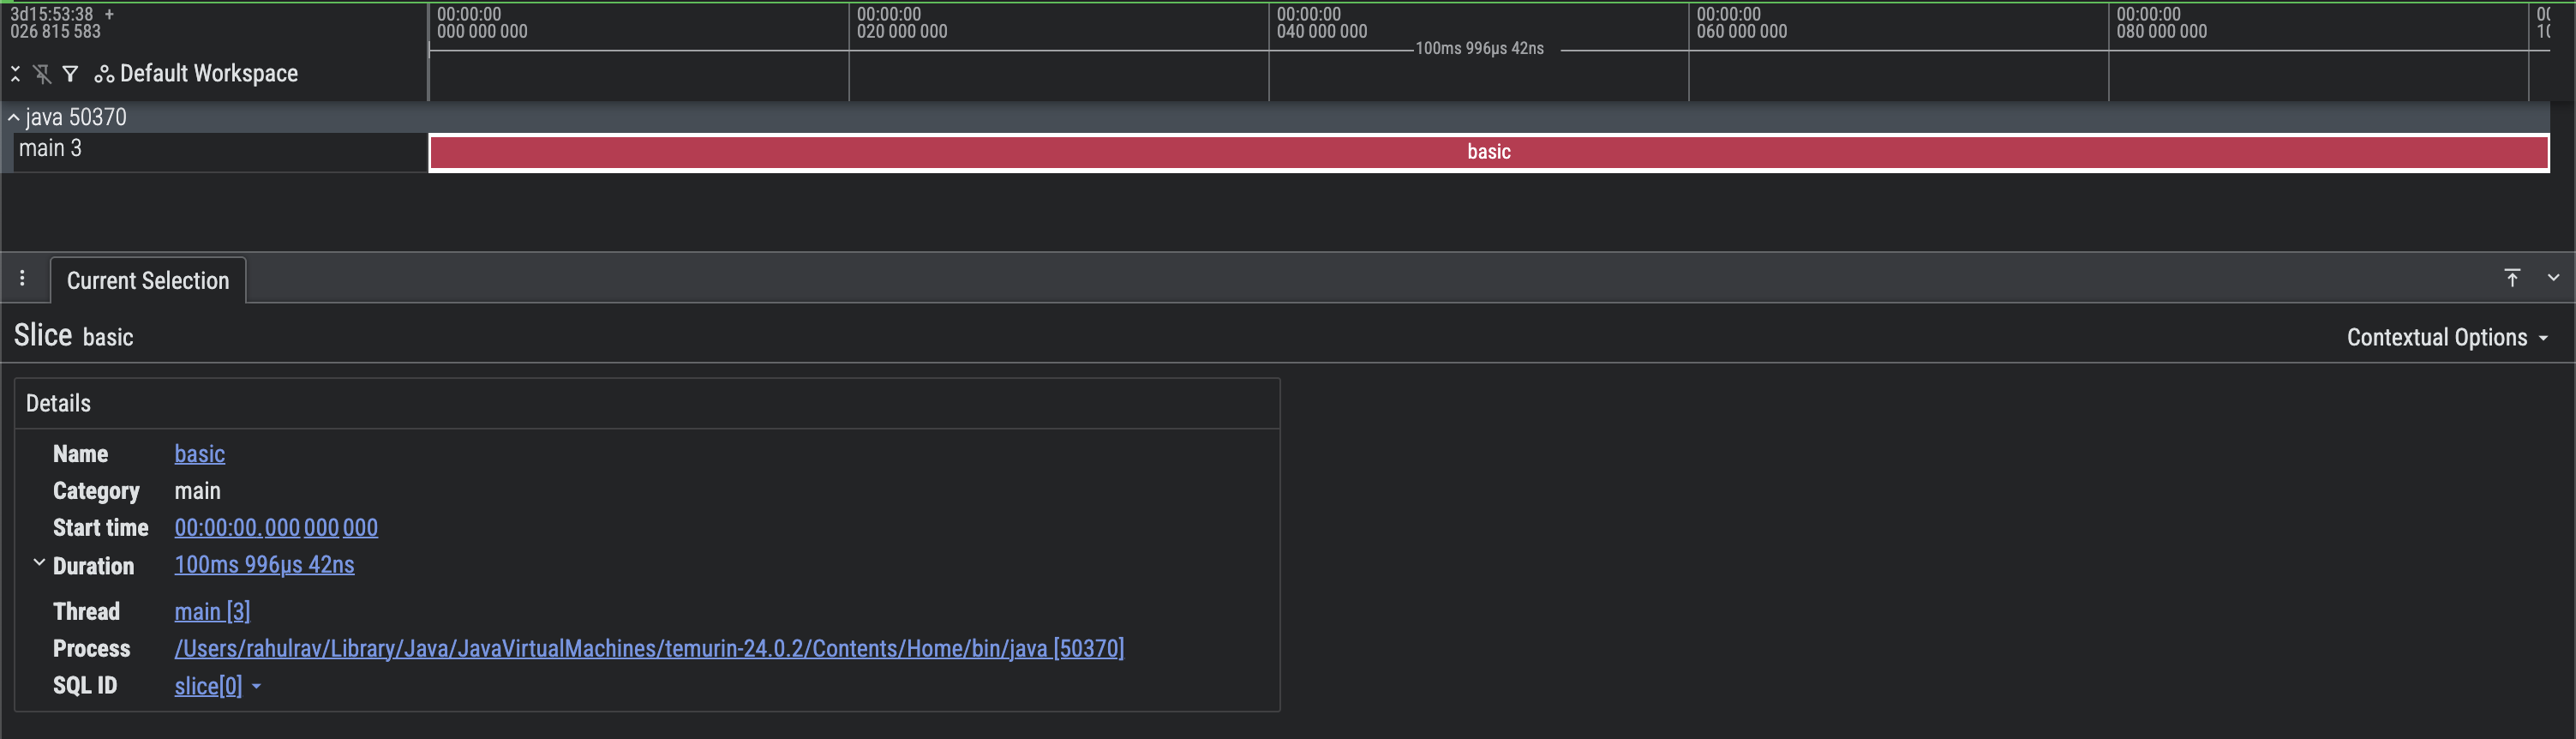
Figure 1. Screen capture of a basic Perfetto trace.
You can see that the correct process and thread tracks are populated and that
they produced a single trace section basic, which ran for 100 ms.
Trace sections (or slices) can be nested on the same track to represent overlapping events. Here is an example.
fun main() {
    val driver = createTraceDriver()
    @OptIn(DelicateTracingApi::class)
    Tracer.setGlobalTracer(driver.tracer)

    driver.use {
        Tracer.global.trace(
            category = CATEGORY_MAIN,
            name = "processImage",
        ) {
            // Load the data first, then apply the sharpen filter
            sharpen(output = loadImage())
        }
    }
}

internal fun loadImage(): ByteArray {
    return Tracer.global.trace(CATEGORY_MAIN, "loadImage") {
        // Loads an image
        // ...
        // A placeholder
        ByteArray(0)
    }
}

internal fun sharpen(output: ByteArray) {
    // ...
    Tracer.global.trace(CATEGORY_MAIN, "sharpen") {
        // ...
    }
}
This generates the following trace.

Figure 2. Screen capture of a basic Perfetto trace with nested sections.
You can see that there are overlapping events in the main thread track. It is
very clear that processImage calls loadImage and sharpen on the same
thread.
Add additional metadata in trace sections
Sometimes, it can be useful to attach additional contextual metadata to a trace
slice, to get more details. Some examples of such metadata could include the
nav destination that the user is on, or input arguments that might end up
determining how long a function takes.
fun main() {
    val driver = createTraceDriver()
    @OptIn(DelicateTracingApi::class)
    Tracer.setGlobalTracer(driver.tracer)

    driver.use {
        Tracer.global.trace(
            category = CATEGORY_MAIN,
            name = "basicWithContext",
            // Add additional metadata
            metadataBlock = {
                // Add key value pairs.
                addMetadataEntry("key", "value")
                addMetadataEntry("count", 1L)
            }
        ) {
            Thread.sleep(100L)
        }
    }
}
This produces the following result. Note the Arguments section contains key
value pairs added when producing the slice.
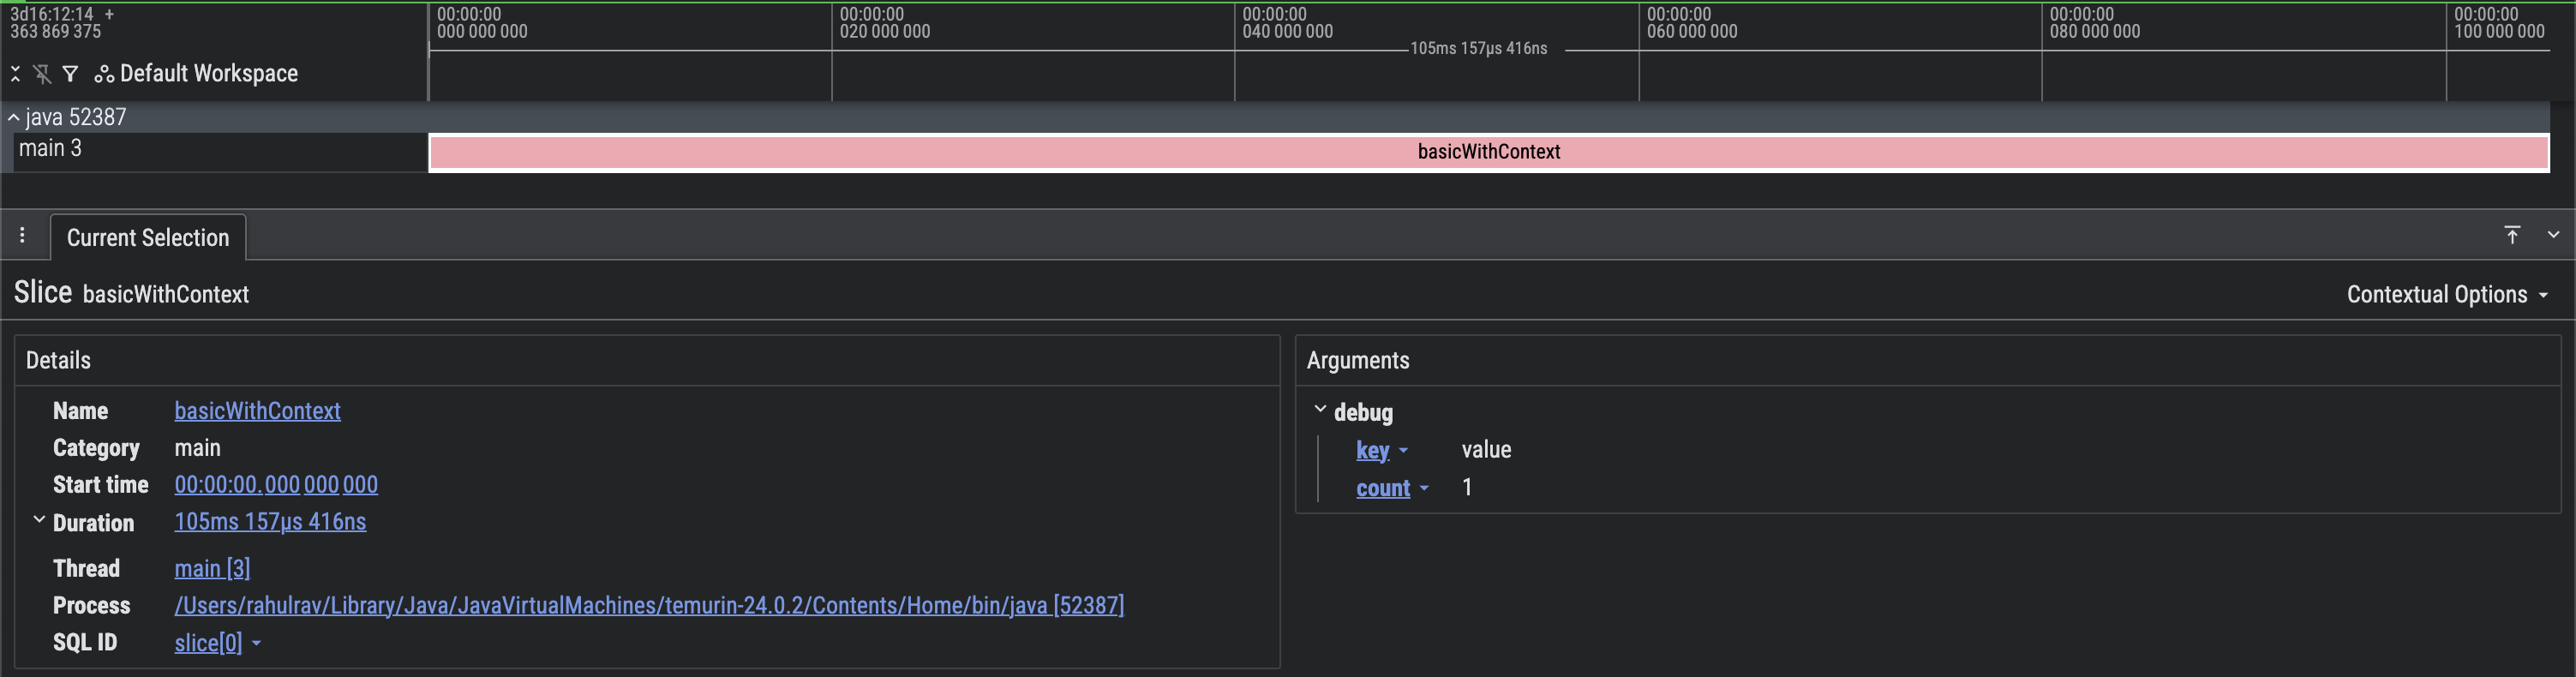
Figure 3. Screen capture of a basic Perfetto trace with additional metadata.
Context propagation
When using Kotlin coroutines, or other similar frameworks that help with concurrent workloads, Tracing 2.0 supports the notion of context propagation. This is best explained by an example.
suspend fun taskOne() {
    Tracer.global.traceCoroutine(category = CATEGORY_MAIN, "taskOne") {
        delay(timeMillis = 100L)
    }
}

suspend fun taskTwo() {
    Tracer.global.traceCoroutine(category = CATEGORY_MAIN, "taskTwo") {
        delay(timeMillis = 50L)
    }
}

fun main() = runBlocking(context = Dispatchers.Default) {
    val driver = createTraceDriver()
    @OptIn(DelicateTracingApi::class)
    Tracer.setGlobalTracer(driver.tracer)

    driver.use {
        Tracer.global.traceCoroutine(category = CATEGORY_MAIN, name = "main") {
              taskOne()
              taskTwo()
            }
        }
        println("All done")
    }
}
This produces the following result.
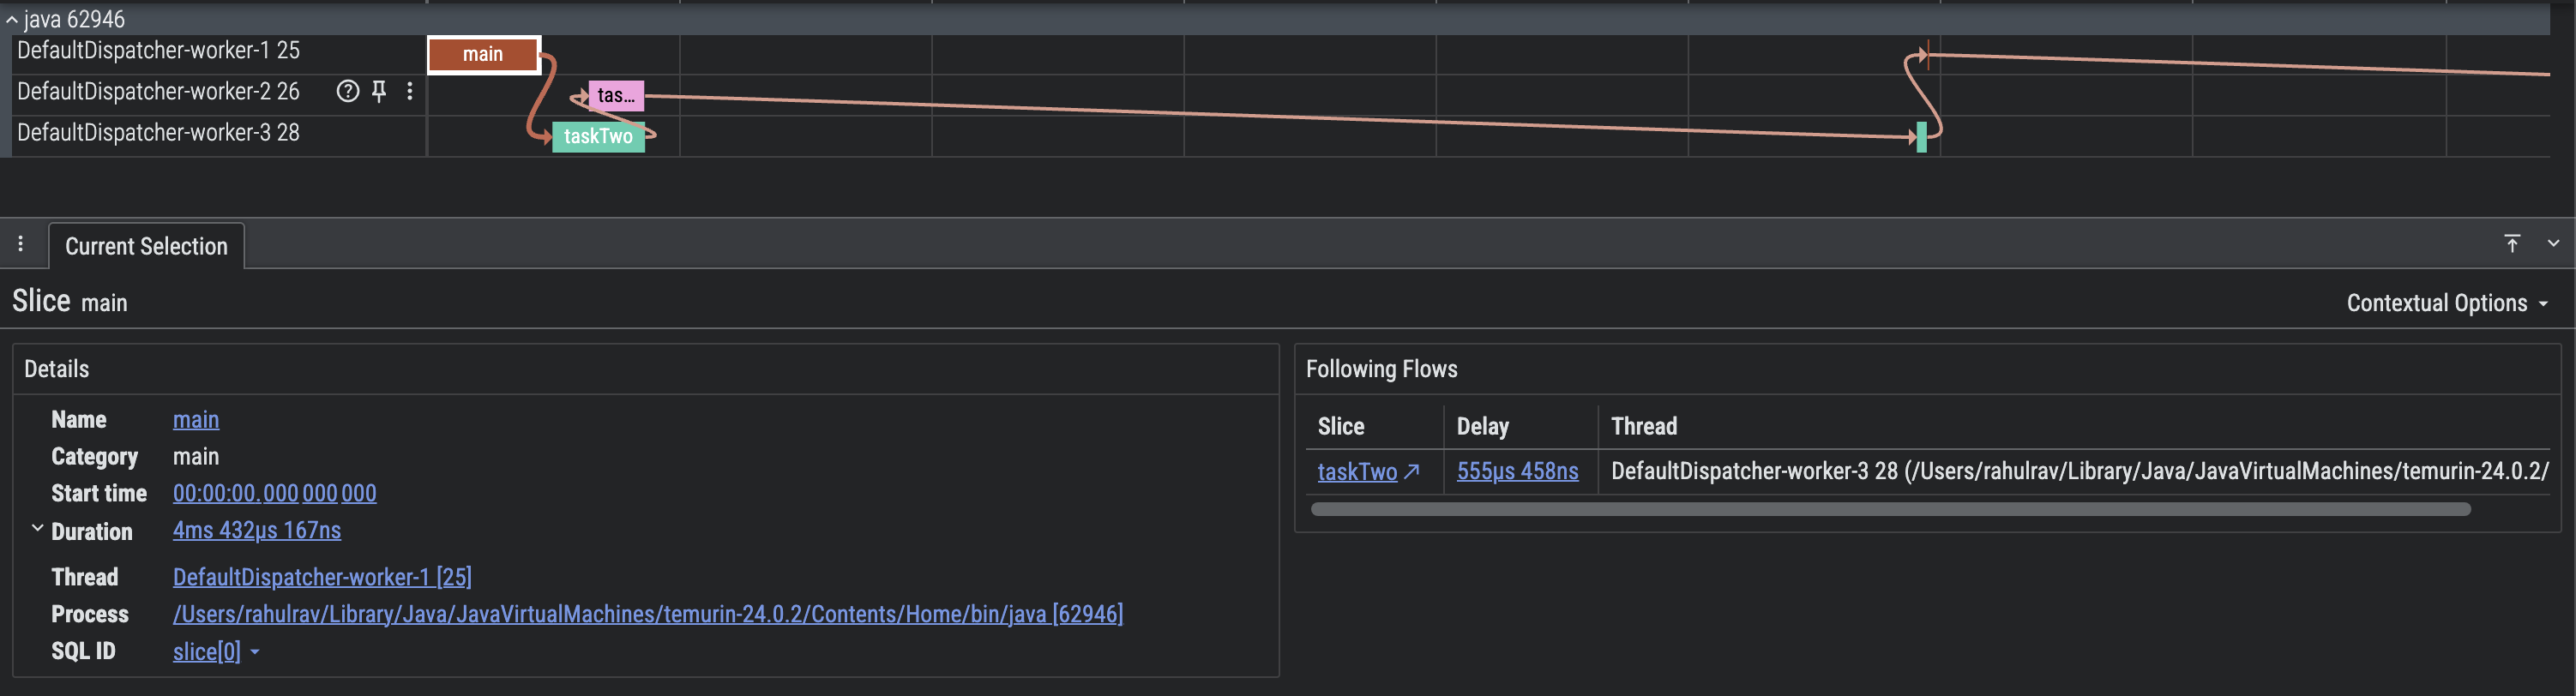
Figure 4. Screen capture of a basic Perfetto trace with context propagation.
Context Propagation makes it a lot simpler to visualize the flow of
execution. You can see exactly which tasks were related (connected to others),
and exactly when Threads were suspended and resumed.
For example, you can see that the slice main spawned taskOne and taskTwo.
After that, both threads were inactive because the coroutines were suspended due
to the use of delay.
Manual propagation
Sometimes, when you're mixing concurrent workloads using Kotlin coroutines with
instances of Java Executor it might be useful to propagate the context from
one to the other. Here is an example:
fun executorTask(
    token: PropagationToken,
    executor: Executor,
    callback: () -> Unit
) {
    executor.execute {
        Tracer.global.trace(
            category = CATEGORY_MAIN,
            name = "executeTask",
            token = token,
        ) {
            // Do something
            Thread.sleep(100)
            callback()
        }
    }
}

fun main() = runBlocking(context = Dispatchers.Default) {
    val driver = createTraceDriver()
    @OptIn(DelicateTracingApi::class)
    Tracer.setGlobalTracer(driver.tracer)

    val executor = Executors.newSingleThreadExecutor()
    driver.use {
        Tracer.global.traceCoroutine(category = CATEGORY_MAIN, name = "main") {
            coroutineScope {
                val deferred = CompletableDeferred<Unit>()
                executorTask(
                    // Obtain the propagation token from the CoroutineContext
                    token = Tracer.global.tokenFromCoroutineContext(),
                    executor = executor,
                    callback = {
                        deferred.complete(Unit)
                    }
                )
                deferred.await()
            }
        }
        executor.shutdownNow()
    }
}
This produces the following result.
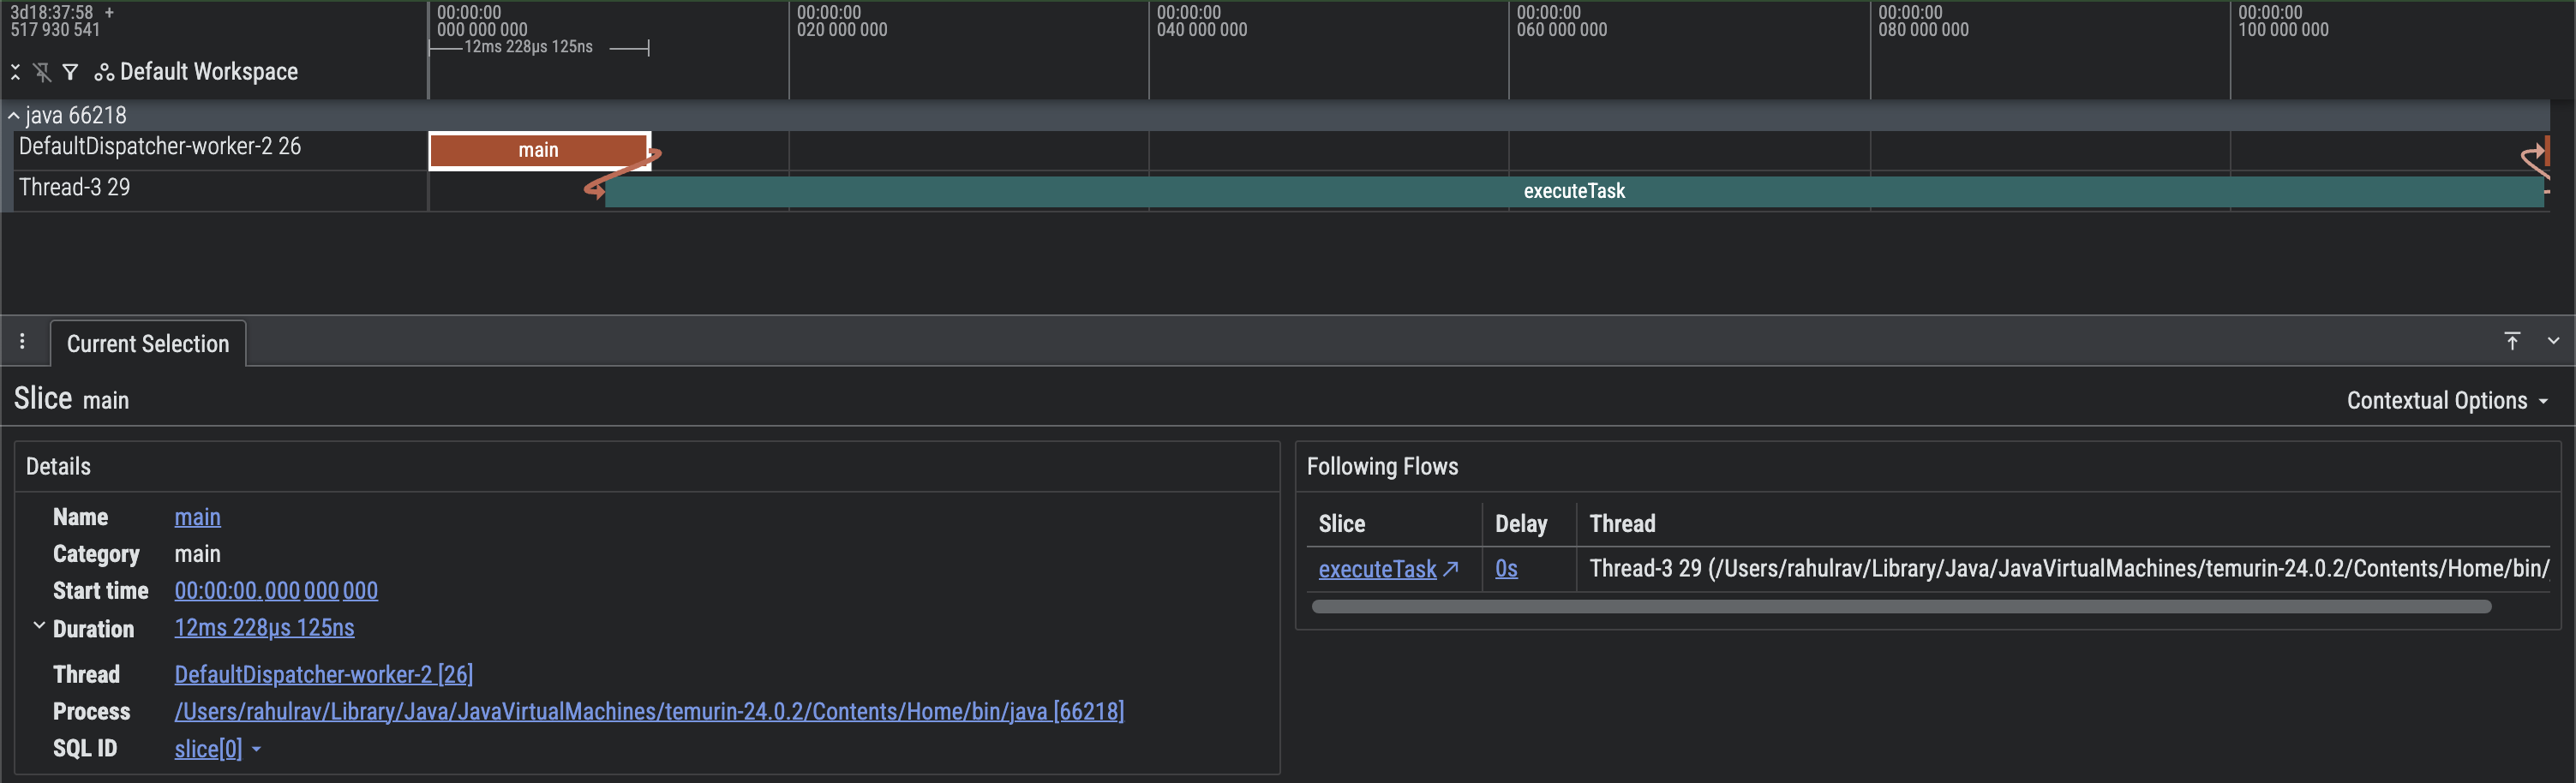
Figure 5. Screen capture of a basic Perfetto trace with manual context propagation.
You can see that execution started in a CoroutineContext, and subsequently
switched to a Java Executor, but we were still able to use context
propagation.
Combine with system traces
The androidx.tracing library doesn't capture information like CPU scheduling,
memory usage, and the application's interaction with the operating system in
general. This is because the library provides a way to perform
low-overhead in-process tracing.
However, it is extremely trivial to merge system traces with in-process traces
and visualize them as a single trace if needed. This is because Perfetto UI
supports visualizing multiple trace files from a device on a unified timeline.
To do this, you can start a system tracing session using Perfetto UI by
following instructions here.
You can also record in-process trace events using the Tracing 2.0 API, while
system tracing is turned on. Once you have both trace files you can use the
Open Multiple Trace Files option in Perfetto.
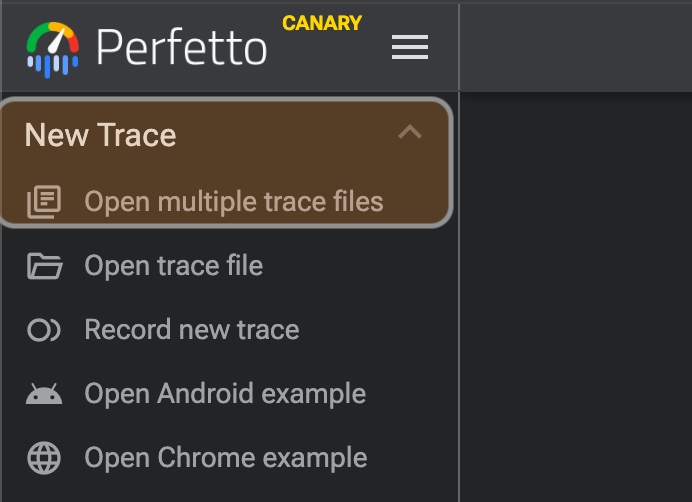
Figure 6. Opening multiple trace files in Perfetto UI.
Advanced workflows
This section describes advanced workflows you can implement with the in-process tracing library.
Correlate slices
Sometimes, it is useful to attribute slices in a trace to a more high level user action or a system event. For example to attribute all the slices that correspond to some background work as part of a notification, you could do something like:
fun main() {
    val driver = createTraceDriver()
    @OptIn(DelicateTracingApi::class)
    Tracer.setGlobalTracer(driver.tracer)

    driver.use {
        onEvent(eventId = EVENT_ID)
    }
}

fun onEvent(eventId: Long) {
    Tracer.global.trace(
        category = CATEGORY_MAIN,
        name = "step-1",
        metadataBlock = {
            addCorrelationId(eventId)
        }
    ) {
        Thread.sleep(100L)
    }

    Thread.sleep(20)

    Tracer.global.trace(
        category = CATEGORY_MAIN,
        name = "step-2",
        metadataBlock = {
            addCorrelationId(eventId)
        }
    ) {
        Thread.sleep(180)
    }
}
This produces the following result.
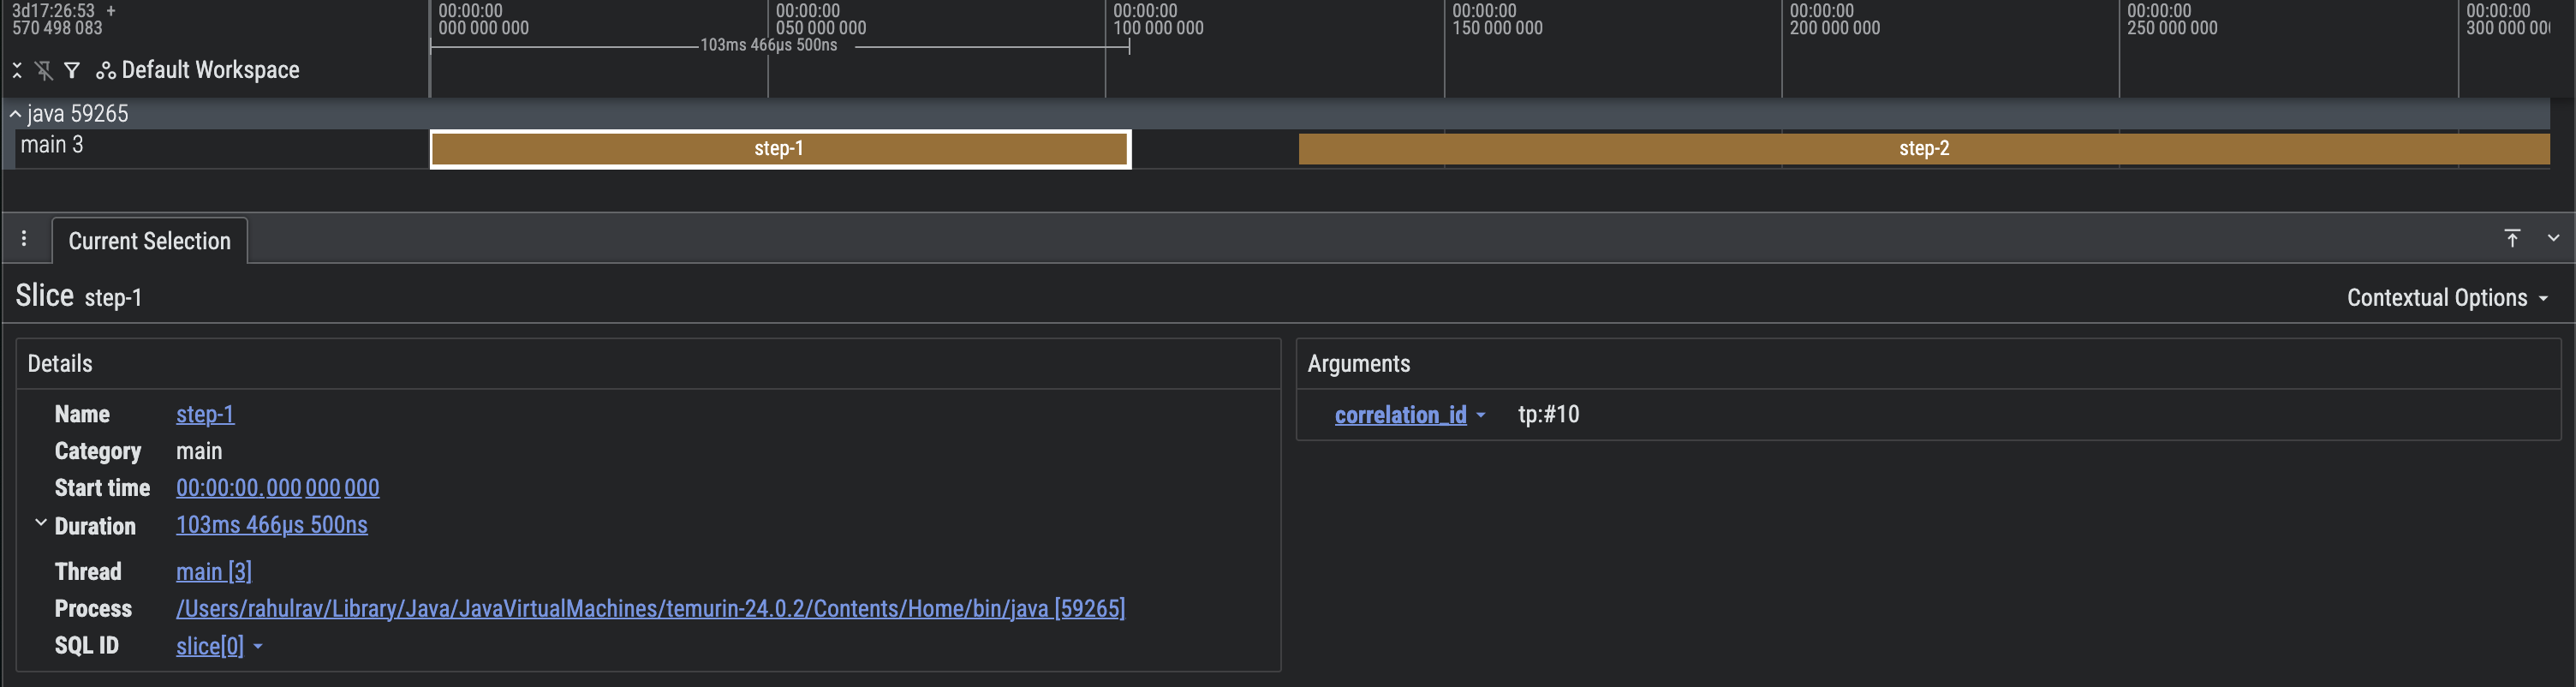
Figure 7. Screen capture of a Perfetto trace with correlated slices.
Add call stack information
Host-side tools, such as compiler plugins and annotation processors, can also choose to embed call stack information into a trace, to make it convenient to locate the file, class, or method responsible for producing a trace section in a trace.
fun main() {
    val driver = createTraceDriver()
    @OptIn(DelicateTracingApi::class)
    Tracer.setGlobalTracer(driver.tracer)

    driver.use {
        Tracer.global.trace(
            category = CATEGORY_MAIN,
            name = "callStackEntry",
            metadataBlock = {
                addCallStackEntry(
                    name = "main",
                    lineNumber = 14,
                    sourceFile = "Basic.kt"
                )
            }
        ) {
            Thread.sleep(100L)
        }
    }
}
This produces the following result.
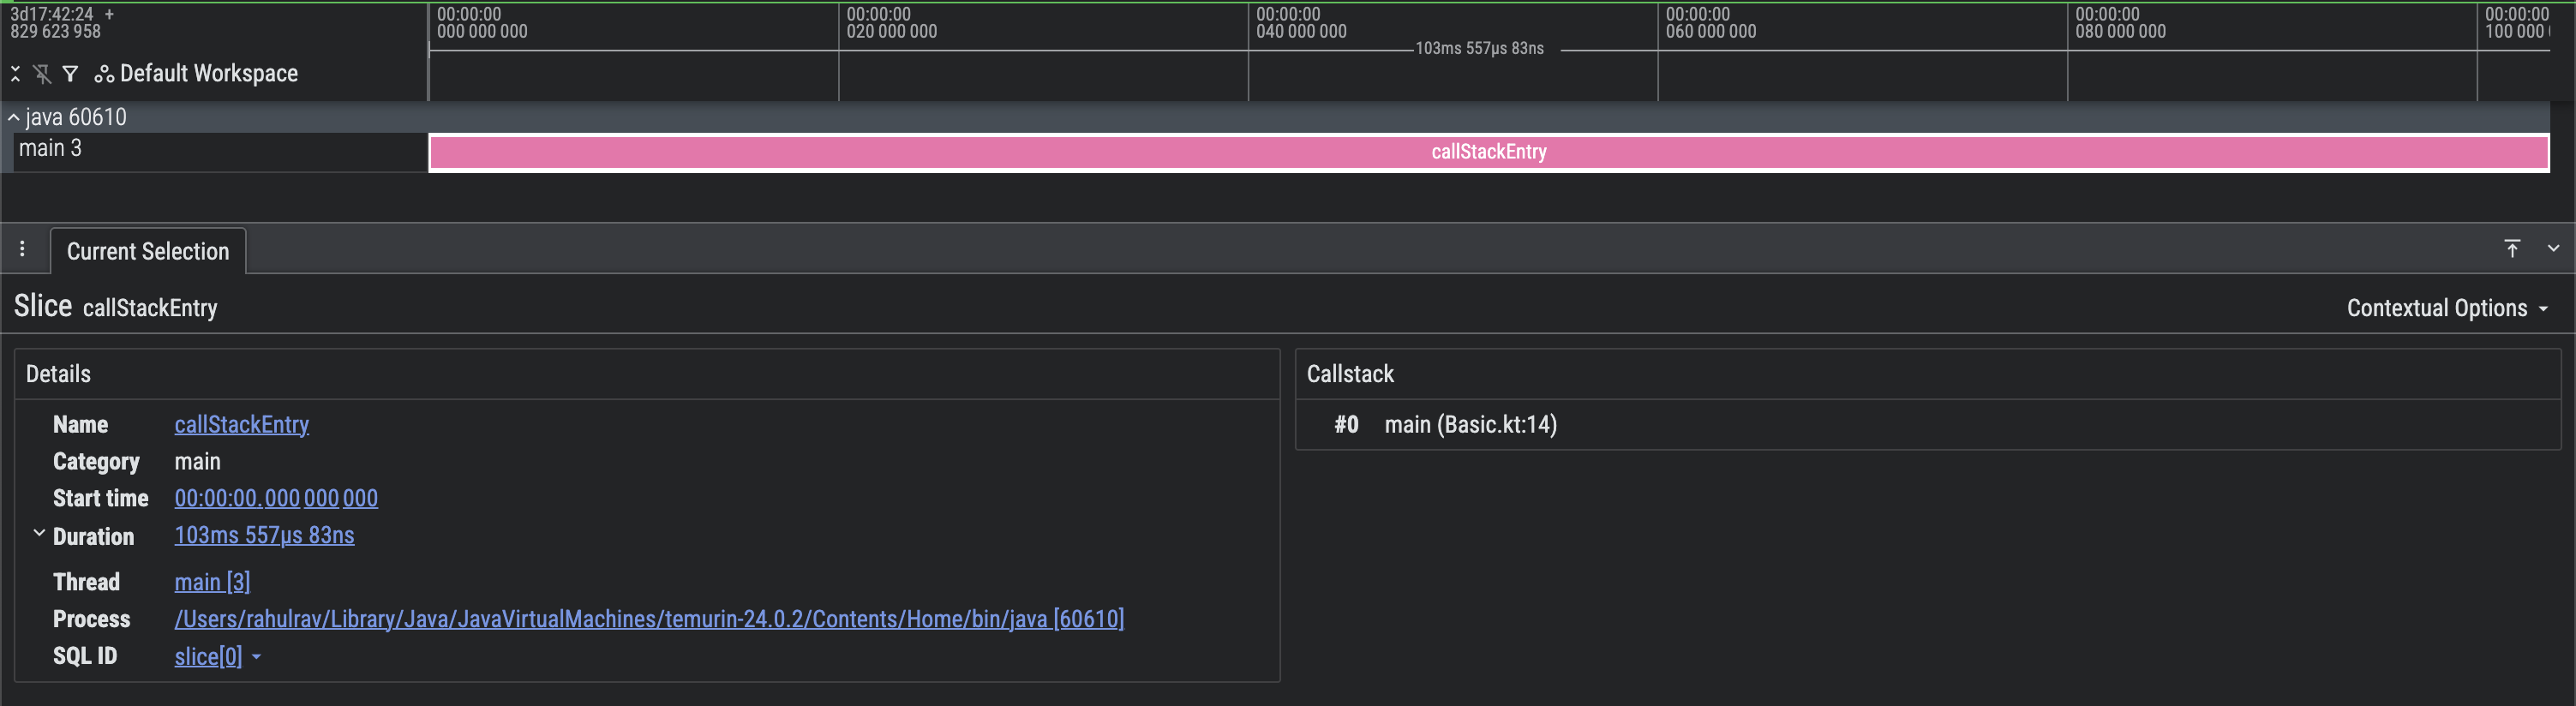
Figure 8. Screen capture of a Perfetto trace with call stack information.