
An app has poor performance if it responds slowly, shows choppy animations, freezes, or consumes too much power. Fixing performance problems involves profiling your app, or identifying areas in which your app makes inefficient use of resources such as the CPU, memory, graphics, or the device battery. This topic describes the Android Studio tools and techniques to use to fix common performance problems.
To learn how to run standalone profilers without running the entire Android Studio IDE (Windows or Linux only), see Run the standalone profiler.
Requirements
To profile your app, we recommend having the following:
An app with a release build variant that has the
profileablemanifest configuration enabled, also known as a profileable app. By default, apps have this configuration set to true. To check or change this configuration open your app's manifest orAndroidManifest.xmlfile and look in the<application>section for theprofileablemanifest configuration:<profileable android:shell="true" />A virtual or physical test device that runs API level 29 or higher and has Google Play.
Android Gradle Plugin 7.3 or higher.
Profileable v. debuggable apps
A profileable app lets you do most common profiling tasks, but you should use a debuggable app instead if you need to record Java/Kotlin allocations or capture a heap dump. A debuggable app process and device running API level 26 or higher also lets you see the Interaction timeline, which shows user interaction and app lifecycle events, in task views that provide it.
A debuggable app is based on the debug build variant of your app and lets you
use development tools such as the debugger; however, it comes
with some performance costs. A profileable app is based on the release build
variant of your app and enables a subset of common profiling tasks without the
performance overhead of the debug build.
Build and run a profileable app
To build and run a profileable app in Android Studio, follow these steps:
- Create a run/debug configuration if you don't already have one.
- Select your release build variant (Build > Select Build Variant).
- Click More actions
 > Profile 'app' with low overhead
 or Profile 'app' with complete data
 ("app" is the name of the run configuration, so it might be different for
you). To choose between the two options, see Requirements.
The app opens on your test device and the Profiler pane opens in Android
Studio.
("app" is the name of the run configuration, so it might be different for
you). To choose between the two options, see Requirements.
The app opens on your test device and the Profiler pane opens in Android
Studio.
If these instructions don't work for you, see Build and run a profileable app manually.
Start profiling
To start a profiling task, follow these steps:
Select a process from the list in the Home tab within the Profiler pane. In most cases, you'll want to select the top process that represents your app.
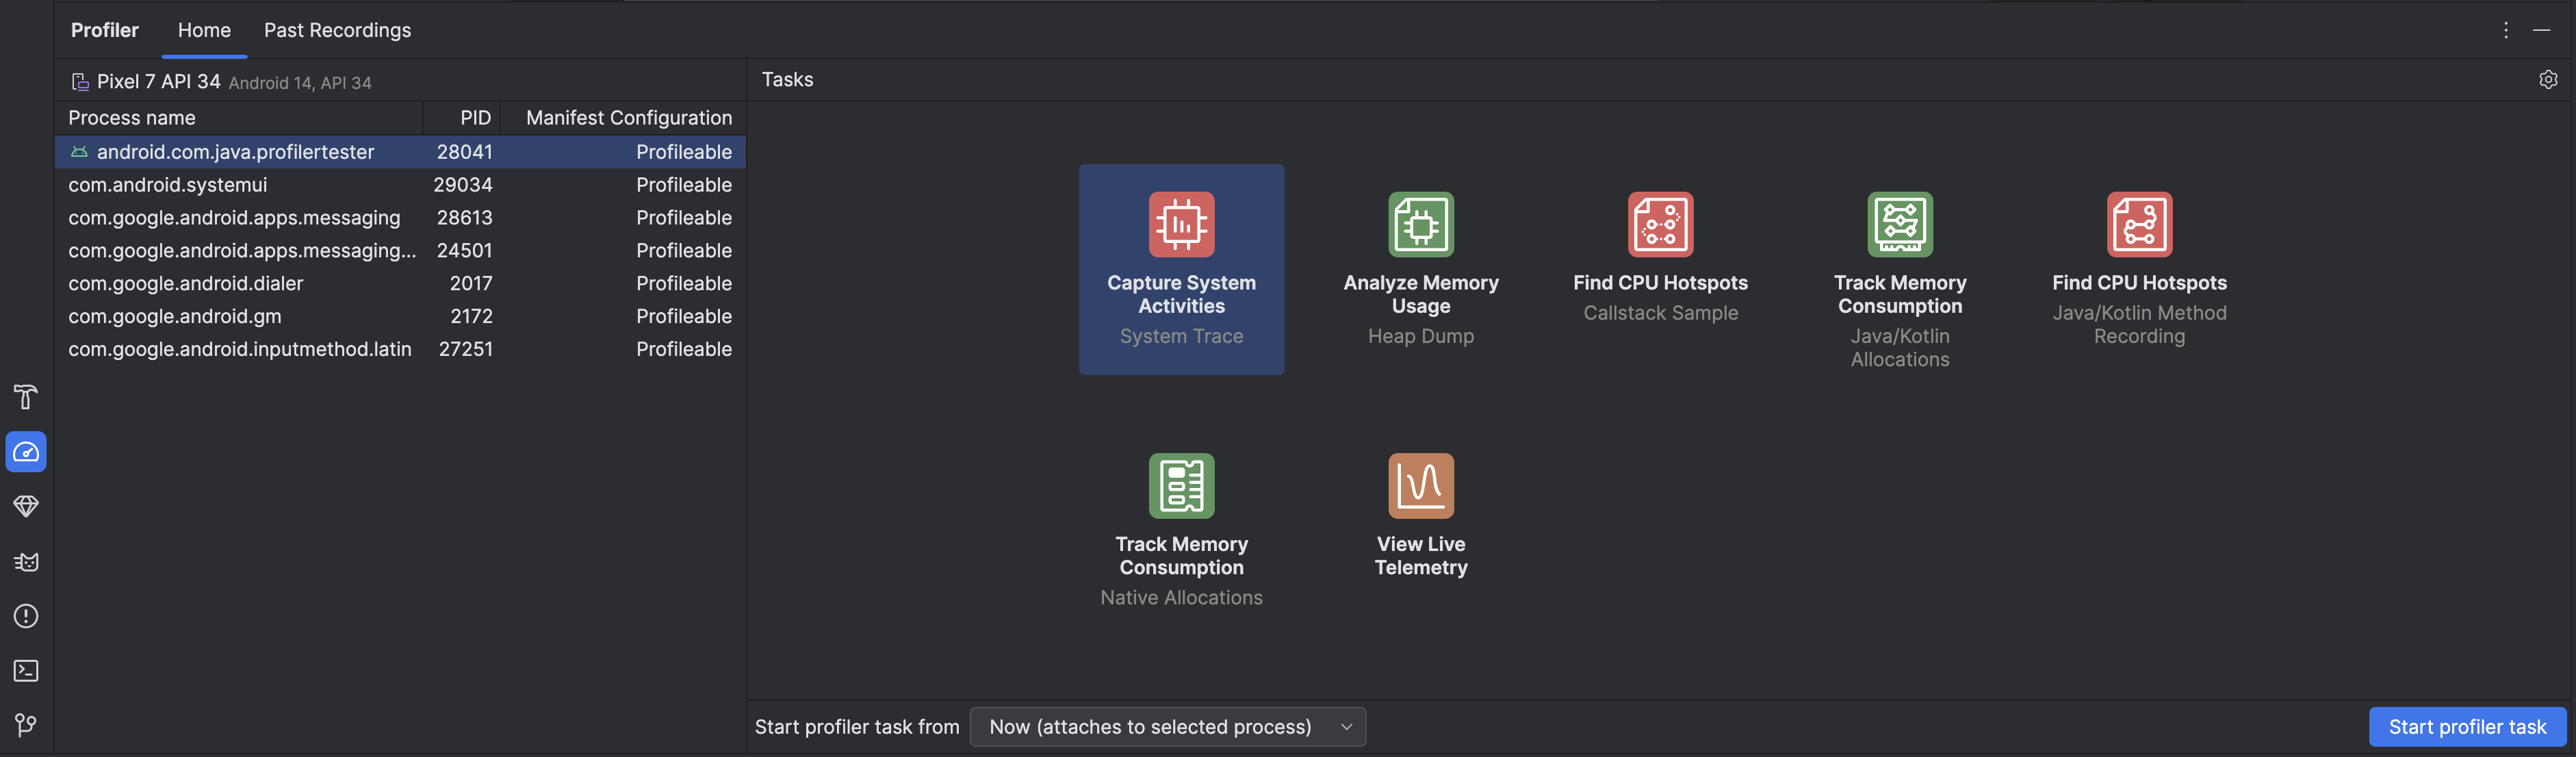
Select a profiling task from the Tasks section. For more info about the tasks, see the other pages in this section. Not all profiling tasks are available for every process. If you don't know where to start, get an overall view of performance activity by inspecting your app live.
Use the Start profiler task from drop-down to select whether to start the profiler task from startup or attach to the process as it's running. If you're trying to improve your app startup time or capture a process that happens during app startup, you should include startup; otherwise, you can start profiling at your app's current state.
Click Start profiler task. The task starts in its own tab.
Interact with your app so activities are triggered.
Stop the recording (if applicable), wait for it to parse, and see the results.
Compare, export, and import traces
When you stop a profiling task, it's automatically saved in the Past
Recordings tab within the Profiler pane. You can use these saved
recordings to compare resource usage in different scenarios. The recordings are
saved for the duration of the current Android Studio session; if you want to
keep them for longer, export them by clicking Export recording
 .
Not all trace types can be exported.
.
Not all trace types can be exported.
To import a trace, for example from a previous run of Android Studio, click
Import recording
 in the Past Recordings tab and select your trace file. You can also import a
file by dragging it into the Android Studio editor window.
in the Past Recordings tab and select your trace file. You can also import a
file by dragging it into the Android Studio editor window.
Edit the recording configuration
To edit your profiler task recording configuration, click the profiler settings
 .
There are two main settings you can toggle:
.
There are two main settings you can toggle:
- For tasks that involve sampling, the Sample interval represents the time between each sample. The shorter the interval you specify, the faster you reach the file size limit for the recorded data.
- The File size limit represents the amount of data that can be written to the connected device. When you stop recording, Android Studio parses this data and displays it in the profiler window. If you increase the limit and record a large amount of data, Android Studio takes much longer to parse the file and might become unresponsive.