
Out of Memory (OutOfMemoryError) crashes occur when your app exhausts its
allocated Java heap and can't fulfill a new memory allocation. Stack traces from
OutOfMemoryError crash reports rarely reveal the root cause because they
only show the allocation call that failed when memory ran out, not the objects
retaining the rest of the heap.
ProfilingManager lets you capture Java heap dumps from devices in the
field and locally so you can inspect the object retention graph in the Perfetto
UI and pinpoint what is holding onto memory.
Scenario
Suppose your crash reporting tool flags a growing cluster of OutOfMemoryError
crashes in production when users interact with OomSampleActivity.
To investigate, you register a TRIGGER_TYPE_OOM trigger with
ProfilingManager so the system automatically captures a Java heap dump when an
OutOfMemoryError occurs.
Capture the heap dump
On Android 17 (API level 37) and higher, to capture a heap dump when an
OutOfMemoryError crash occurs, configure trigger-based profiling with
ProfilingTrigger.TRIGGER_TYPE_OOM. When your app throws an unhandled
OutOfMemoryError, the system automatically starts a new
PROFILING_TYPE_JAVA_HEAP_DUMP capture.
Because the app process terminates when the crash occurs, the system finishes
saving the heap dump in the background and queues the result (see Trigger
lifecycle). Register a global result listener on a background Executor
after app startup completes (so you don't slow down app start) using
registerForAllProfilingResults so your app receives the queued
ProfilingResult the next time the user launches it. Unlike
addProfilingTriggers (which persists across app restarts and only needs to be
called once or when updating triggers), registerForAllProfilingResults must be
called on every app startup:
Kotlin
@RequiresApi(Build.VERSION_CODES.CINNAMON_BUN) fun registerOomTrigger(context: Context) { val profilingManager = context.getSystemService(ProfilingManager::class.java) ?: return val callbackExecutor: Executor = Executors.newSingleThreadExecutor() val resultCallback = Consumer<ProfilingResult> { profilingResult -> if ( profilingResult.errorCode == ProfilingResult.ERROR_NONE && profilingResult.triggerType == ProfilingTrigger.TRIGGER_TYPE_OOM ) { val heapDumpPath = profilingResult.resultFilePath // Schedule a background job to compress and upload heapDumpPath } } profilingManager.registerForAllProfilingResults(callbackExecutor, resultCallback) val oomTrigger = ProfilingTrigger.Builder(ProfilingTrigger.TRIGGER_TYPE_OOM) .build() profilingManager.addProfilingTriggers(listOf(oomTrigger)) }
Java
@RequiresApi(Build.VERSION_CODES.CINNAMON_BUN) public static void registerOomTrigger(Context context) { ProfilingManager profilingManager = context.getSystemService(ProfilingManager.class); if (profilingManager == null) return; Executor callbackExecutor = Executors.newSingleThreadExecutor(); Consumer<ProfilingResult> resultCallback = profilingResult -> { if (profilingResult.getErrorCode() == ProfilingResult.ERROR_NONE && profilingResult.getTriggerType() == ProfilingTrigger.TRIGGER_TYPE_OOM) { String heapDumpPath = profilingResult.getResultFilePath(); // Schedule a background job to compress and upload heapDumpPath } }; profilingManager.registerForAllProfilingResults(callbackExecutor, resultCallback); ProfilingTrigger oomTrigger = new ProfilingTrigger.Builder(ProfilingTrigger.TRIGGER_TYPE_OOM) .build(); profilingManager.addProfilingTriggers(Collections.singletonList(oomTrigger)); }
Deobfuscate the profile
After an OutOfMemoryError triggers a capture and your callback receives the
ProfilingResult on the next app launch, upload the profile file to your
server or pull it to your development machine with adb. If you captured
the profile from a release build that uses R8 code shrinking and
obfuscation, deobfuscate it offline on your workstation or server before
analysis. Without deobfuscation, R8 obfuscates the Java and Kotlin class, field,
and method names in the raw heap dump (for example, turning original class names
into a.b).
Use Perfetto's trace_processor bundle command with the --proguard-map
flag to package the captured profile together with the R8 mapping.txt file
generated for that exact release build:
trace_processor bundle \
  --proguard-map /path/to/mapping.txt \
  profile_trigger-type-7_2026-05-06-14-12-40-748_uid-10316.perfetto-java-heap-dump \
  deobfuscated_oom.tar
This command produces deobfuscated_oom.tar, an enriched archive that bundles
the original profile with its deobfuscation mappings. When you open this archive
in the Perfetto UI or query it with trace_processor, Perfetto automatically
restores all original class, field, and method names. For more information, see
the Perfetto Symbolization and deobfuscation documentation.
Analyze the heap dump
You can inspect the deobfuscated heap dump manually in the Perfetto UI as shown in the following steps, or automate the OOM investigation with an AI agent.
Open the deobfuscated heap dump in the Perfetto UI and select Heapdump Explorer in the left navigation bar. In the Flamegraph tab with Measure set to Object Size, the retention hierarchy in Figure 1 immediately stands out.
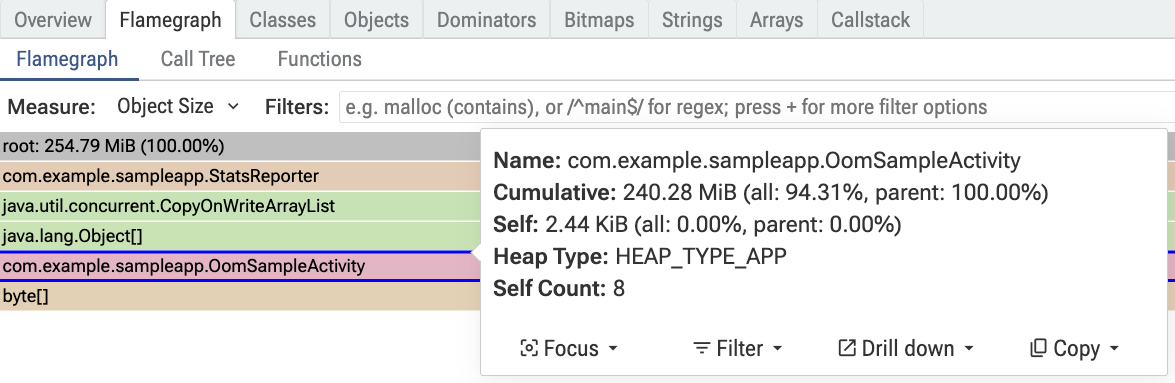
OomSampleActivity.Inspecting the flame graph in Figure 1 reveals several key findings:
- Massive memory retention: Out of a 254.79 MiB total heap (
root),com.example.sampleapp.OomSampleActivityretains a Cumulative size of 240.28 MiB (94.31% of the entire app heap), most of which sits in a childbyte[]array. - Multiple live activity instances: Selecting the
OomSampleActivityframe shows Self Count: 8. Even though only one instance ofOomSampleActivityshould exist on screen at any given time, 8 separate instances are alive in memory simultaneously. - The retaining object path: Reading the parent frames of
OomSampleActivityin the flame graph shows the reference chain keeping those instances alive:com.example.sampleapp.StatsReporterholds ajava.util.concurrent.CopyOnWriteArrayList(backed byjava.lang.Object[]), which directly references all 8OomSampleActivityinstances.
Identify the root cause in code
With the retention path pointing from StatsReporter to OomSampleActivity,
inspect both classes in your codebase.
StatsReporter is a singleton that maintains a list of StatsListener
callbacks and periodically posts updates from a background polling thread:
Kotlin
class StatsReporter private constructor() { fun interface StatsListener { fun onReportStats(stats: String) } private val listeners: MutableList<StatsListener> = CopyOnWriteArrayList() private var isReporting = false init { startReporting() } fun registerListener(listener: StatsListener) { if (!listeners.contains(listener)) { listeners.add(listener) } } fun unregisterListener(listener: StatsListener) { listeners.remove(listener) } private fun startReporting() { if (isReporting) return isReporting = true Thread({ while (true) { try { // Poll every 10 seconds Thread.sleep(10000) } catch (e: InterruptedException) { Thread.currentThread().interrupt() break } for (listener in listeners) { // Send periodic mock stats update from the background thread listener.onReportStats("Update from StatsReporter background polling thread") } } }, "StatsReporterPollingThread").start() } companion object { private var instance: StatsReporter? = null @JvmStatic fun getInstance(): StatsReporter { return instance ?: StatsReporter().also { instance = it } } } }
Java
public class StatsReporter { public interface StatsListener { void onReportStats(String stats); } private static StatsReporter sInstance; private final List<StatsListener> mListeners = new CopyOnWriteArrayList<>(); private boolean mIsReporting = false; private StatsReporter() { startReporting(); } public static StatsReporter getInstance() { if (sInstance == null) { sInstance = new StatsReporter(); } return sInstance; } public void registerListener(StatsListener listener) { if (!mListeners.contains(listener)) { mListeners.add(listener); } } public void unregisterListener(StatsListener listener) { mListeners.remove(listener); } private void startReporting() { if (mIsReporting) return; mIsReporting = true; new Thread(() -> { while (true) { try { // Poll every 10 seconds Thread.sleep(10000); } catch (InterruptedException e) { Thread.currentThread().interrupt(); break; } for (StatsListener listener : mListeners) { // Send periodic mock stats update from the background thread listener.onReportStats("Update from StatsReporter background polling thread"); } } }, "StatsReporterPollingThread").start(); } }
Next, inspect OomSampleActivity:
Kotlin
class OomSampleActivity : Activity(), StatsReporter.StatsListener { // Allocate some memory. private val heavyData = ByteArray(30 * 1024 * 1024) override fun onCreate(savedInstanceState: Bundle?) { super.onCreate(savedInstanceState) setContentView(R.layout.activity_oom_sample) StatsReporter.getInstance().registerListener(this) } override fun onReportStats(stats: String) { // Read from heavyData so R8 doesn't strip it out as dead code during release builds Log.d(TAG, "Received stats in heavy leaked activity: $stats | Data size: ${heavyData.size}") } companion object { private const val TAG = "OomSampleActivity" } }
Java
public class OomSampleActivity extends Activity implements StatsReporter.StatsListener { private static final String TAG = "OomSampleActivity"; // Allocate some memory. private final byte[] mHeavyData = new byte[30 * 1024 * 1024]; @Override protected void onCreate(Bundle savedInstanceState) { super.onCreate(savedInstanceState); setContentView(R.layout.activity_oom_sample); StatsReporter.getInstance().registerListener(this); } @Override public void onReportStats(String stats) { // Read from mHeavyData so R8 does not strip it out as dead code during release builds Log.d(TAG, "Received stats in heavy leaked activity: " + stats + " | Data size: " + mHeavyData.length); } }
The code confirms why StatsReporter retains 8 instances of
OomSampleActivity:
- Each
OomSampleActivityinstance allocates a 30 MiBbyte[]buffer (heavyDatain Kotlin,mHeavyDatain Java) and registers itself as a listener on the singletonStatsReporterinonCreate. OomSampleActivitynever callsunregisterListenerwhen the system destroys it. BecauseStatsReporteroutlives the activity and holds a strong reference to every registered listener, the garbage collector can't reclaim destroyed instances or their 30 MiBbyte[]arrays.- Every time the system destroys and recreates
OomSampleActivity, such as during a screen rotation in the Android activity lifecycle, another 30 MiB instance leaks inStatsReporter. After 7 rotations (8 instances × 30 MiB ≈ 240 MiB), the heap fills up and the app crashes with anOutOfMemoryError.
Fix the leak
To fix the memory leak, override onDestroy in the activity and call
StatsReporter.getInstance().unregisterListener(this) so the singleton releases
its reference when the system destroys the activity:
Kotlin
class OomSampleActivityFixed : Activity(), StatsReporter.StatsListener { // Allocate some memory. private val heavyData = ByteArray(30 * 1024 * 1024) override fun onCreate(savedInstanceState: Bundle?) { super.onCreate(savedInstanceState) setContentView(R.layout.activity_oom_sample) // Register the activity as a listener StatsReporter.getInstance().registerListener(this) } override fun onDestroy() { super.onDestroy() // FIX: Unregister the listener to prevent the memory leak // when the Activity is destroyed (for example, during screen rotation). StatsReporter.getInstance().unregisterListener(this) } override fun onReportStats(stats: String) { // Read from heavyData so R8 doesn't strip it out as dead code during release builds Log.d(TAG, "Received stats in fixed heavy activity: $stats | Data size: ${heavyData.size}") } companion object { private const val TAG = "OomSampleFixed" } }
Java
public class OomSampleActivityFixed extends Activity implements StatsReporter.StatsListener { private static final String TAG = "OomSampleFixed"; // Allocate some memory. private final byte[] mHeavyData = new byte[30 * 1024 * 1024]; @Override protected void onCreate(Bundle savedInstanceState) { super.onCreate(savedInstanceState); setContentView(R.layout.activity_oom_sample); // Register the activity as a listener StatsReporter.getInstance().registerListener(this); } @Override protected void onDestroy() { super.onDestroy(); // FIX: Properly unregister the listener to prevent the memory leak // when the Activity is destroyed (e.g., during screen rotation). StatsReporter.getInstance().unregisterListener(this); } @Override public void onReportStats(String stats) { // Read from mHeavyData so R8 does not strip it out as dead code during release builds Log.d(TAG, "Received stats in fixed heavy activity: " + stats + " | Data size: " + mHeavyData.length); } }
Automate the OOM investigation with an AI agent
Instead of manually inspecting the flame graph and tracing references across files, you can use an AI coding agent configured with the Perfetto AI skill to analyze the heap dump and correlate it with your codebase:
Analyze the Perfetto OOM heap dump at </path/to/profile>, which corresponds to
the codebase located at </path/to/codebase> using the Perfetto AI skill and find
the root cause of the OutOfMemoryError.
The agent queries the heap dump with trace_processor, traces the dominator
path from StatsReporter to the leaked OomSampleActivity instances, and
inspects both classes in your codebase. Without manual intervention, it reaches
the same conclusion, that OomSampleActivity registers a listener in onCreate
without unregistering it, and generates a patch adding
unregisterListener(this) in onDestroy (the following report was generated
from a separate capture that had 7 retained instances at the time of the crash):
# Perfetto OOM Heap Dump Analysis Report

## 1. Orienting Context & First-Pass Triage

| Property | Value |
| :--- | :--- |
| **Process Name** | `com.example.sampleapp` |
| **Sample Timestamp (`graph_sample_ts`)** | `3433221241585` |
| **Leaf Retained Class** | `byte[]` (7 instances) |
| **Leaf Self Size** | `220,201,044` bytes (~210 MiB) |

### Dominator Tree Retention Path

Querying the `android.memory.heap_graph.dominator_tree` standard library module identifies the following largest dominated class path from GC root to leaf allocation:

    [ROOT_JAVA_FRAME] com.example.sampleapp.StatsReporter [1]
      -> java.util.concurrent.CopyOnWriteArrayList [1]
      -> java.lang.Object[] [1]
      -> com.example.sampleapp.OomSampleActivity [7]
      -> byte[] [7] (220,201,044 bytes)
## 2. Root Cause Analysis

> **Important:** The `OutOfMemoryError` is caused by an **Activity listener leak**: `OomSampleActivity` (`app/src/main/java/com/example/sampleapp/OomSampleActivity.java#L8-L27`) registers itself as a listener on the long-lived `StatsReporter` (`app/src/main/java/com/example/sampleapp/StatsReporter.java#L6-L61`) singleton in `onCreate()`, but never unregisters itself in `onDestroy()`.

### Step-by-Step Retention Mechanism

1. **Per-Activity 30 MiB Allocation:**
   Each instance of `OomSampleActivity` (`OomSampleActivity.java#L11-L12`) allocates a 30 MiB byte array (`30 * 1024 * 1024 = 31,457,280` bytes):
   ```java
   // OomSampleActivity.java:12
   private final byte[] mHeavyData = new byte[30 * 1024 * 1024];
   ```

2. **Strong Reference Registration in `onCreate()`:**
   When created, `OomSampleActivity.onCreate()` (`OomSampleActivity.java#L15-L20`) registers `this` with `StatsReporter` (`StatsReporter.java#L29-L33`):
   ```java
   // OomSampleActivity.java:19
   StatsReporter.getInstance().registerListener(this);
   ```

3. **GC Root Pinning via Background Thread & Singleton:**
   `StatsReporter` (`StatsReporter.java#L11-L60`) is both a static singleton (`sInstance`) and the owner of an active background thread (`StatsReporterPollingThread`, which holds a `[ROOT_JAVA_FRAME]` GC root reference while sleeping/looping in `startReporting()`). It stores listeners in `mListeners` (`CopyOnWriteArrayList<StatsListener>`).

4. **Leak Accumulation Across Activity Recreations:**
   Because `OomSampleActivity` does not override `onDestroy()` to call `StatsReporter.unregisterListener(this)`, every destroyed instance of `OomSampleActivity` remains strongly reachable in `mListeners`. After 7 Activity creations (7 * 30 MiB = 220,200,960 bytes plus array headers = `220,201,044` bytes), the Java heap is exhausted.

---

## 3. Actionable Implementation Plan

### 1. Unregister the Listener in `OomSampleActivity.onDestroy()`

Update `OomSampleActivity.java` to unregister the listener when the `Activity` is destroyed (matching the fix in `OomSampleActivityFixed.java`):

```diff
--- a/app/src/main/java/com/example/sampleapp/OomSampleActivity.java
+++ b/app/src/main/java/com/example/sampleapp/OomSampleActivity.java
@@ -19,4 +19,10 @@
         StatsReporter.getInstance().registerListener(this);
     }

+    @Override
+    protected void onDestroy() {
+        super.onDestroy();
+        StatsReporter.getInstance().unregisterListener(this);
+    }
+
     @Override
```

### 2. Optional Architectural Hardening in `StatsReporter`

* **Lifecycle-Aware Registration:** Have `StatsReporter.registerListener()` accept a `LifecycleOwner` and attach a `DefaultLifecycleObserver` that automatically invokes `unregisterListener()` on `ON_DESTROY`.
* **Weak References:** Store `WeakReference<StatsListener>` entries in `StatsReporter` and evict cleared references during iteration so forgotten `unregisterListener()` calls cannot retain entire `Activity` hierarchies.
Verify the fix
Verify that the leak is resolved either locally on a test device or in production.
If the issue is reproducible locally
Because TRIGGER_TYPE_OOM only captures a heap dump when an OutOfMemoryError
occurs, a successful fix prevents the trigger from firing. To inspect the heap
and confirm the leak is gone, rotate the screen and then capture an on-demand
Java heap dump from the command line:
- Disable the rate limiter (
rate_limiter.disabled true) and retain temporary results (delete_temporary_results.disabled true) so the system keeps the command-line capture in/data/misc/perfetto-traces/profiling/. - Open
OomSampleActivityFixedon your test device, rotate the screen 8 or more times to confirm the app no longer crashes, and keep it in the foreground. Trigger an on-demand Java heap dump (
profiling_type1) using thecmd profiling_service request-profilingshell command:adb shell cmd profiling_service request-profiling 1 com.example.sampleappPull the retained profile from
/data/misc/perfetto-traces/profiling/and open it in the Perfetto UI.
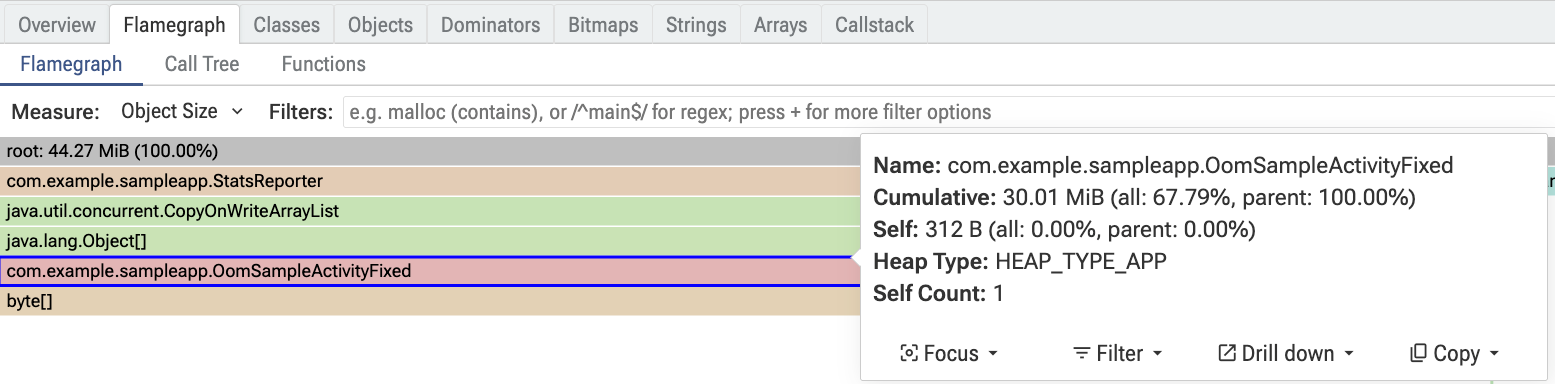
OomSampleActivityFixed.As shown in Figure 2, after multiple screen rotations:
com.example.sampleapp.OomSampleActivityFixedhas a Self Count of 1 instead of accumulating an instance on every rotation.- Its Cumulative retained size remains steady at 30.01 MiB (out of a 44.27 MiB total heap), confirming that the garbage collector reclaims previous activity instances.
If the issue is hard to reproduce locally
When complex multi-screen navigation, long-lived sessions, or specific user data
causes an OutOfMemoryError that you can't reliably reproduce on a test device,
validate the fix in production after rollout:
- Monitor the
OutOfMemoryErrorcrash cluster in your crash reporting tool as a proxy metric across releases to confirm that crashes involvingOomSampleActivitydrop off. - Inspect any new
TRIGGER_TYPE_OOMheap dumps collected from the updated release to verify thatStatsReporterno longer retains destroyedOomSampleActivityinstances.