
This guide outlines a typical game development cycle. After reading this guide, you might find it helpful to use also as a reference.
When you work with Unity, the development lifecycle consists of three phases:
- Plan and design
- Develop and test
- Publish and maintain
Plan and design
In the plan and design phase, you determine how to build your game. You decide how to address the challenges of developing for mobile, and identify the tools and processes to use in development.
Get input from all team members
Work with your art, engineering, design, audio, and production teams to identify and record implementation tasks. For example:
- Art teams might create asset texture and mesh budgets for characters and environments.
- Engineering might determine memory and performance checkpoints for profiling against each platform.
- Design might plan the game mechanics that enable the experience.
- Audio experts might review requirements for sound continuity between UI, 2D, and 3D spatial sounds.
- Production might communicate launch requirements and keep the team aligned and on-track.
Design for mobile
Application development for mobile platforms involves specific considerations, such as:
- Variable screen aspect ratios
- Power consumption
- Thermal and processor throttling
- Touch input
- Cross-platform development
- Graphic APIs (Vulkan or OpenGL ES)
For details about considerations unique to designing for mobile, see Android development in Unity from Unity, and the Google Play Academy.
Develop and test
In the develop and test phase, you build your game and do testing and pre-launch preparation. You do some limited internal testing on Google Play to prepare you to meet launch requirements. You refine your deployment strategy and organize assets in Unity based on the Play Asset Delivery and Unity Addressables systems.
The following sections describe Unity tools and techniques that are designed to help you develop for Android.
Render
Rendering is the process of drawing the 3D and 2D assets from your Unity scene on the screen. While the Unity engine handles rendering, it's important to consider a few factors for the Android platform.
Textures
Determine whether you need the largest texture sizes, based on your target devices. When you profile memory allocation, review the potential savings of changing the target texture size.
Frame time
To prevent overheating on Android devices, target frame time values of under 21 milliseconds on average. Sometimes, such as during loading or short cinematic experiences, your frame times can exceed 21 milliseconds, but you should stay under the 21 millisecond threshold for the core game experience.
On mobile platforms, forced VSync throttles the frame rate if you don't reach the minimum target. For example, on a 60Hz screen update, if you don't hit 60fps, your game is throttled to 30; if you don't hit 30, you are throttled to 15.
Many Android devices ship with display refresh rates of 60Hz and 120Hz. Weigh the benefits of targeting much smaller frame times (10ms target for 60Hz update, and 5ms for 120Hz) without risking the thermal throttling and battery drain for higher rendering rates.
To set a specific frame rate in your game in Unity, use Application.targetFrameRate.
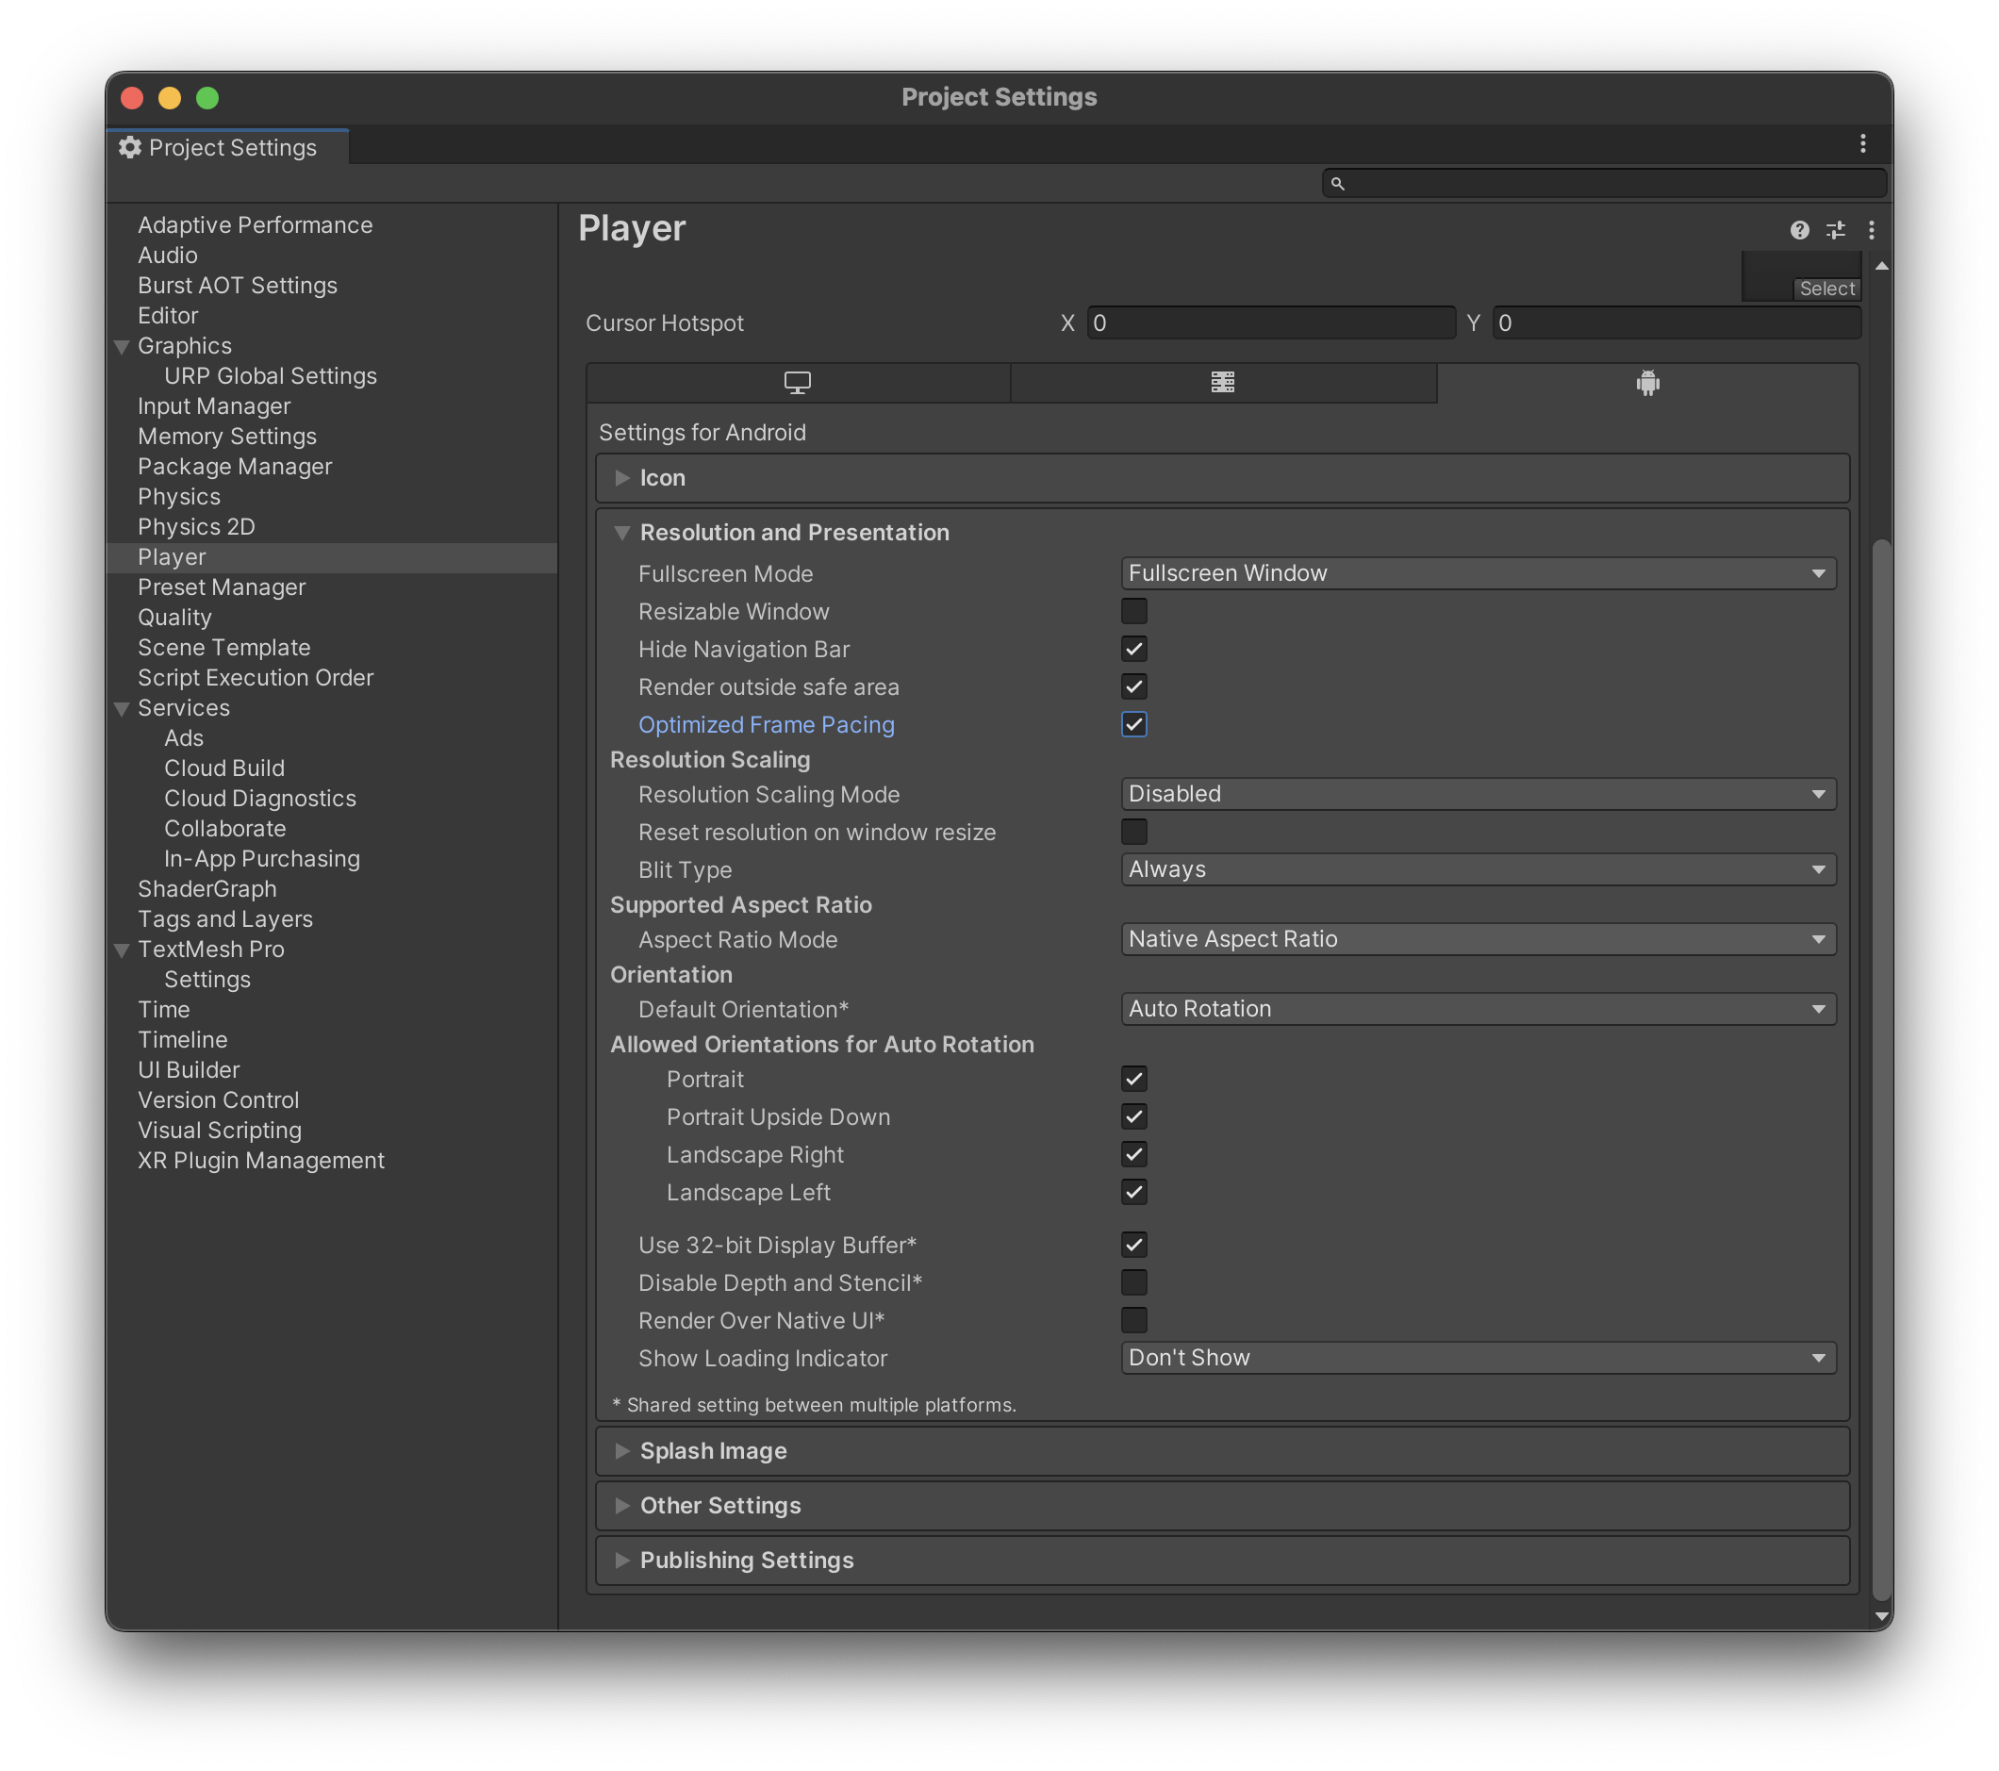
The Android Frame Pacing library helps you render smoothly when your application takes longer to present the next frame than the screen refresh rate demands. For Unity versions 2021 and later, enabling Android frame pacing sets the display refresh rate to the best match for the target frame rate. This ensures the game doesn't waste battery power on unnecessary display updates.
To enable the library, in Project Settings > Player, under Settings for Android, check the Optimized Frame Pacing checkbox.
Vulkan API
Vulkan is a cross-platform, high-performance 3D graphics API that has low overhead compared with OpenGL ES. Unity can use Vulkan in two different ways.
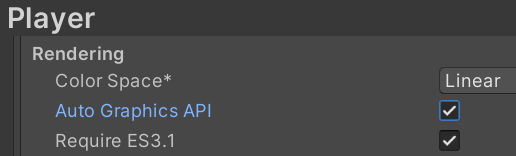
Auto Graphics API
You can use the Auto Graphics API with Vulkan, but this can have different behaviors depending on the Unity version you have installed. You can select this by navigating to Project Settings > Player > Rendering.
Keep the following considerations in mind when choosing which Unity version to use:
- Unity 2021.1 and earlier versions do not support Vulkan with the Auto Graphics API. Unity tries to use OpenGL ES 3.2. If the device doesn't support OpenGL ES 3.2, Unity falls back to OpenGL ES 3.1, 3.0, or 2.0, in that order.
- Unity 2021.2 and later versions use Vulkan first. If the device doesn't support Vulkan, Unity falls back to OpenGL ES 3.2, 3.1, 3.0, or 2.0.
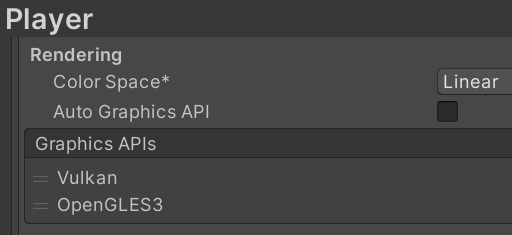
Manual graphics APIs
Alternatively, you can enable Vulkan manually by disabling Auto Graphics API. If you are using Unity 2021.1 or a previous version, this is the only way to use Vulkan.
If Vulkan is ordered higher in this list than OpenGL ES, Unity first tries to use Vulkan. If the device does not support Vulkan, Unity runs with OpenGL ES. See Get started with Vulkan for detailed information about Vulkan on Android, such as how to use modern graphics APIs and optimize your game's performance.
Draw calls
Everything displayed on screen is associated with one or more draw calls. On mobile platforms, you should optimize and reduce the number of draw calls that you send to the graphics processing unit (GPU).
Think of draw calls as similar to cars lined up at a traffic light. After the light turns green, a certain number of cars can pass through before the light changes. When the light turns yellow, you've reached your ideal target frame time (21 milliseconds), and when the light turns red, you've hit the 33 millisecond frame time limit. Anything past that impacts the next render frame, so the resulting frame rate is lower than your target 30fps.
For information about how to improve the draw call performance in your game, see the batching article from Unity Support.
Shadows
Shadow casting draw calls can be the most GPU-intensive, consuming most GPU time even for simple environments. To reduce the cost of shadow casting draw calls, experiment with using hard instead of soft shadows. If this is still too costly on GPU for low-end devices, consider using blob shadows instead of hard shadows.
Texture
The recommended texture compression format for RGB and RGBA textures on Android is ASTC. In Unity, the minimum texture compression option you should use on Android is ETC2. You can fall back to ETC2 as your backup from ASTC under Unity Build Settings.
Find a full list of supported formats by platform in the Unity documentation at Manual: Recommended, default, and supported texture formats, by platform.
User interface and aspect ratios
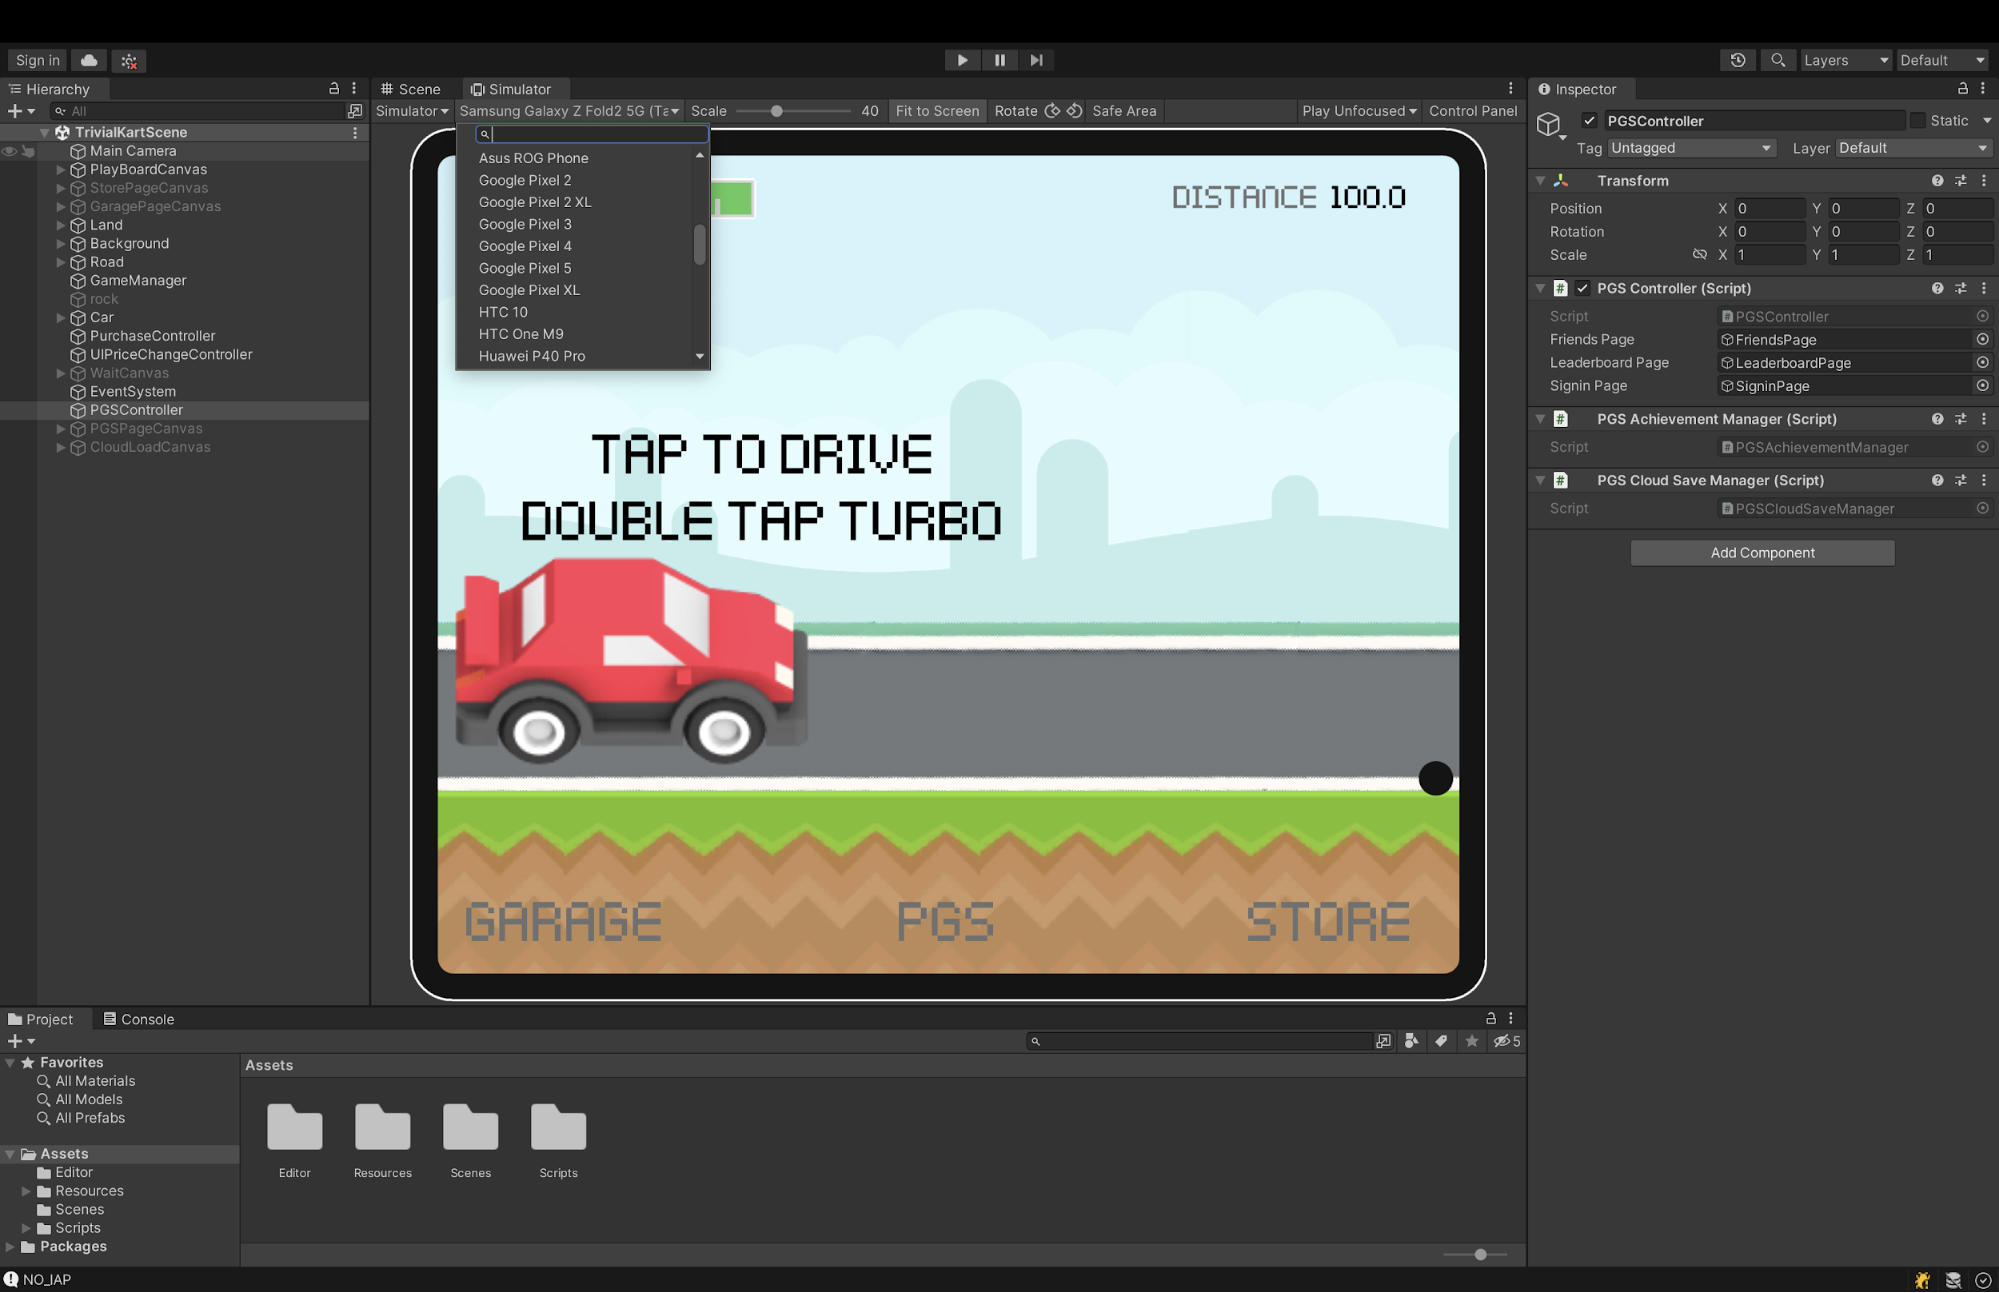
You can use the Unity Device Simulator tool to preview various device screen resolutions, orientations, and aspect ratios directly in the Unity Editor. You can toggle between Game view and Device Simulator view.
See a preview of the tool at Simulate your Game with Device Simulator in Unity!.
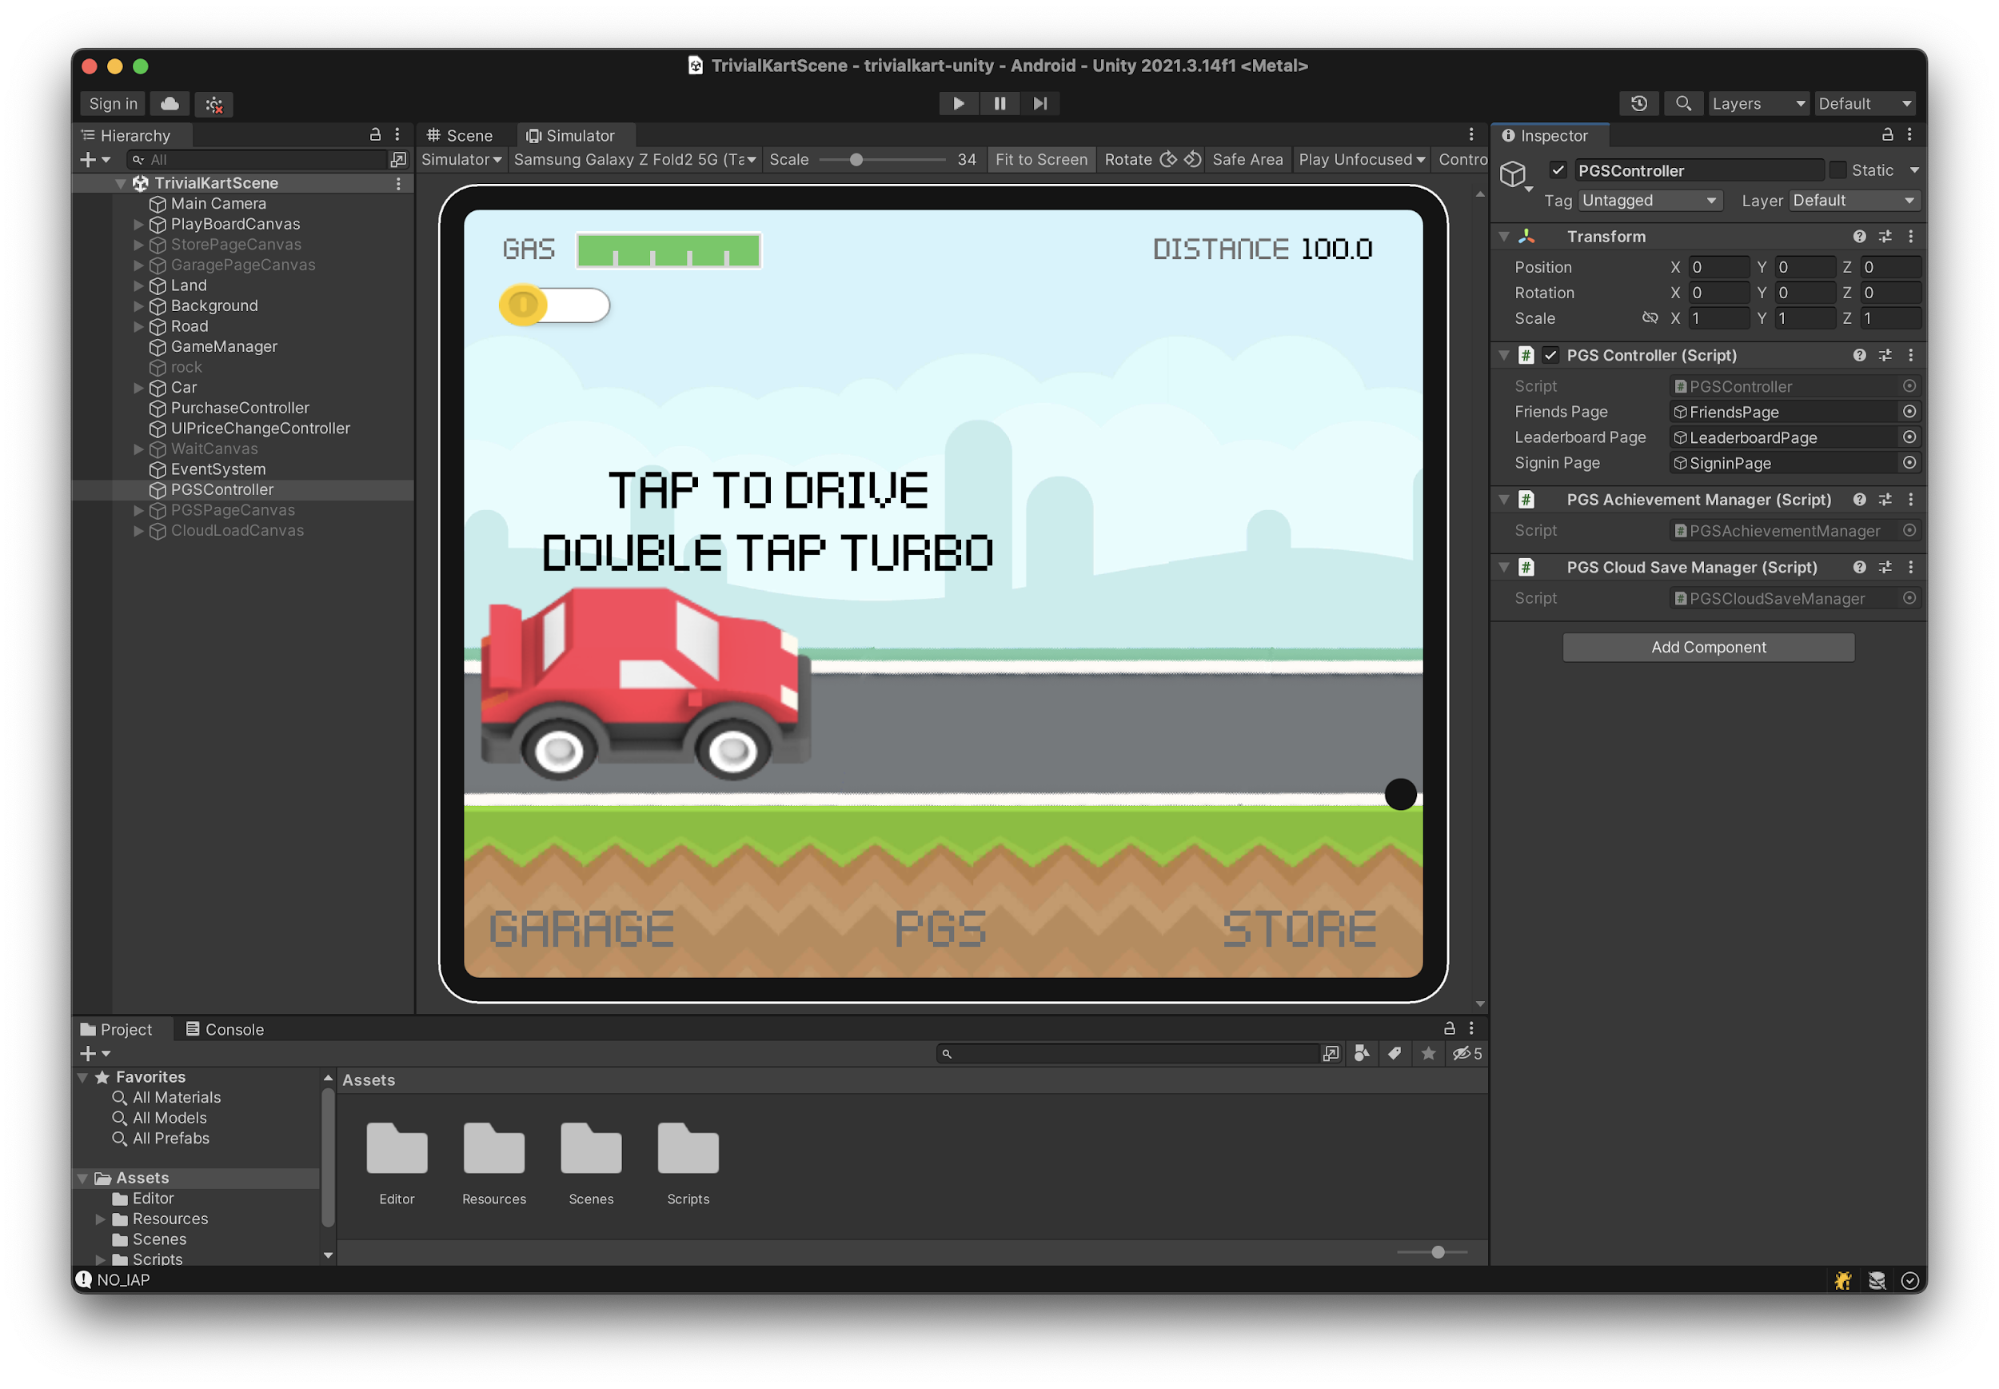
You can find the Trivial Kart source code in the games-samples repository on Github.
You can quickly verify the layout and correctness of the UI canvas elements in Device Simulator view by selecting device options in the drop-down menu:
For more UI optimization techniques for Unity, see the following tutorial from Unity: Optimizing Unity UI.
Physics
The Nvidia PhysX engine is built in to Unity. The default settings can be expensive on mobile, so keep the following considerations in mind:
- Consider your target frame rate and set the fixed timestep accordingly. The default is set to 0.02ms or 50Hz. You can increase it to 0.03 or higher for a 30fps target.
- Consider simplifying mesh colliders and minimizing the Layer Collision Matrix for determining interactions between game objects of specific layer types.
For information about physics settings and optimizations for mobile games, see the Optimize Your Mobile Games eBook from Unity.
Profile
App developers often overlook or ignore profiling until the application reaches a critical failure point. It's a good idea to schedule dedicated profiling time into your process, and to use the following best practices:
- Identify key points during development when you can allocate profiling time, rather than fitting it in at random.
- Save profile snapshots to use with the Unity Profile Analyzer.
- Profile your game on target devices to get an accurate picture of how your game performs at the current stage of development.
- Profile different parts of your game.
- Profile how your players play the game. (Don't profile your game only when it's sitting in an idle state or on a pause screen.)
- Profile in sustained mode after the game has been running for awhile to help find throttling issues that you might encounter when the mobile devices are hot.
You can use the following profiling tools separately or in combination.
Unity Profiler The Unity Profiler is a fully integrated performance analysis tool that can run against your code in the Unity Editor and connect to your standalone Android device running development-mode builds.
Android GPU Inspector With the Android GPU Inspector (AGI) you can perform frame-level debugging. AGI also analyzes the system services, including GPU, CPU, memory, battery, and GPU counters.
For details about profiling your game in Unity, watch the video Introduction to profiling in Unity or read the Ultimate guide to profiling Unity games, both from Unity.
Memory management
Android processes share the available memory on the target device. You should profile memory usage when the target testing device has ample free memory resources. Perform memory tests at a consistent point in your game so that you can compare sessions and memory usage trends appropriately.
When you work in scripts written in C#, be cautious with the use of strings, string comparisons, and allocations of string-related objects (such as JSON files for game settings). These generate frequent memory allocations and can contribute to fragmentation.
Consider using the
StringBuilder
class for large sequences of string manipulation, over in-place concatenation of
strings (such as "this" + "is" + "a" + "bad" + "idea" versus
StringBuilder.Concat() function calls).
For more information about strings, see Strings and text in the Unity documentation.
Evaluate TextAsset and JSON text resources against the preferential
ScriptableObject type. ScriptableObjects handle cross-scene data storage
efficiently and allow for Editor-to-Play time modifications.
For a discussion about using alternatives to the default JSON handle for mobile optimization, see the article The hidden optimization in network games on Hutch.
Use the Memory Advice API to determine what your memory usage looks like at runtime. The API exposes a stoplight indicator for high, normal, and low memory usage. You can subscribe to the indicator for updates or, poll it directly for current status. When you get a red signal, consider reducing your game object pool or cache. Include this context in your game telemetry during live operations and review of performance metrics after launch.
For a deeper dive into memory organization on Android devices and how Unity works with it, watch Understanding Android memory usage (from Google I/O '18). The video walks through the types of memory issues and when the low memory killer takes effect.
Garbage collection
Garbage collection in a managed memory environment cleans up unused memory fragments that can be recycled for an application. Follow garbage collection best practices to avoid unnecessary allocations of memory resources.
For example, create a game object pool rather than using on-demand
allocations (GameObject.Instantiate). For large pools, consider
allocating over multiple frames to reduce the risk of your game being
unresponsive on entry-level Android devices.
Consider the following code snippet for a simple coroutine that is invoked from the beginning of a MonoBehaviour:
// Option 1: Bad for memory management - causes allocation each iteration
IEnumerator UpdateEnemyTarget() {
  while (enabled) {
    yield return new WaitForSeconds(1.0f);
    // Some intermittent function check
  }
}

// Option 2: Better for memory management - allocation of yield instruction once, reused each iteration
private YieldInstruction waitForSecond = new WaitForSeconds(1.0f);
IEnumerator BetterUpdateEnemyTarget() {
  while (enabled) {
    yield return waitForSecond;
    // Some other intermittent function
  }
}
You can
edit
the MonoBehaviour template file to remove the default Start() and
Update() stub functions so that you don't inadvertently leave empty
functions as you develop.
For an overview of the order of execution of MonoBehaviour events, see Order of execution for event functions in the Unity documentation. To learn more about memory management, see the course Memory Management in Unity.
For mobile game performance optimization tips, see Optimize your mobile game performance: Tips on profiling, memory, and code architecture from Unity's top engineers.
Prefab pooling
CPU frame time spikes are almost entirely caused by Prefab instantiation during gameplay. Consider prewarming object pools for projectiles, spawnable enemies, and visual effects before entering gameplay to reduce or eliminate the startup CPU spikes. You can spread out additional optimizations over multiple "initialization frames" during loading or introduction sequences in your scene.
You can find many third-party pooling assets on the Unity Asset Store related to game object pooling management. You can also create your own. See Introduction to Object Pooling on Unity Learn.
Asset delivery
There are limits to how large your application can be when it is first deployed to Google Play. Depending on the size and nature of your game, you might need some or all of your game resources (character models, environments, UI elements, and so on) in order for players to have the experience you intend.
You can use the Play Asset Delivery (PAD) service to manage assets that your game requires at install-time, fast follow, or on-demand. Unity Asset Bundles are integrated to support PAD, and you can use the tool to specify which elements are delivered.
Addressables
Setting up dynamic resources – such as prefabs, textures, and sound files – at runtime is no longer a complex operation if you prepare and review the Addressables naming system. Addressable assets decouple how you arrange your content from how you build and load your content. The Addressables system replaces Resources folders and Asset Bundles to simplify how you reference assets and load them at runtime.
For an example, see the Demo project using Addressables package on GitHub. For details about the development of Addressables, see the Addressable Asset System on the Unity Blog.
With Addressable asset layout, there are advantages and disadvantages to bundling too few or too many assets into common bundles. To learn more about content management with Addressables, see Simplify your content management with Addressables.
You can set up a
standalone demo and experiment with the modes of access to get
comfortable with the Addressables system. You can also see the open source project
BuildLayout Explorer for Unity 2019.3 and newer,
and inspect the buildlayout.txt report generated by
Addressables.
The assets for Chop Chop, a Unity Open Project, were packaged using the Addressables system for all loading and unloading. See Packaging content with Addressable Assets | Open Projects Devlog for a walkthrough of the structure and setup of configuring the Addressables bundles.
In the Chop Chop project, the only scene loaded by default, the Initialization
scene, was configured to use AssetReferences instead of direct links to assets
in the project (scenes, prefabs, and so on).
The source code for the Unity Open Project: Chop Chop is available at GitHub. Although the project is no longer in development, the git repo and documentation is still available.
Third-party plugins
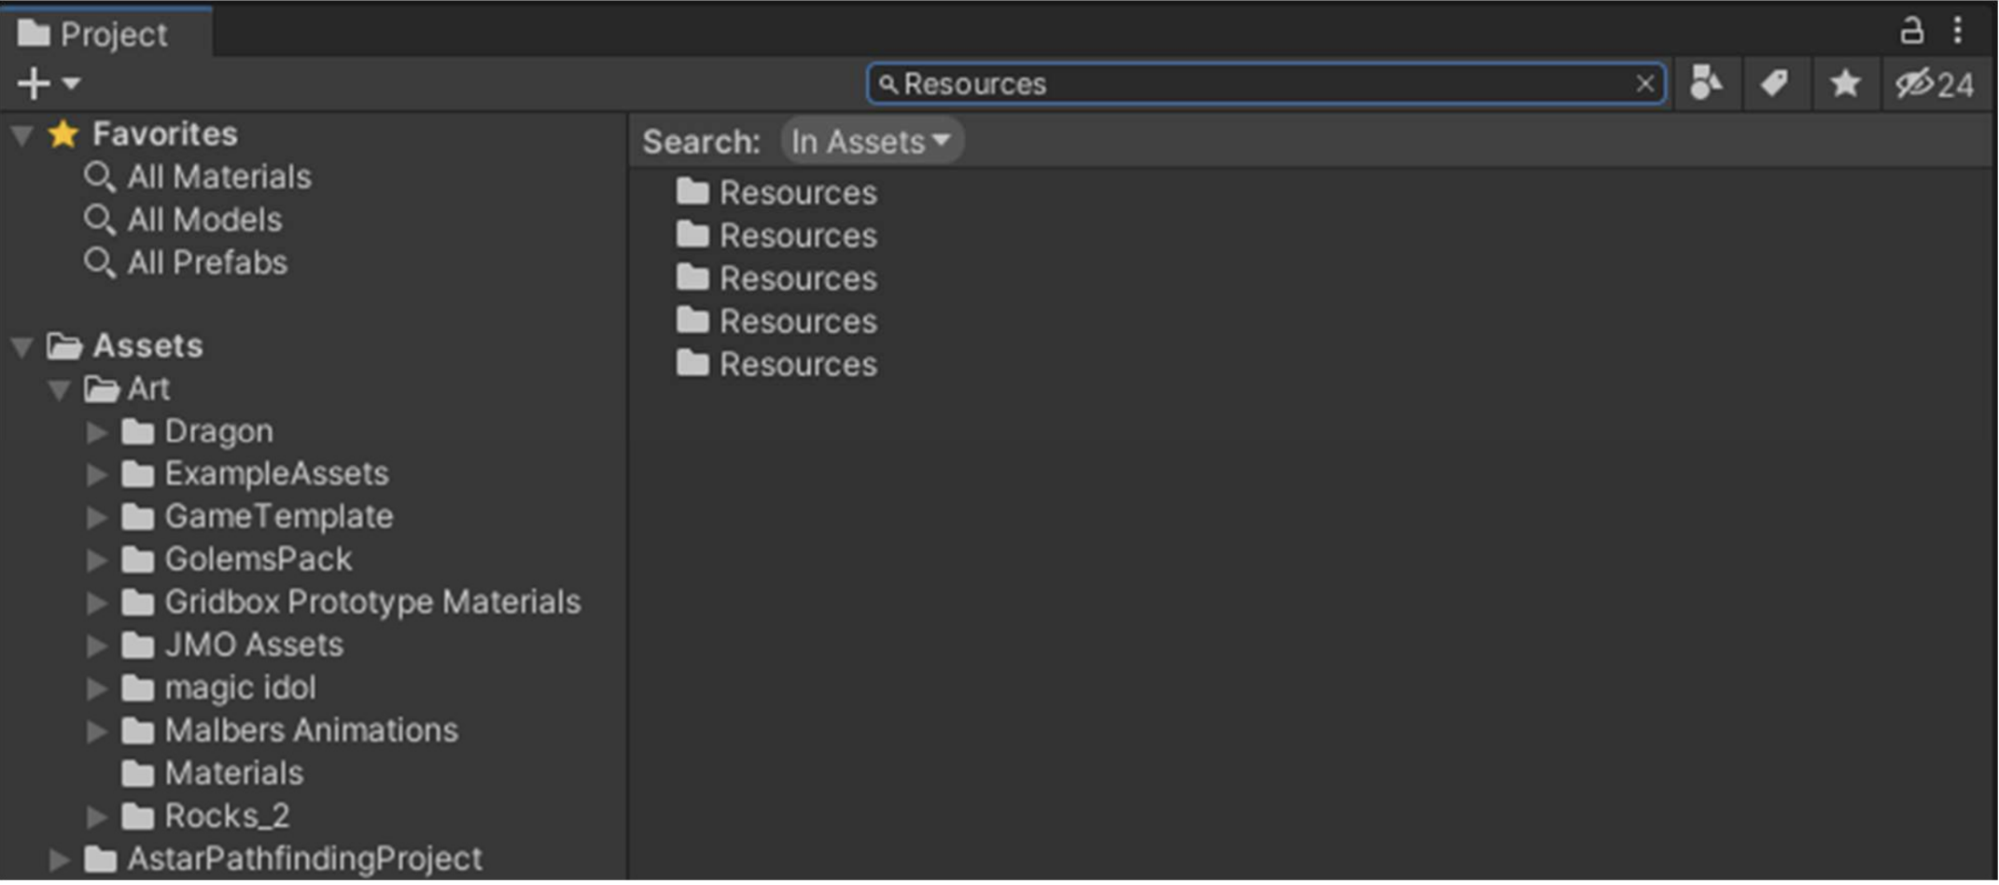
If you use third-party plugins, such as those in the Unity Asset Store, make sure you review the folders and remove unnecessary assets from Resources folders. During the build process, Unity collects all assets that are included in Resources folders and packages them in a single bundle that is accessible at runtime. This can add bloat to the final package, and is often not needed.
To quickly locate all resources folders, search for Resources in the Project panel. You can then select each one to identify what it contains and whether it is necessary for your game.
Publish and maintain
When you are ready to launch your mobile game, decide who you want to release to, how to do alpha and beta testing, and how to monitor and track performance after launch.
Analyze feedback from a limited release
You can launch to a limited, targeted audience and perform larger-scale beta testing, or activate your game for full availability in all markets. With a limited release, you can tune your application performance based on a wider live audience and collection of devices.
For example, you can use Android Performance Tuner for Unity and Google Analytics for Unity to get insights about your application performance and trends of players, from which your development team can tune and push updates. You might also use your analytics data to plan sequels or related games in a similar genre.
Alpha and beta test
After you set up your application profile in Google Play Console, you can prepare public alpha and beta test builds and distribute them to a limited audience for pre-launch review. By launching to a limited audience, you can work out any final issues with a larger pool of devices and gather initial feedback that you can respond to before going live in a global release.
Your Unity builds are distributed through Android App Bundles. For information, see the Manual: Delivering to Google Play from Unity, which also describes the changes from APK files to the AAB format.
Monitor and track
During the liveops and distribution phase of your game, you can use Android Vitals to help track down performance issues on devices that you might not have had access to during development and testing. For details, watch What's new for games in Reach and devices and Android vitals.
Often larger development teams have unique and custom game telemetry pipelines that provide metrics related to device performance. Remember to take advantage of the Android Performance Tuner (APT) and the corresponding Unity plugin to dial-in metrics related to frame rates, graphical fidelity, loading time and loading abandonment. Follow the step-by-step guide in Integrating Android Performance Tuner into your Unity game.
The lifecycle of your game does not stop after you go live. Monitoring, maintaining, and responding to performance and feedback are critical to happy users, positive reviews, and ultimate adoption of your game across all markets.