An app's memory usage characteristics are a fundamental aspect of its performance. You can use the System Profiler to analyze these characteristics by looking at the available GPU counter information.
Adreno devices
On Adreno devices, start by first highlighting a period of time consistent with a single GPU frame as described in Estimate CPU and GPU frame processing times. Use the technique described on that page involving the usage of the GPU % Utilization or similar counter track for your frame time boundaries as the counter tracks all use the same timing technique and will allow for more accurate estimates of memory utilization (compared to using the frame time boundaries derived from the GPU slices whose data is collected independently from the counter track data).
Read/write totals
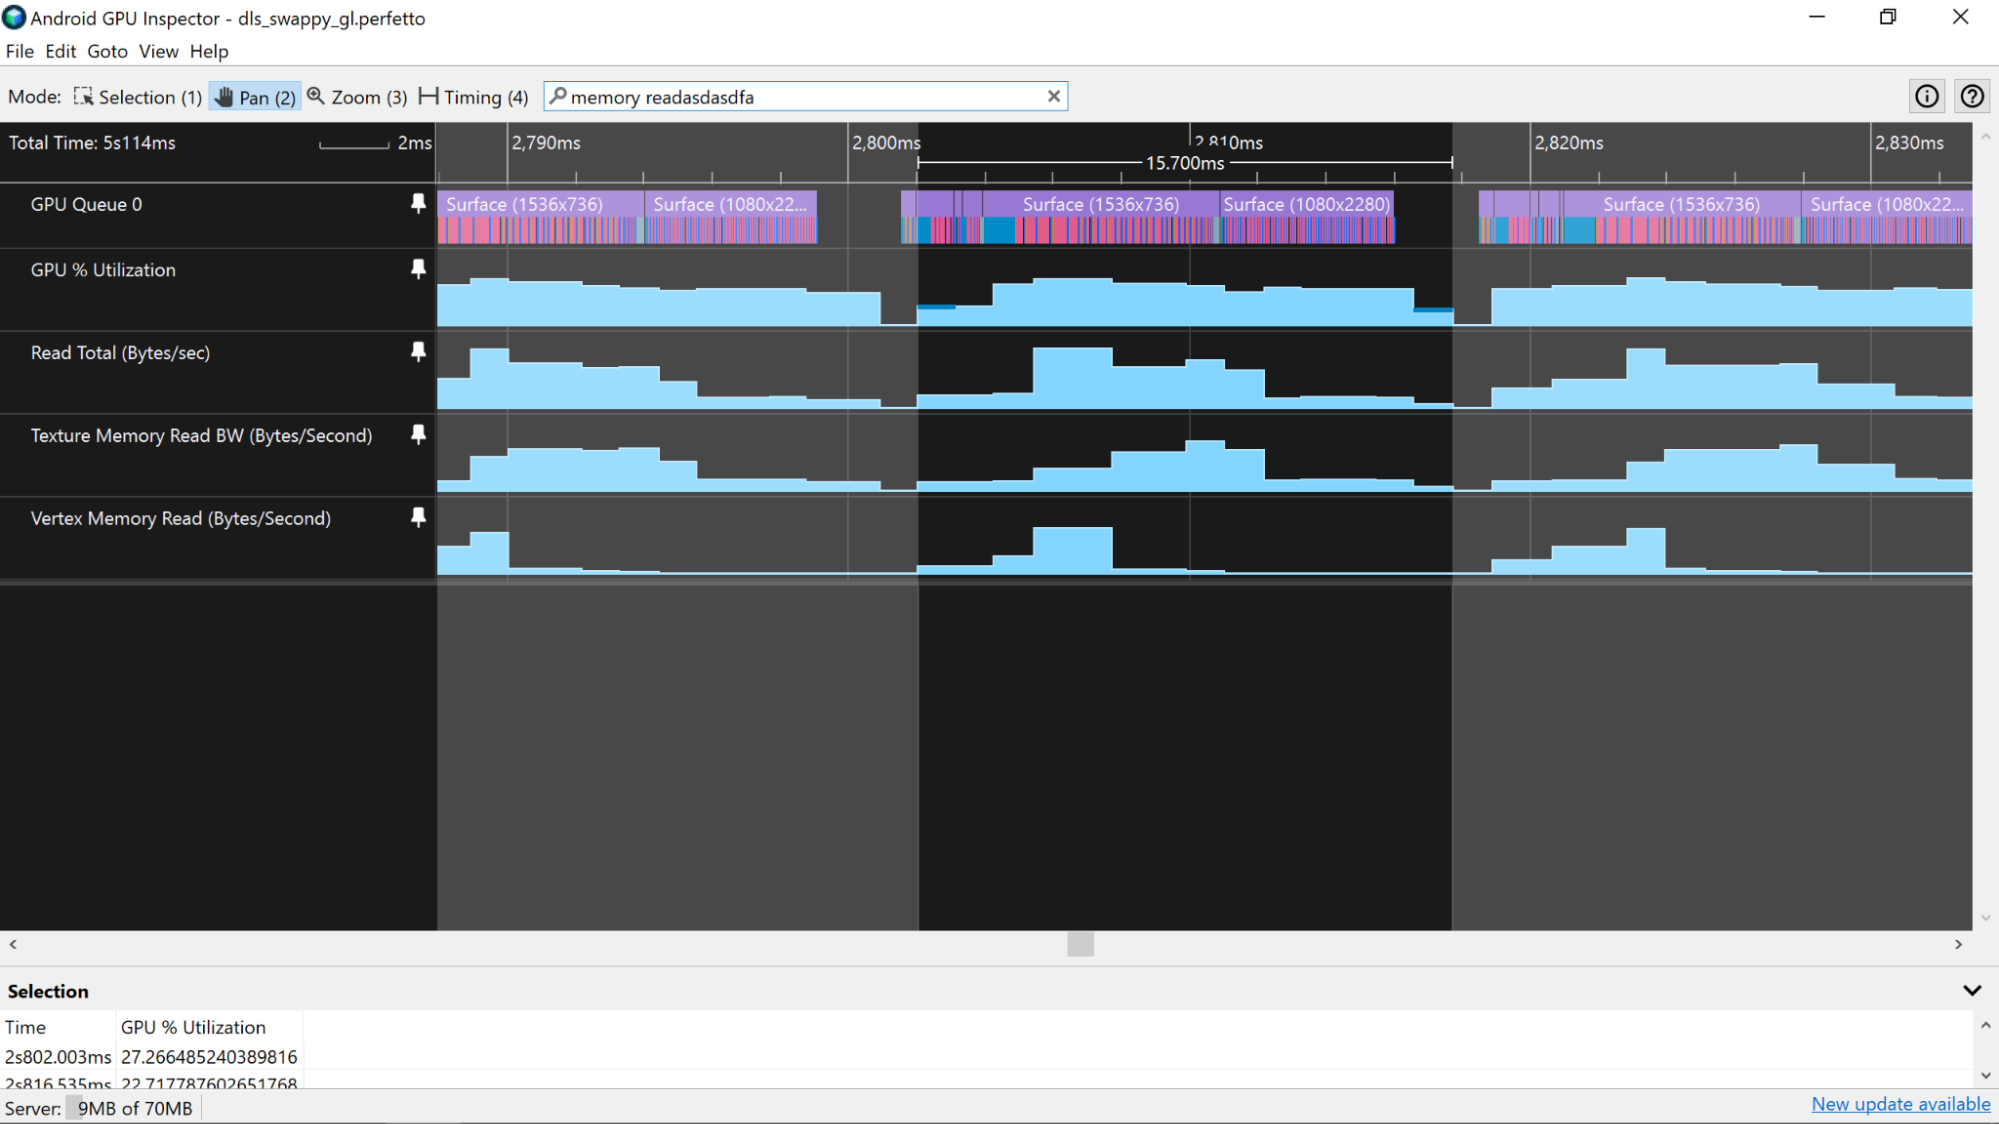
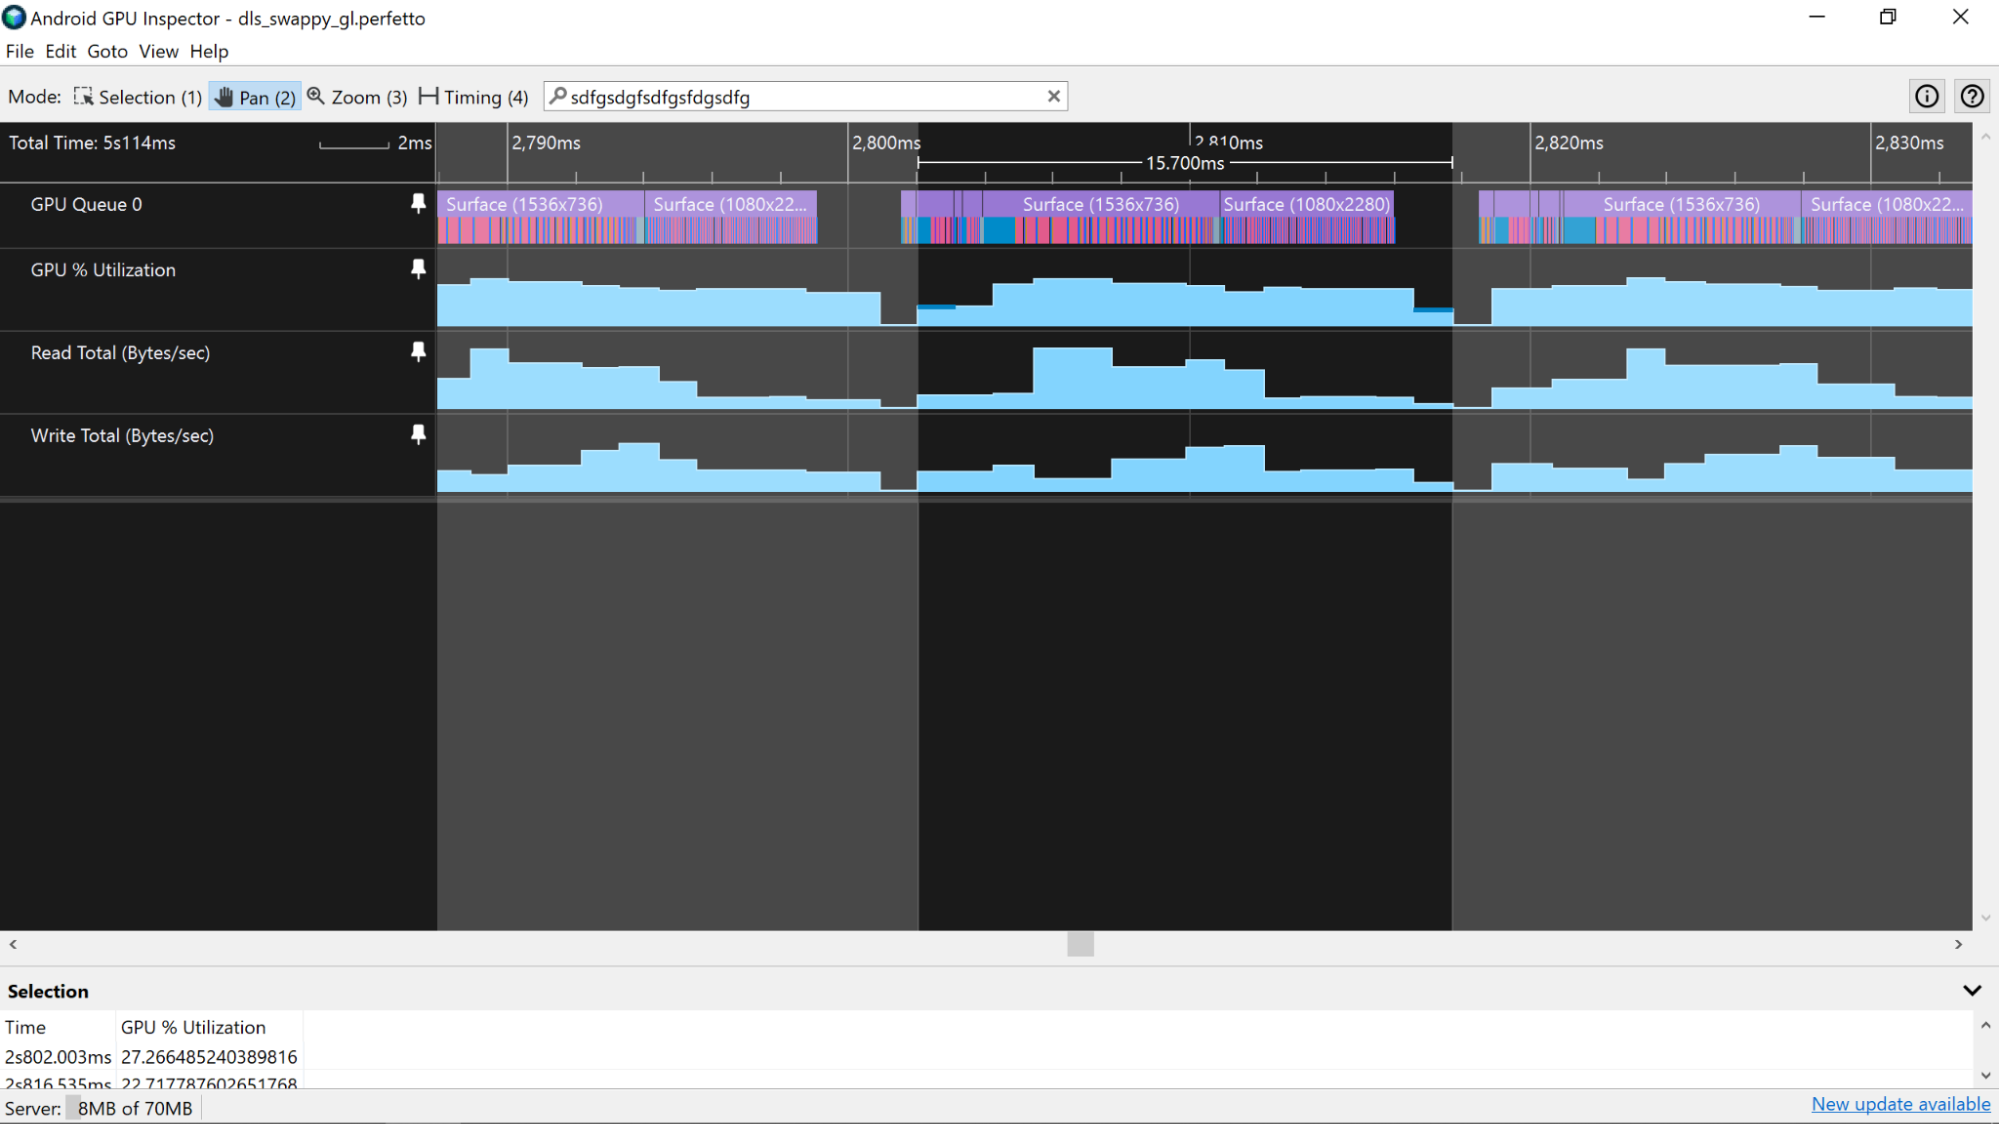
Once you’ve highlighted a single frame in the profiler, start by looking at the Read Total (Bytes/sec) and Write Total (Bytes/sec) counters. These counters provide a good overall look at how much data is crossing the memory bus over the course of a single frame. Do your best to minimize the amount of data that you send over the bus, since memory bandwidth is a large source of battery drain on mobile devices.
You can also examine the Vertex Memory Read (Bytes/Second) and Texture Memory Read (Bytes/Second) counters to determine the portion of the bandwidth used for vertex and texture data.
What you consider “good” for these values depends on the type of workloads seen in your app. For instance, 2D applications may see relatively large (~2+GB/s) amounts of texture memory read bandwidth being used, but the vertex memory bandwidth may be very minimal (~50MB/s). For more details, take a look at the documentation for Analyze vertex memory bandwidth and Analyze texture memory bandwidth usage.
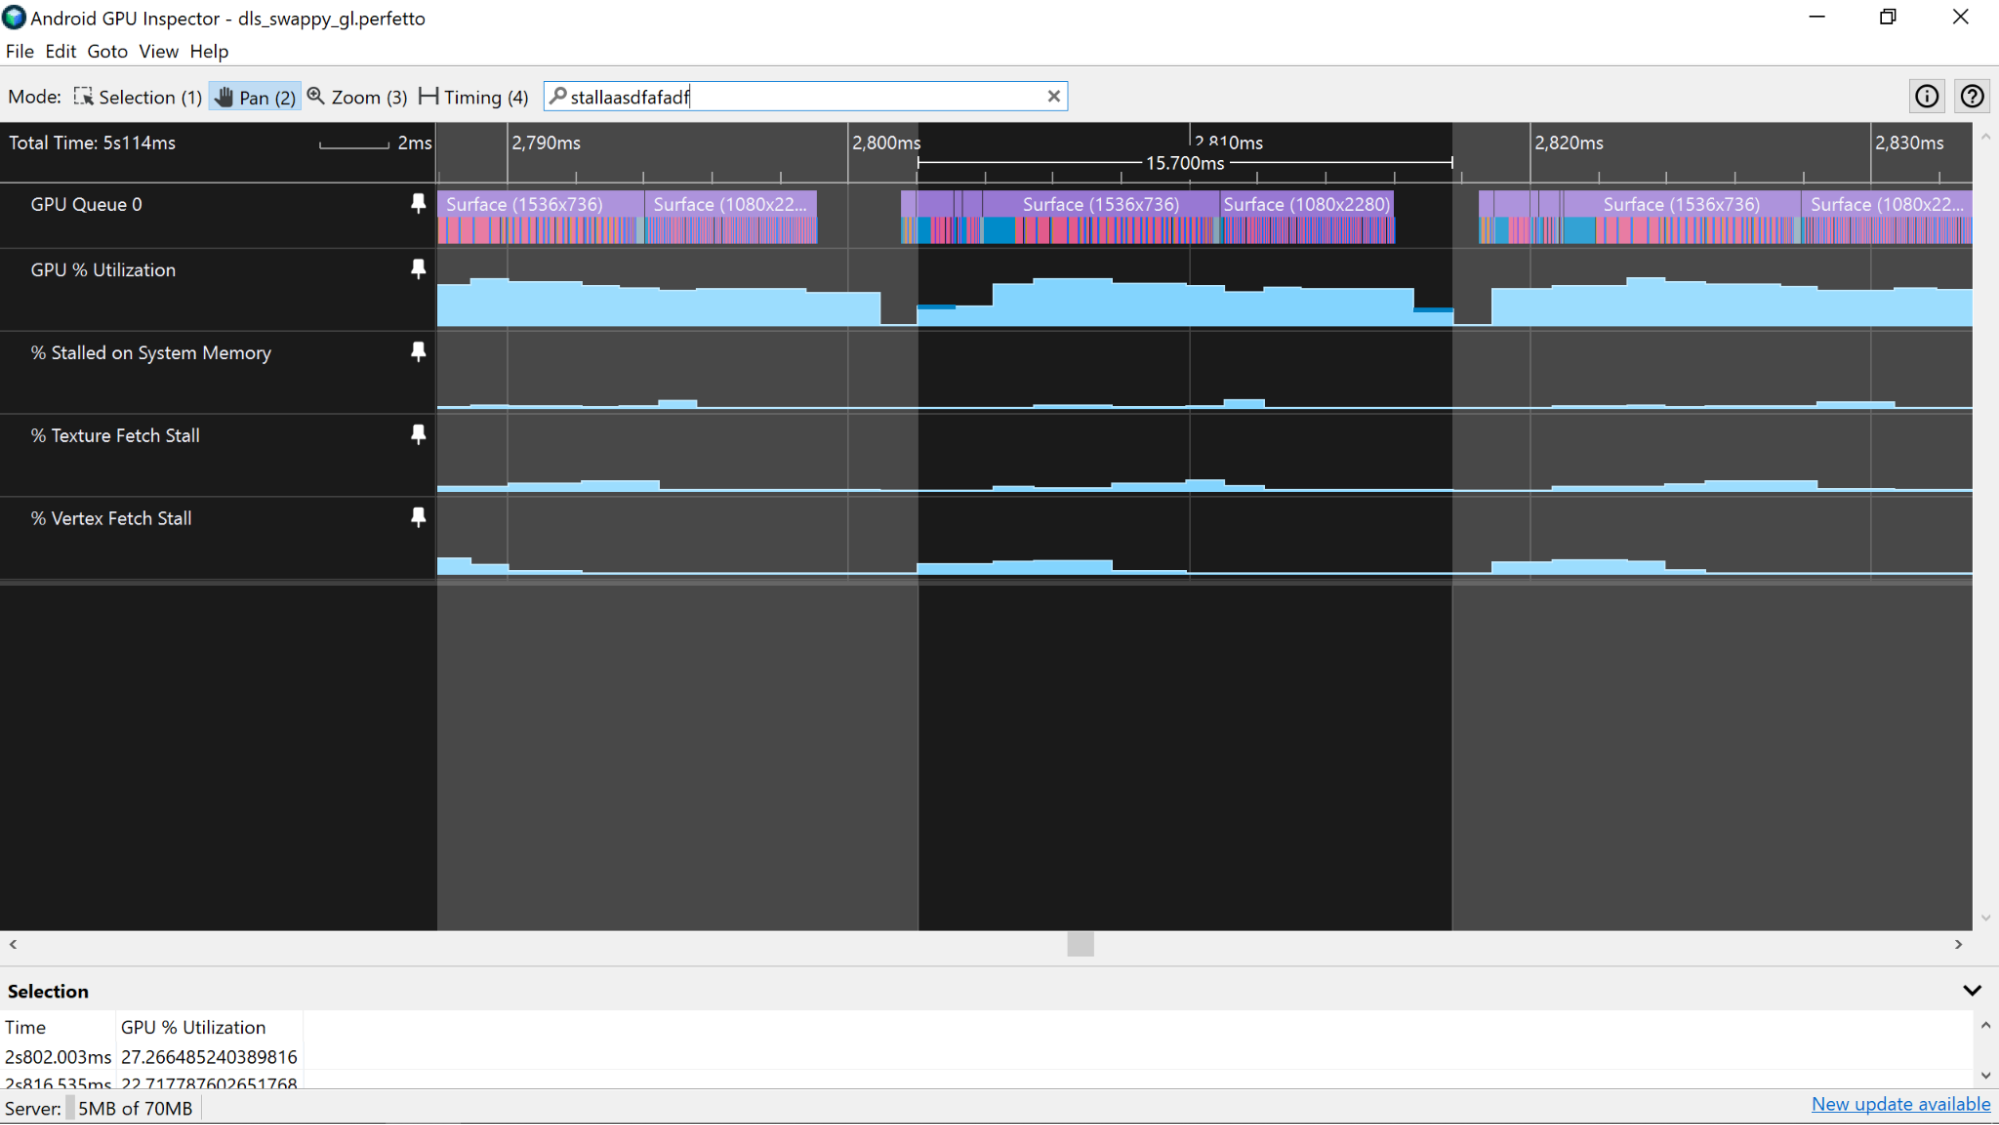
Fetch stalls
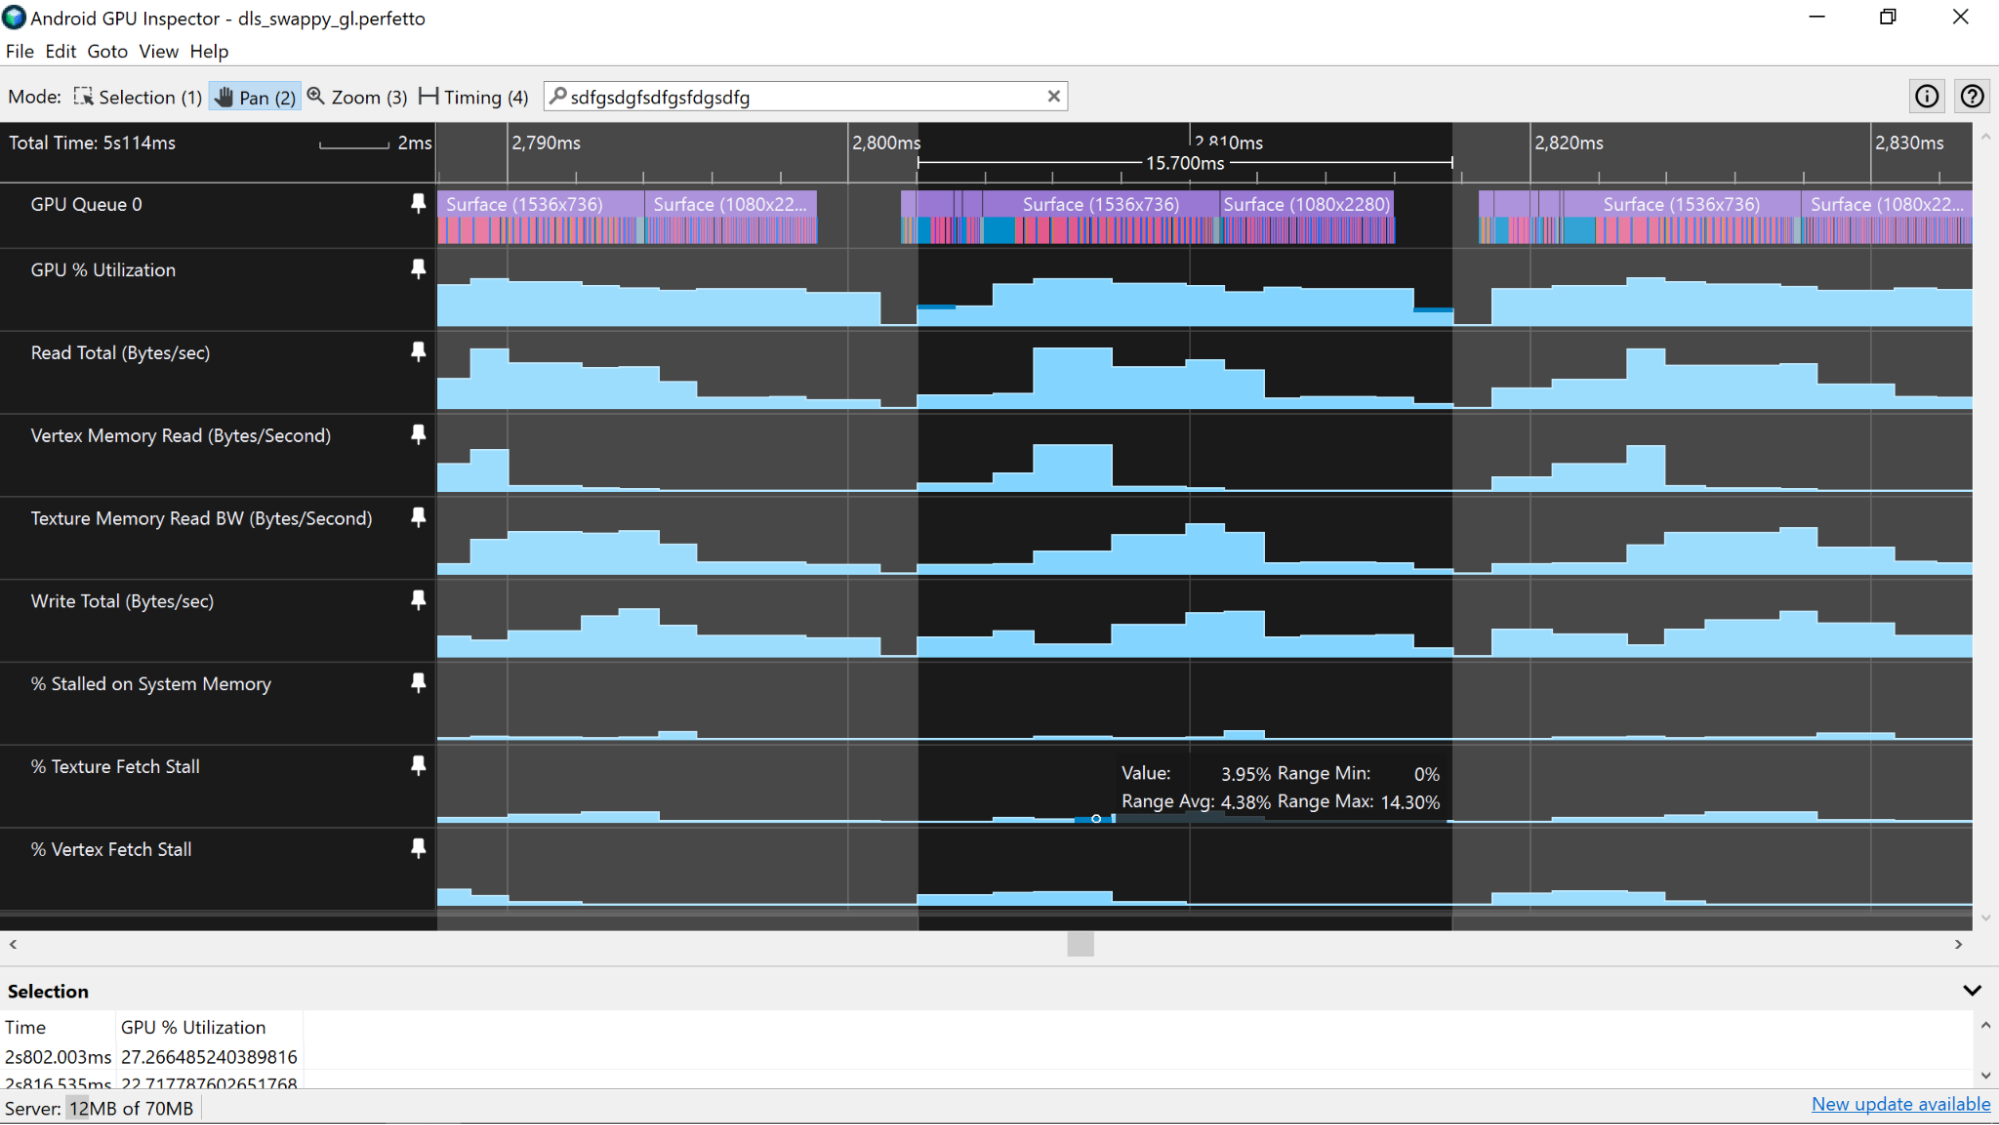
Look at the % Vertex Fetch Stall, % Texture Fetch Stall, and % Stall on System Memory counters since these will give you some hints to the overall memory performance of our application. If the values are higher than roughly 5%, this suggests that your app is either not laying out data in memory in an efficient way or is accessing its data in an efficient way to take advantage of the cache. Take a look at the Analyze vertex memory bandwidth and Analyze texture memory bandwidth usage for details on improving memory usage for these types of assets.
Mali devices
On Mali devices, start by first highlighting a period of time consistent with a single GPU frame as described in Estimate CPU and GPU frame processing times. Use the technique described on that page involving the usage of the GPU % Utilization or similar counter track for your frame time boundaries as the counter tracks all use the same timing technique and will allow for more accurate estimates of memory utilization (compared to using the frame time boundaries derived from the GPU slices whose data is collected independently from the counter track data).
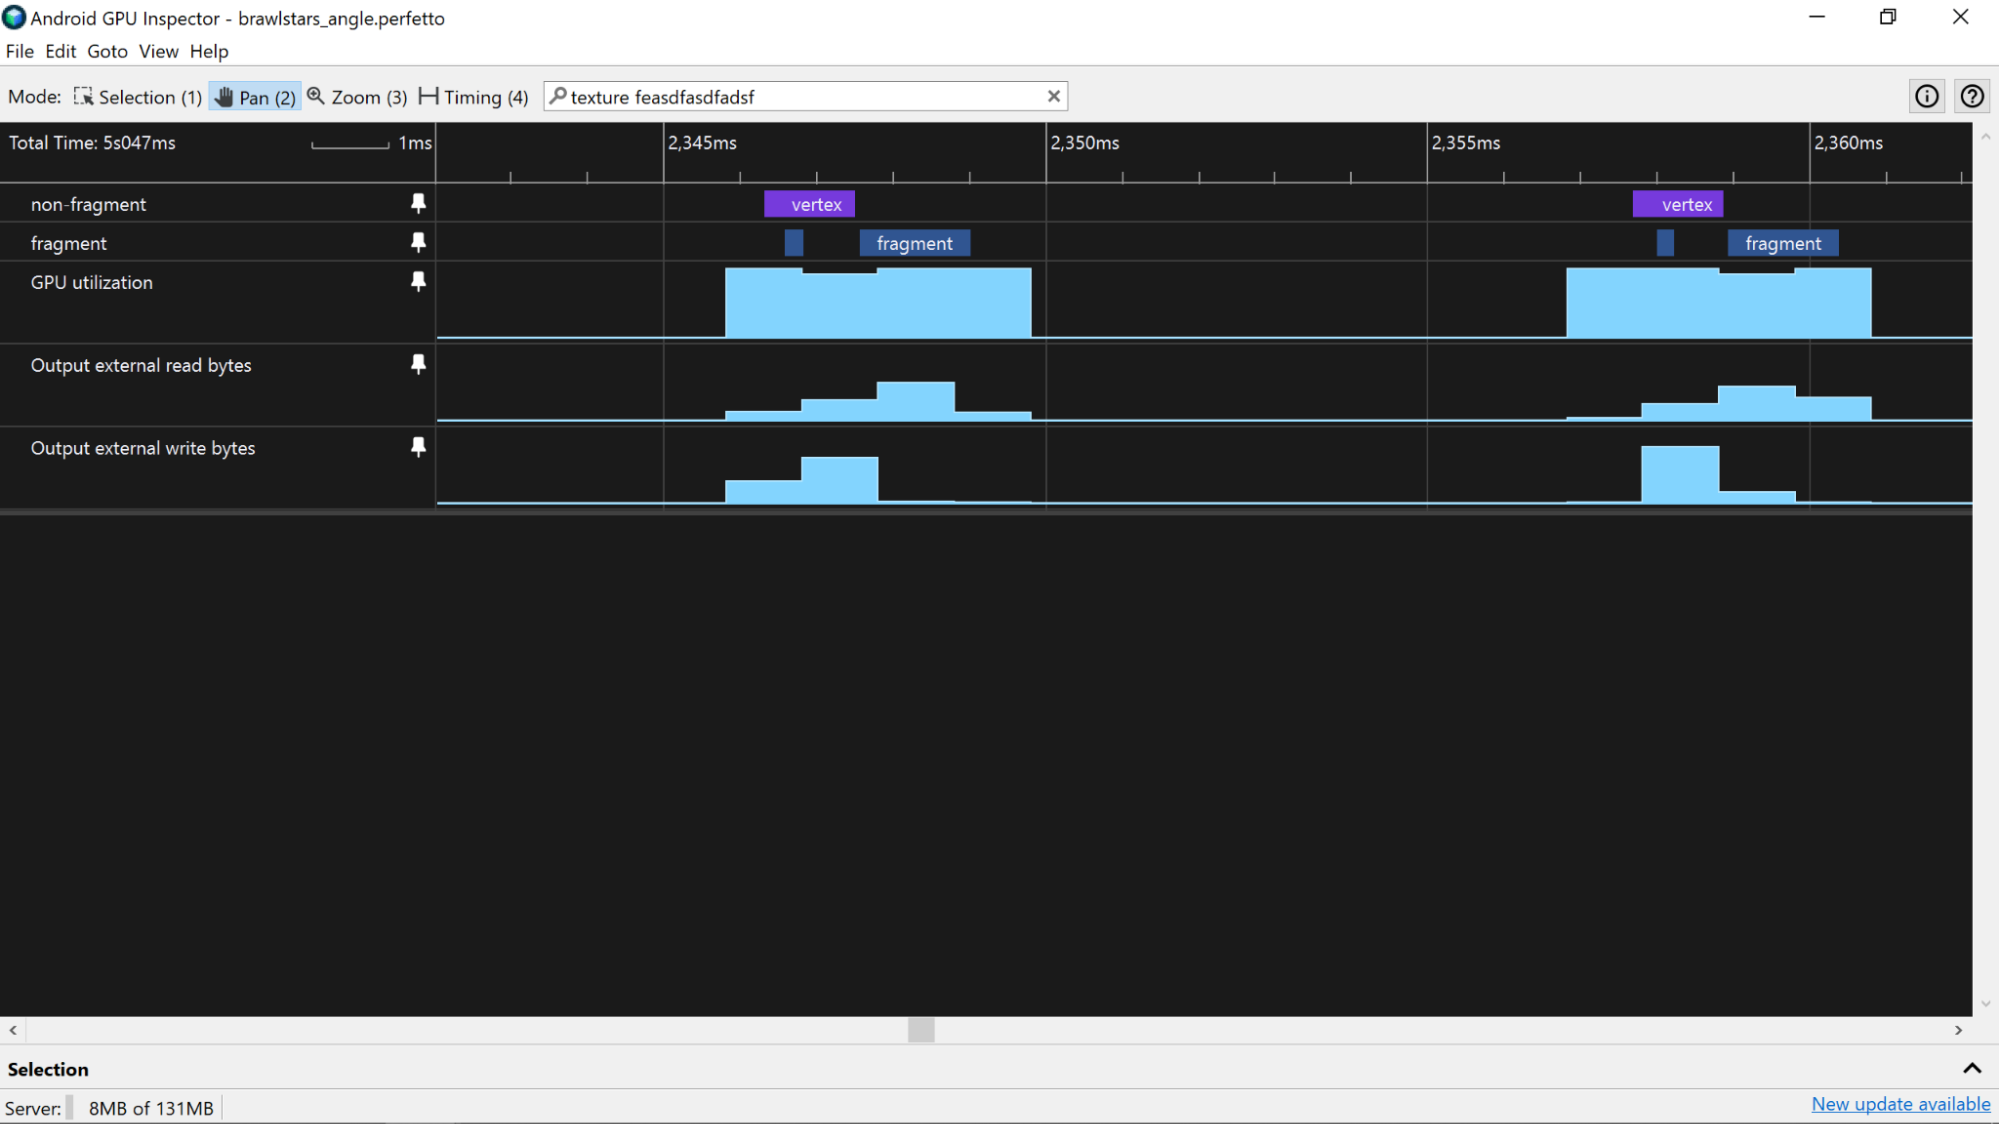
Output External Totals
After you’ve highlighted a single frame in the System Profiler, start by looking at the Output External Read bytes Output External Write bytes counters. These counters provide a good overall look at how much data is crossing the memory bus over the course of a single frame. Do your best to minimize the amount of data you send over the bus, since memory bandwidth is a large source of battery drain on mobile devices.
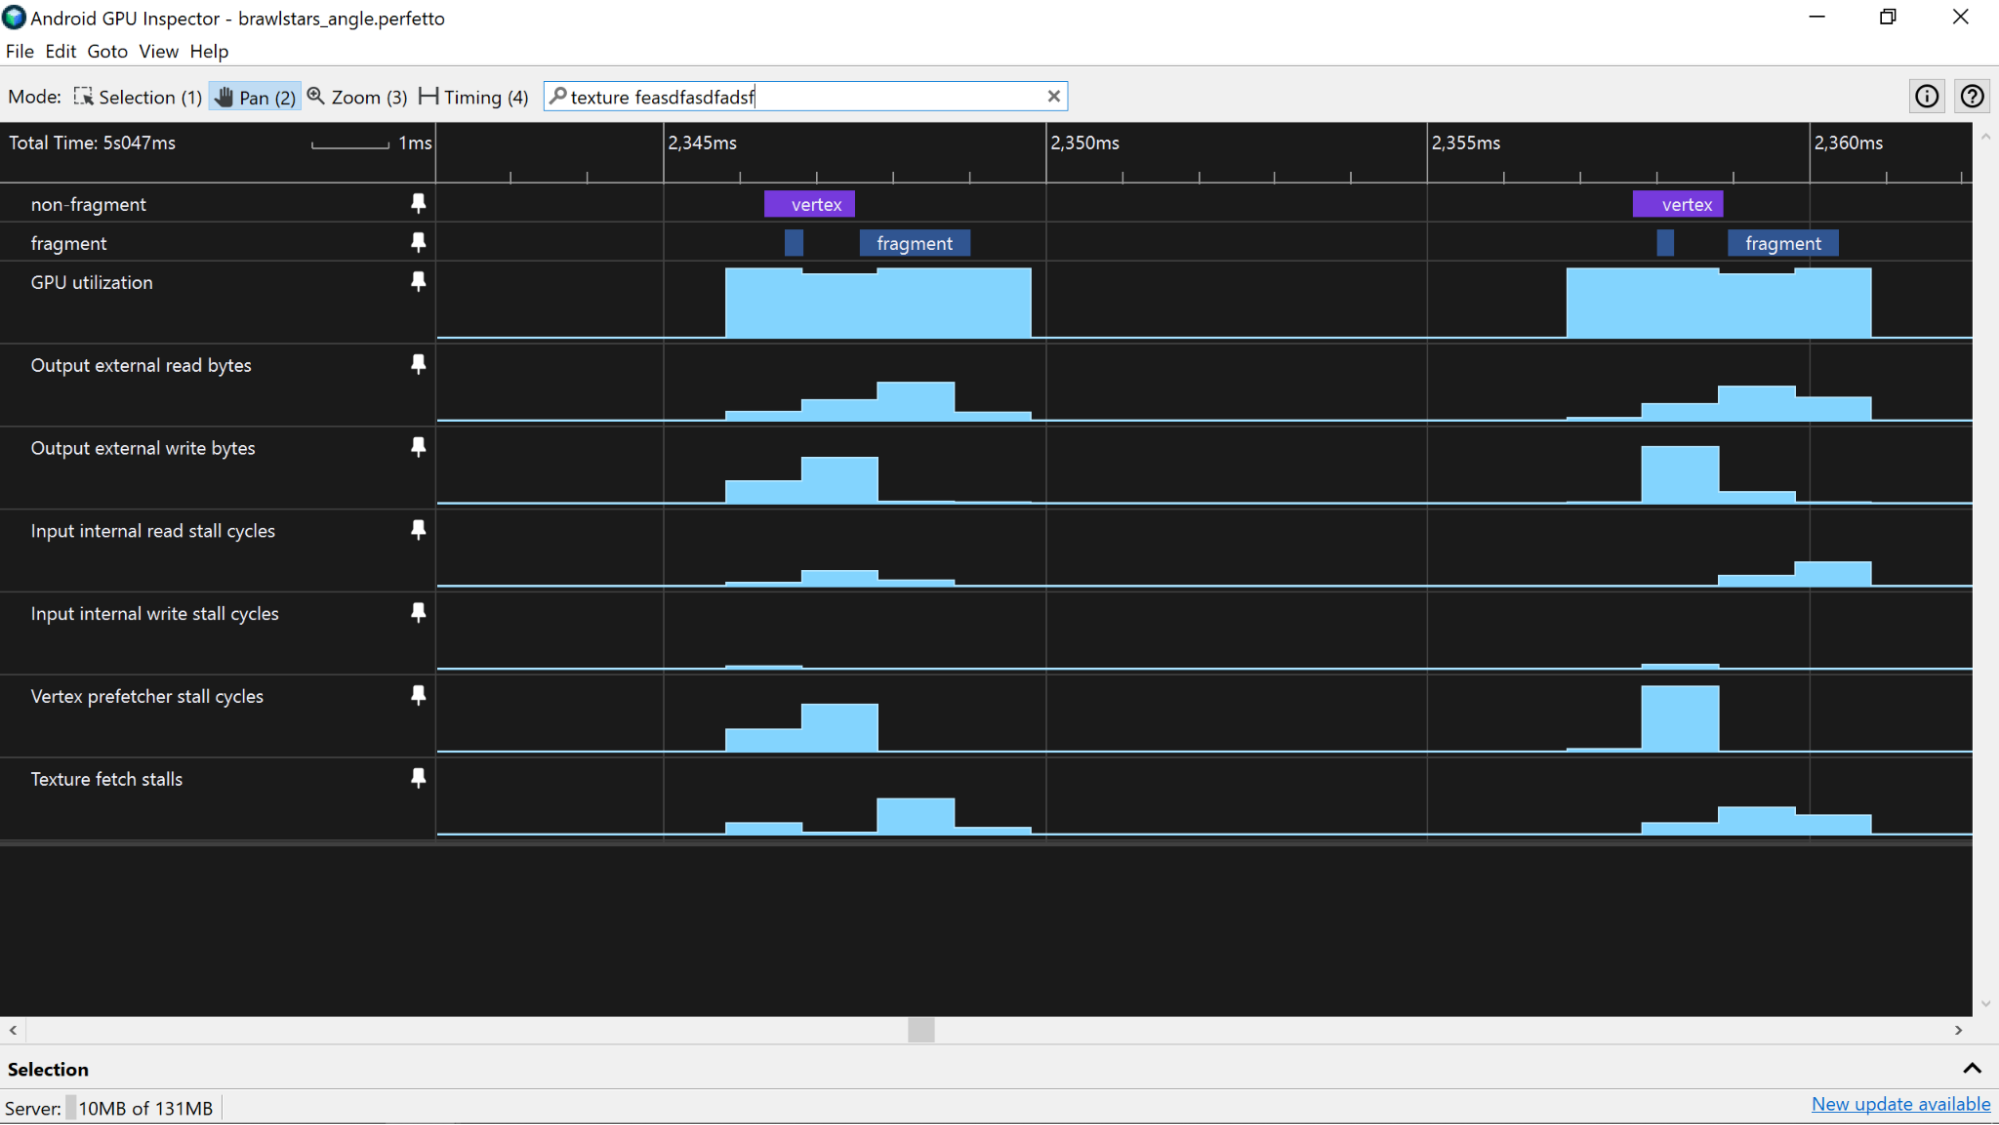
Input internal totals
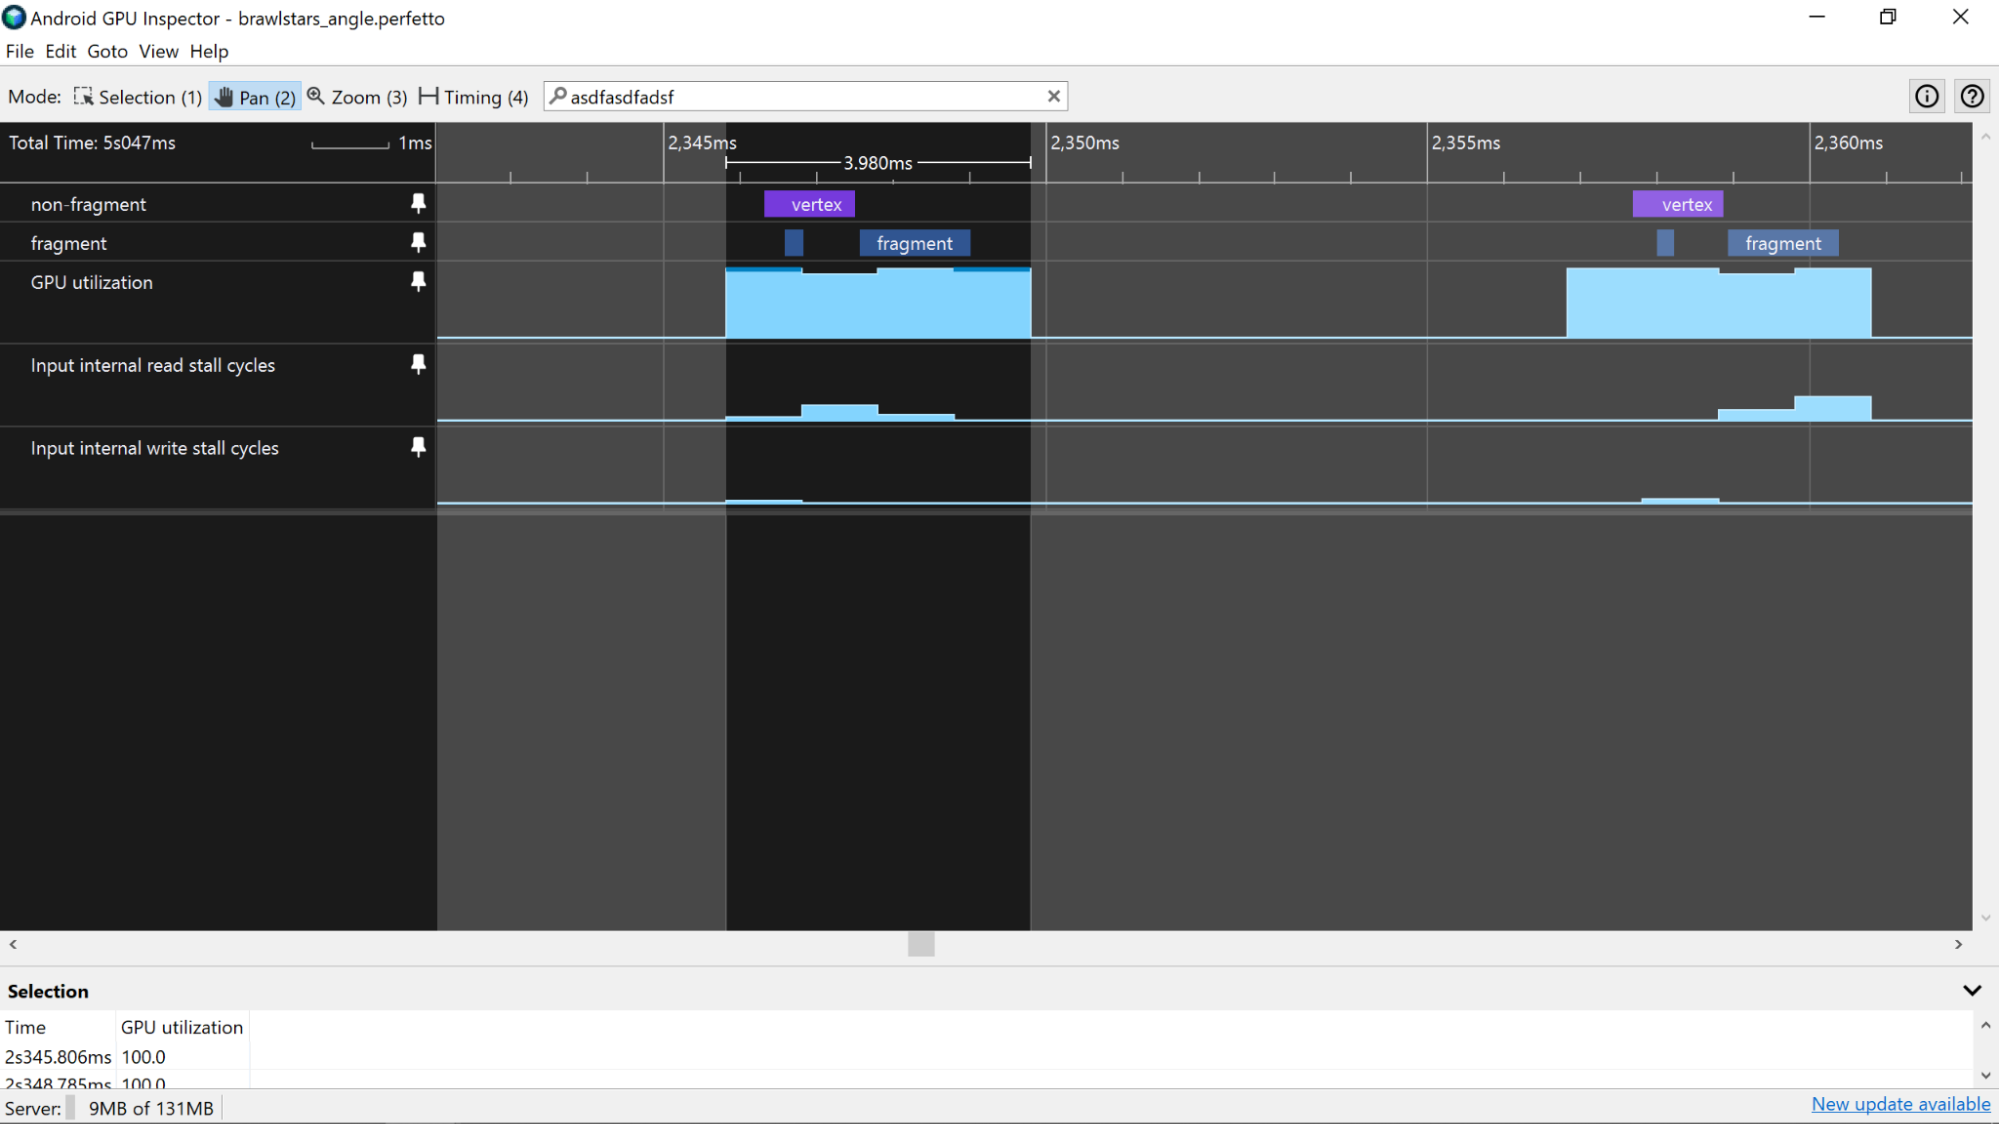
There are also counters that provide you with information about the caches themselves. The counters you are interested in are “Input internal [read|write] stall cycles”. Higher values for these mean that you are hitting the cache successfully but there are too many read requests being made and as a result shader code is stalling waiting to get access to memory.
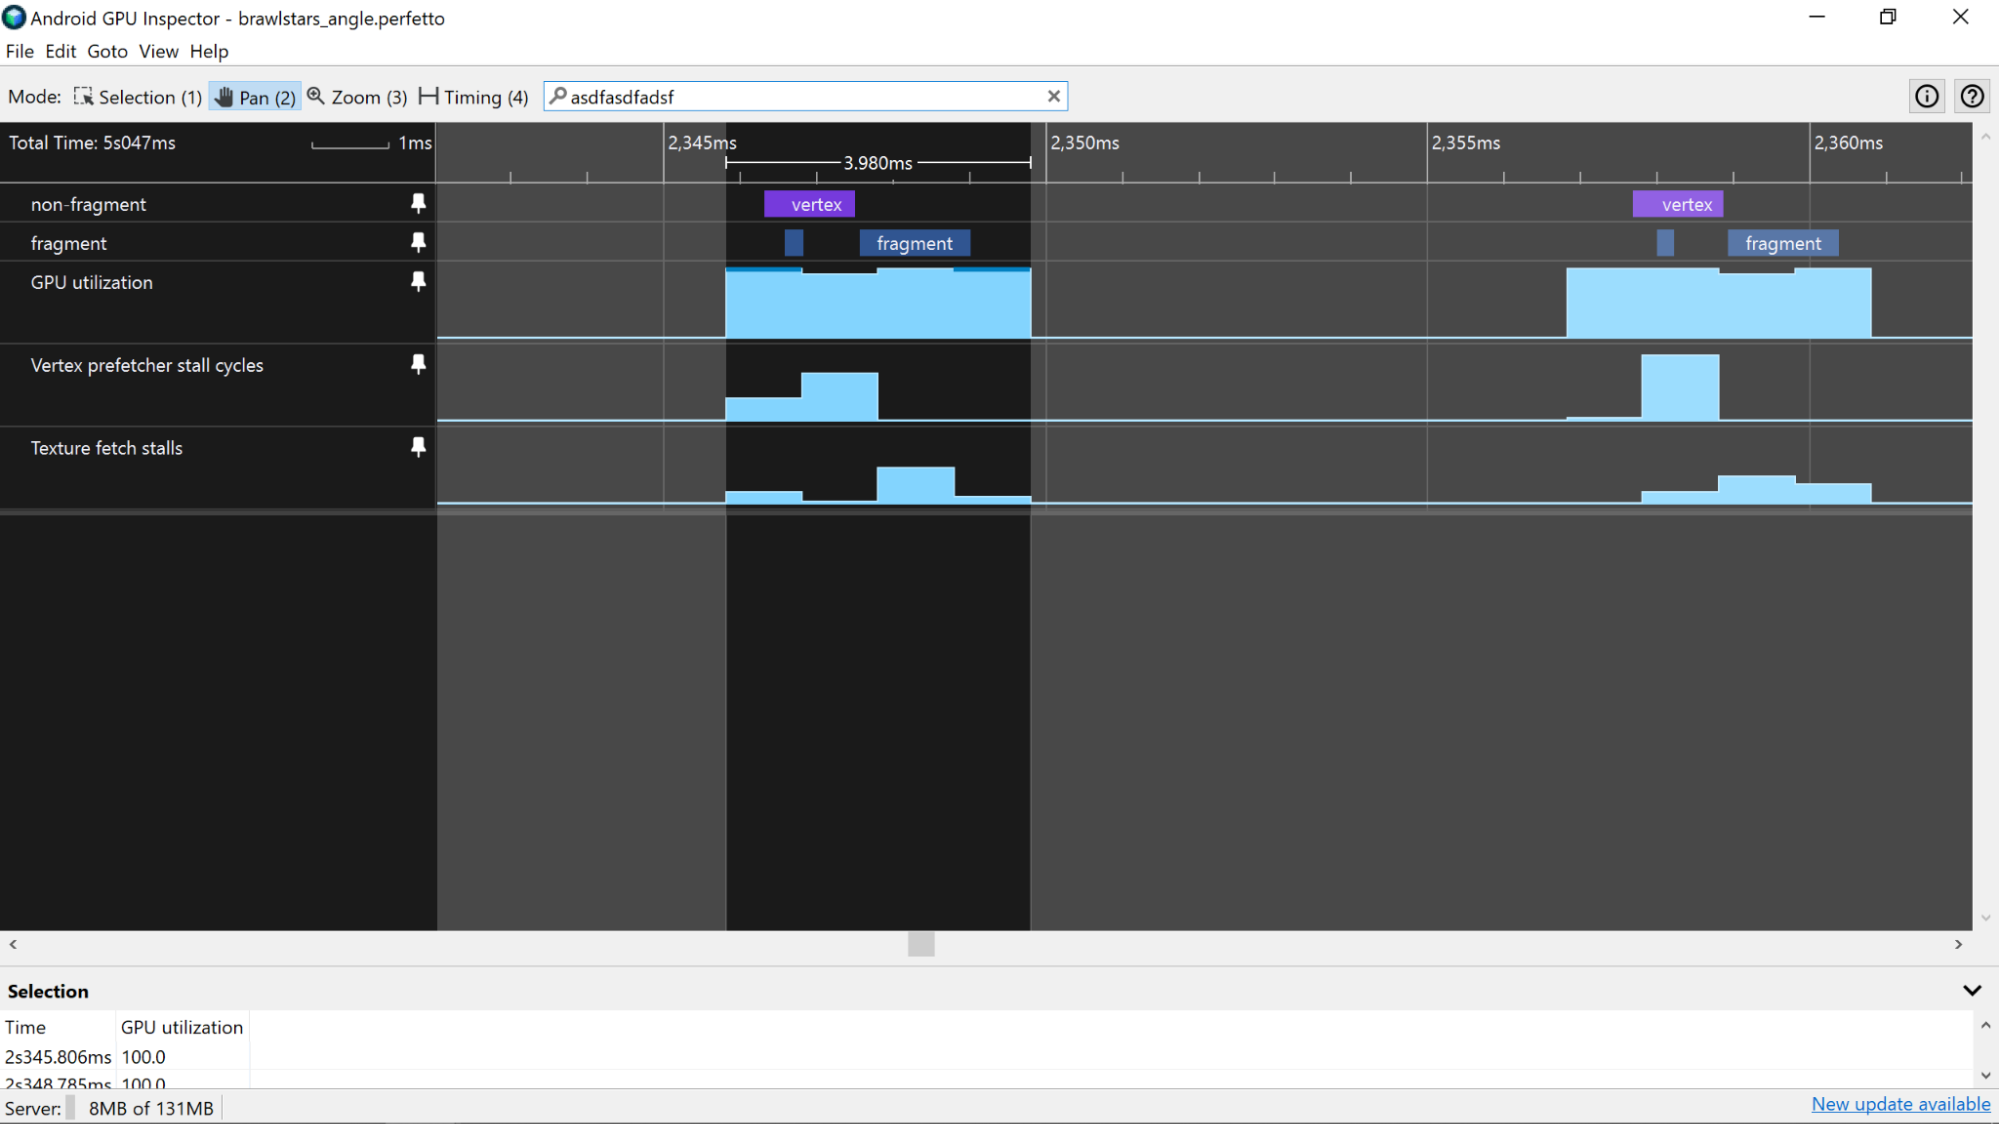
Fetch stalls
The next set of counters you can look at are the Vertex Prefetcher Stall Cycles and the Texture Fetch Stall counters as these will give you some hints to the overall memory performance of our application. If you are seeing values higher than ~5% this implies that you are either not laying out our data in memory in an efficient way or accessing our data in an efficient way to take advantage of the cache. Take a look at the Analyzing [Vertex|Texture] Memory Bandwidth articles for details on how to improve the memory usage for these types of assets