
Estimating CPU and GPU frame processing times (frame times) is essential for understanding your app's performance and locating bottlenecks. When you profile an app with AGI, System Profiler provides trace data that you can use to estimate frame times.
CPU times
In AGI, you can view the total and active CPU frame times in the CPU track of a system profile.
Total CPU time
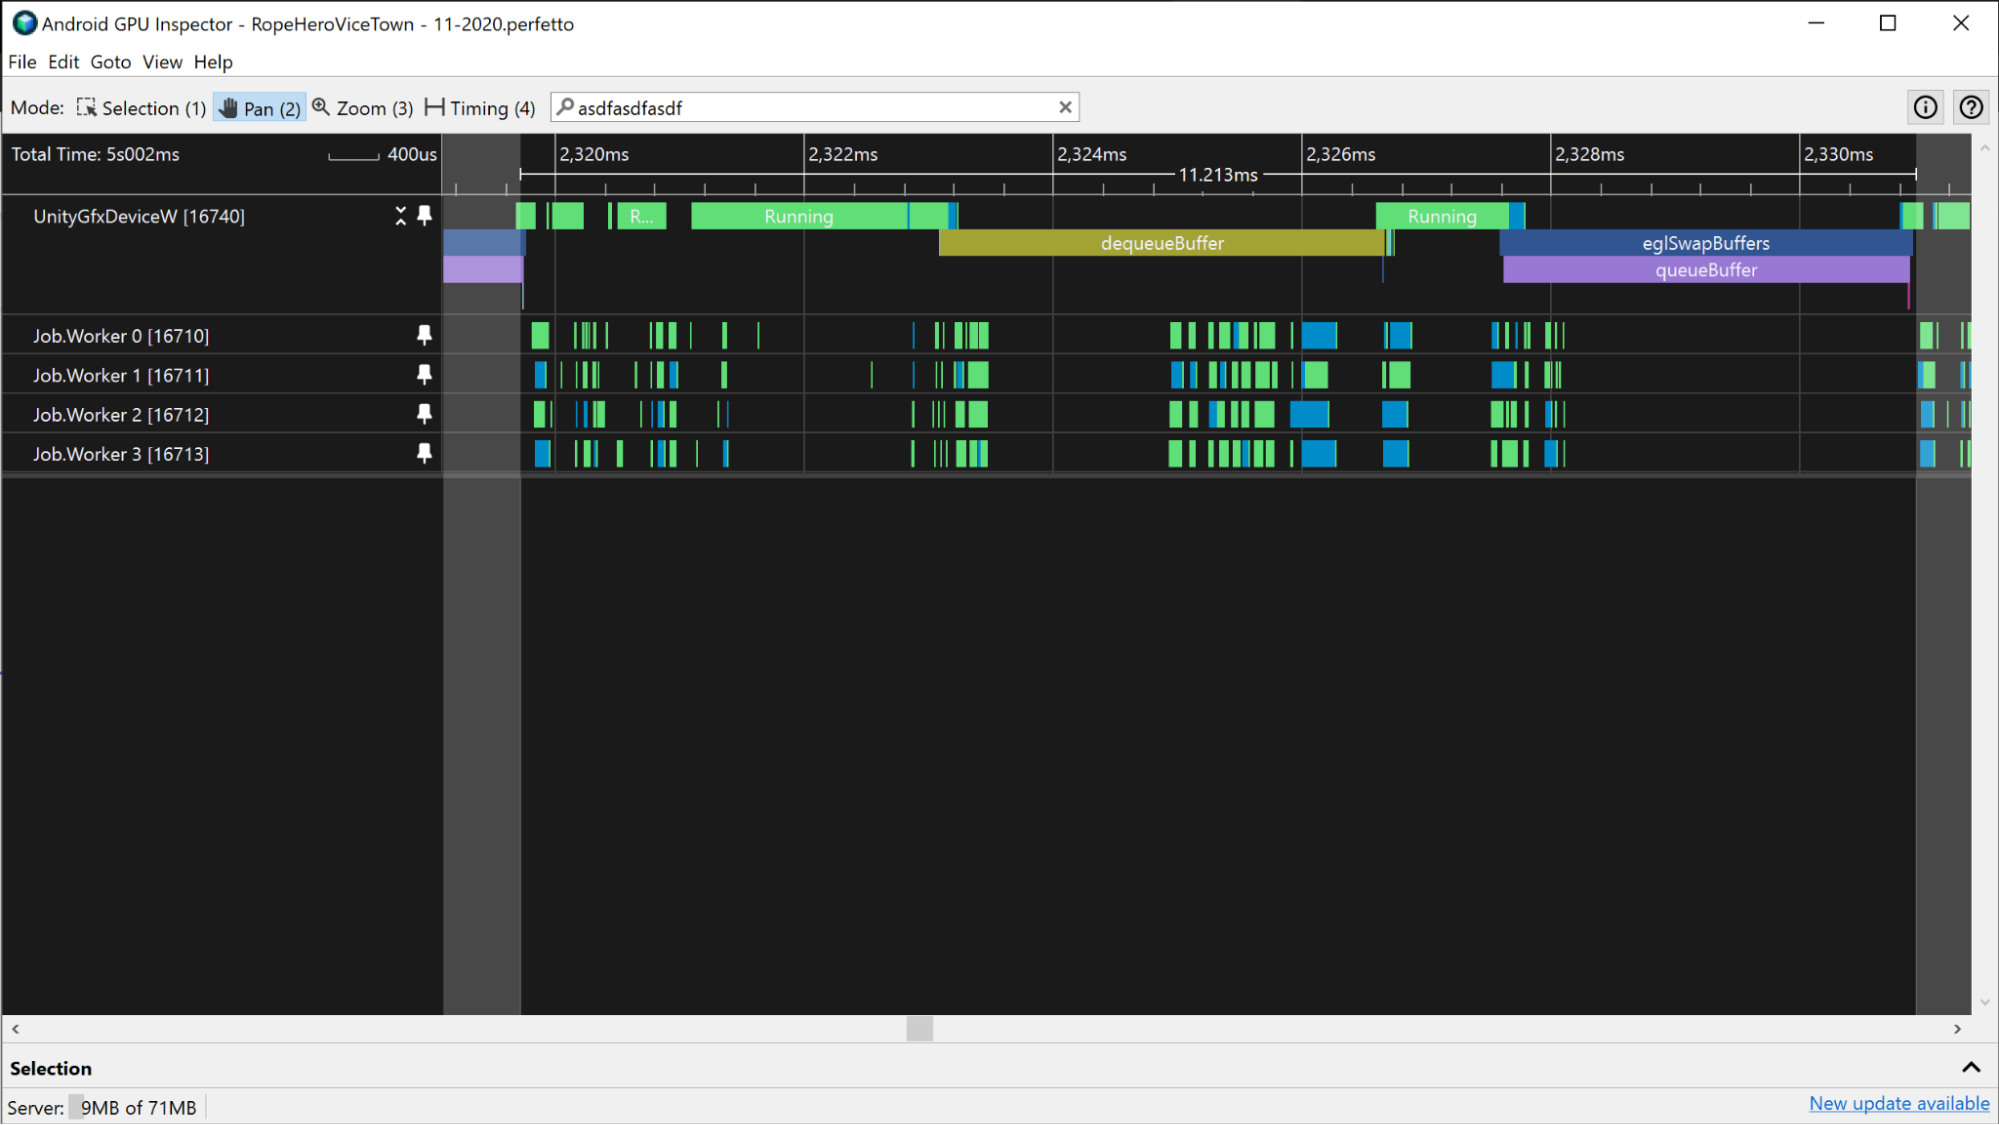
To measure the total CPU time spent,
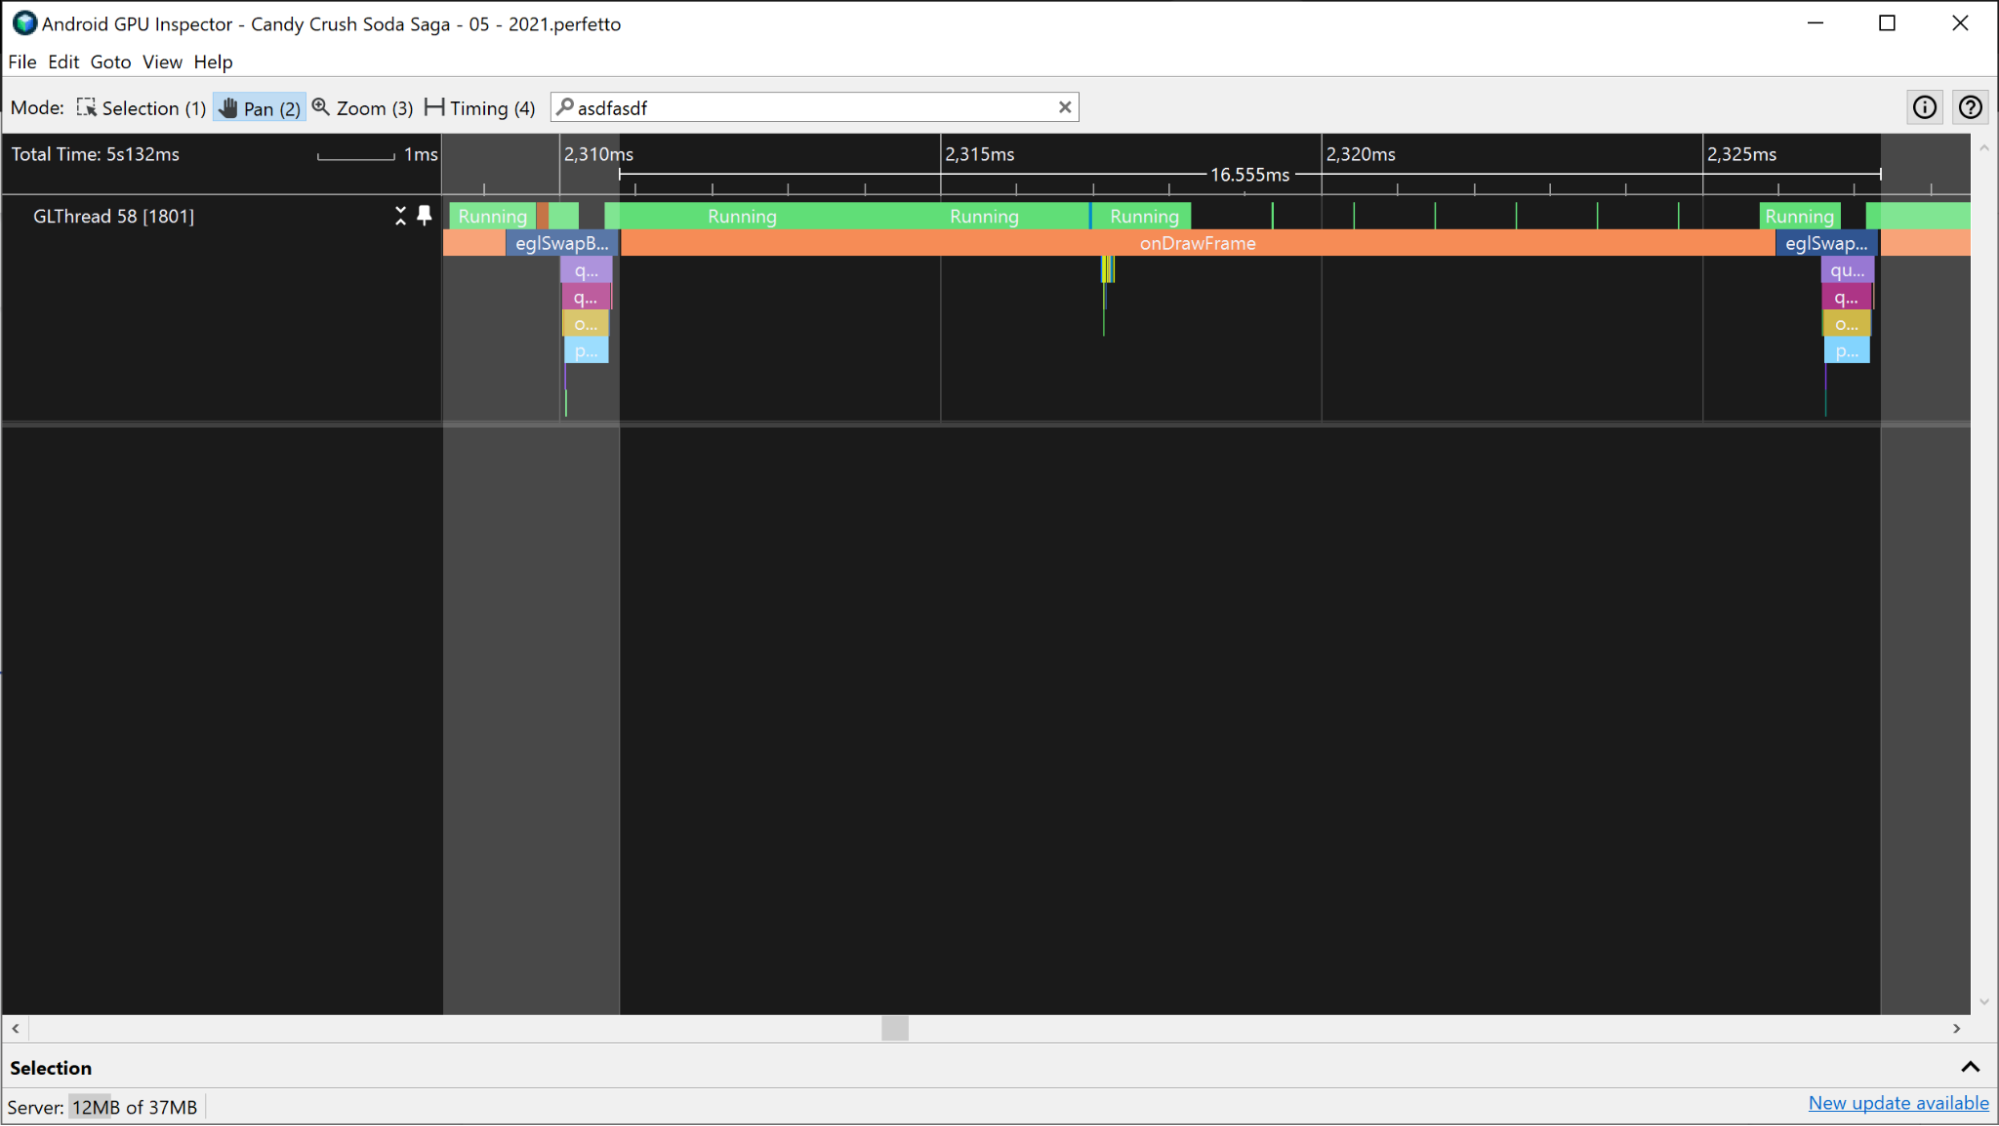
select the time range
that includes the time between successive frame submission events. The frame
submission events are eglSwapBuffers (for OpenGL) and vkQueuePresentKHR
(for Vulkan).
eglSwapBuffer events.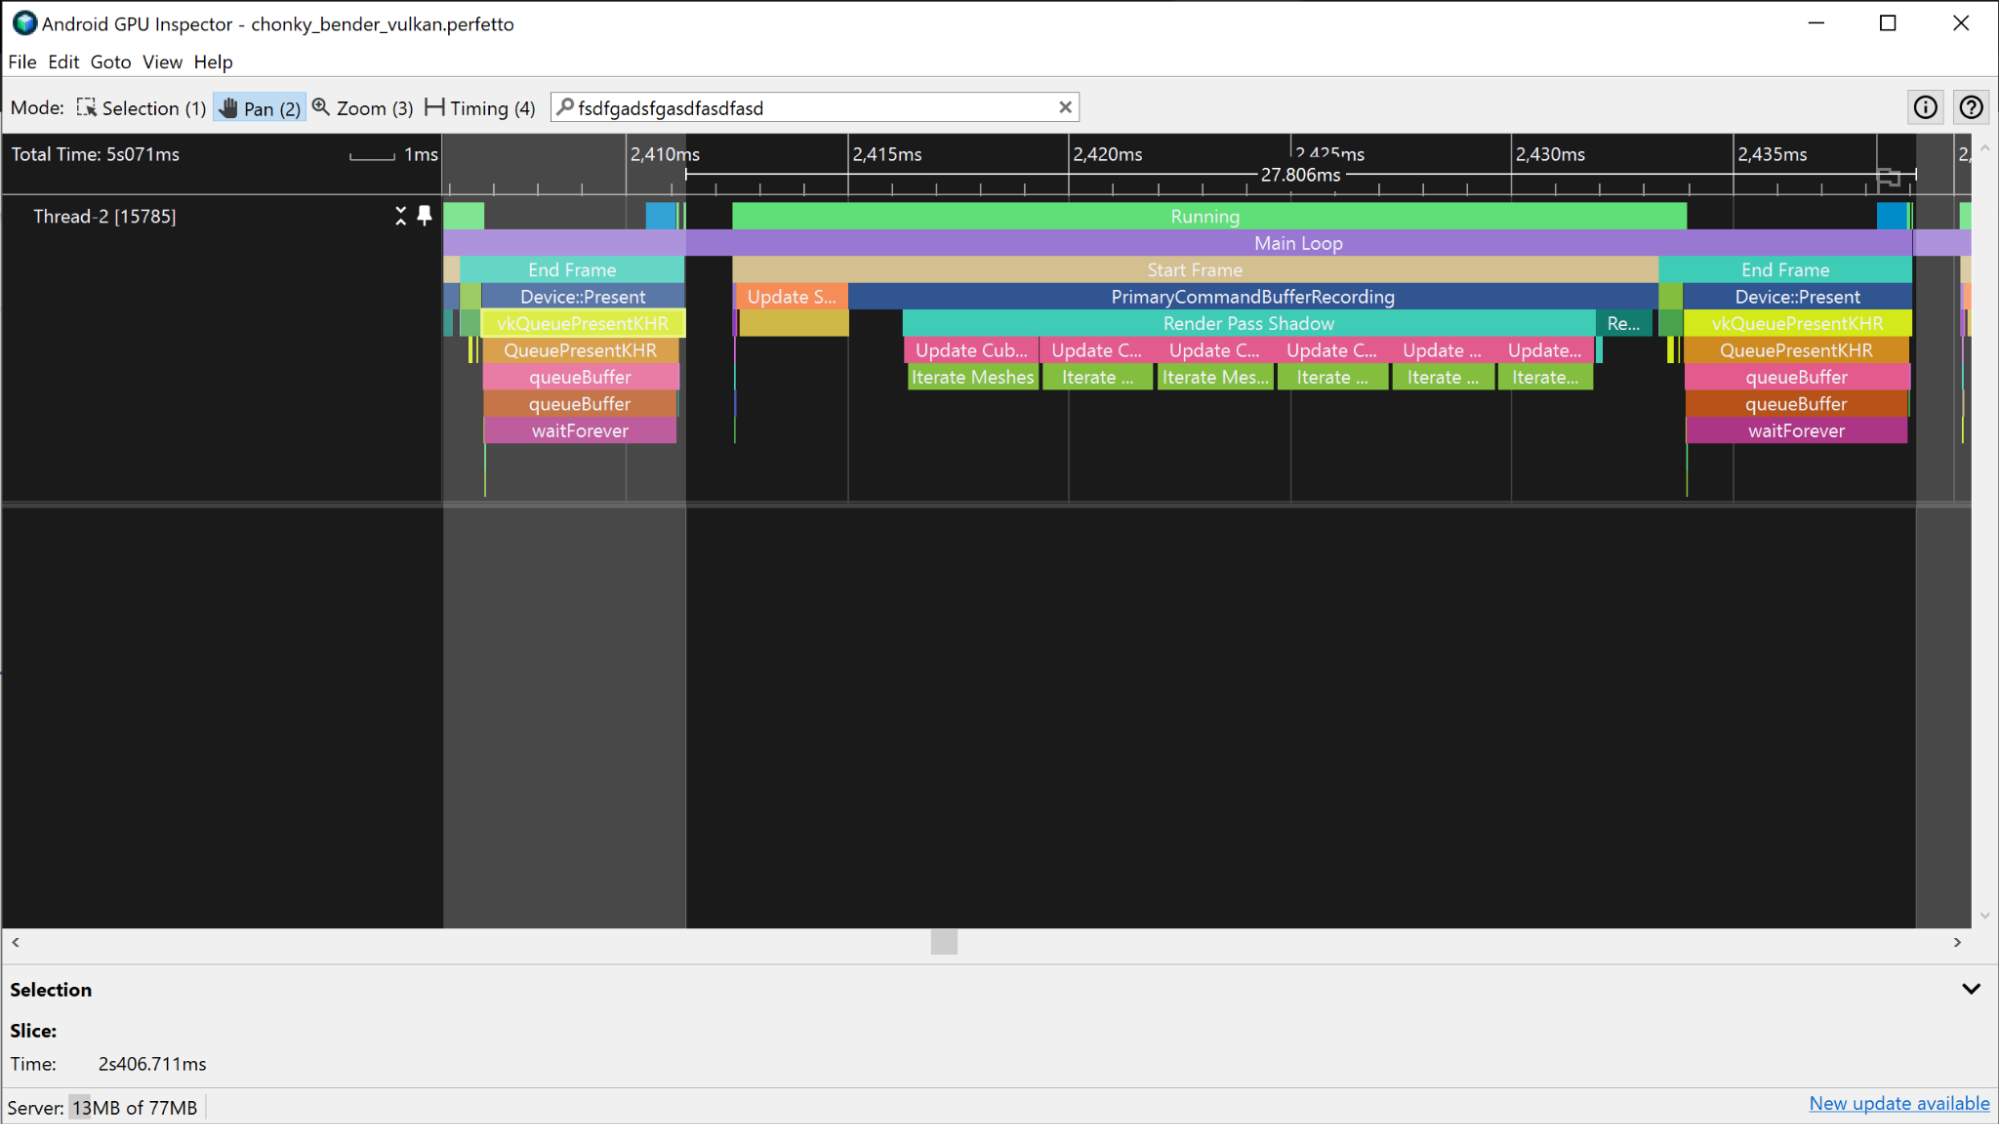
vkQueuePresentKHR events.This measurement is an estimate of total CPU time,but does not necessarily
represent the active CPU time. For example, in GPU-bound apps, the CPU
may wait for the GPU to complete its work before submitting a new frame. This
often happens when a dequeueBuffer, eglSwapBuffer (for OpenGL), or
vkQueuePresent (for Vulkan) event takes up a large portion of the CPU time.
The wait time is included in the total CPU time, but not the active CPU time.
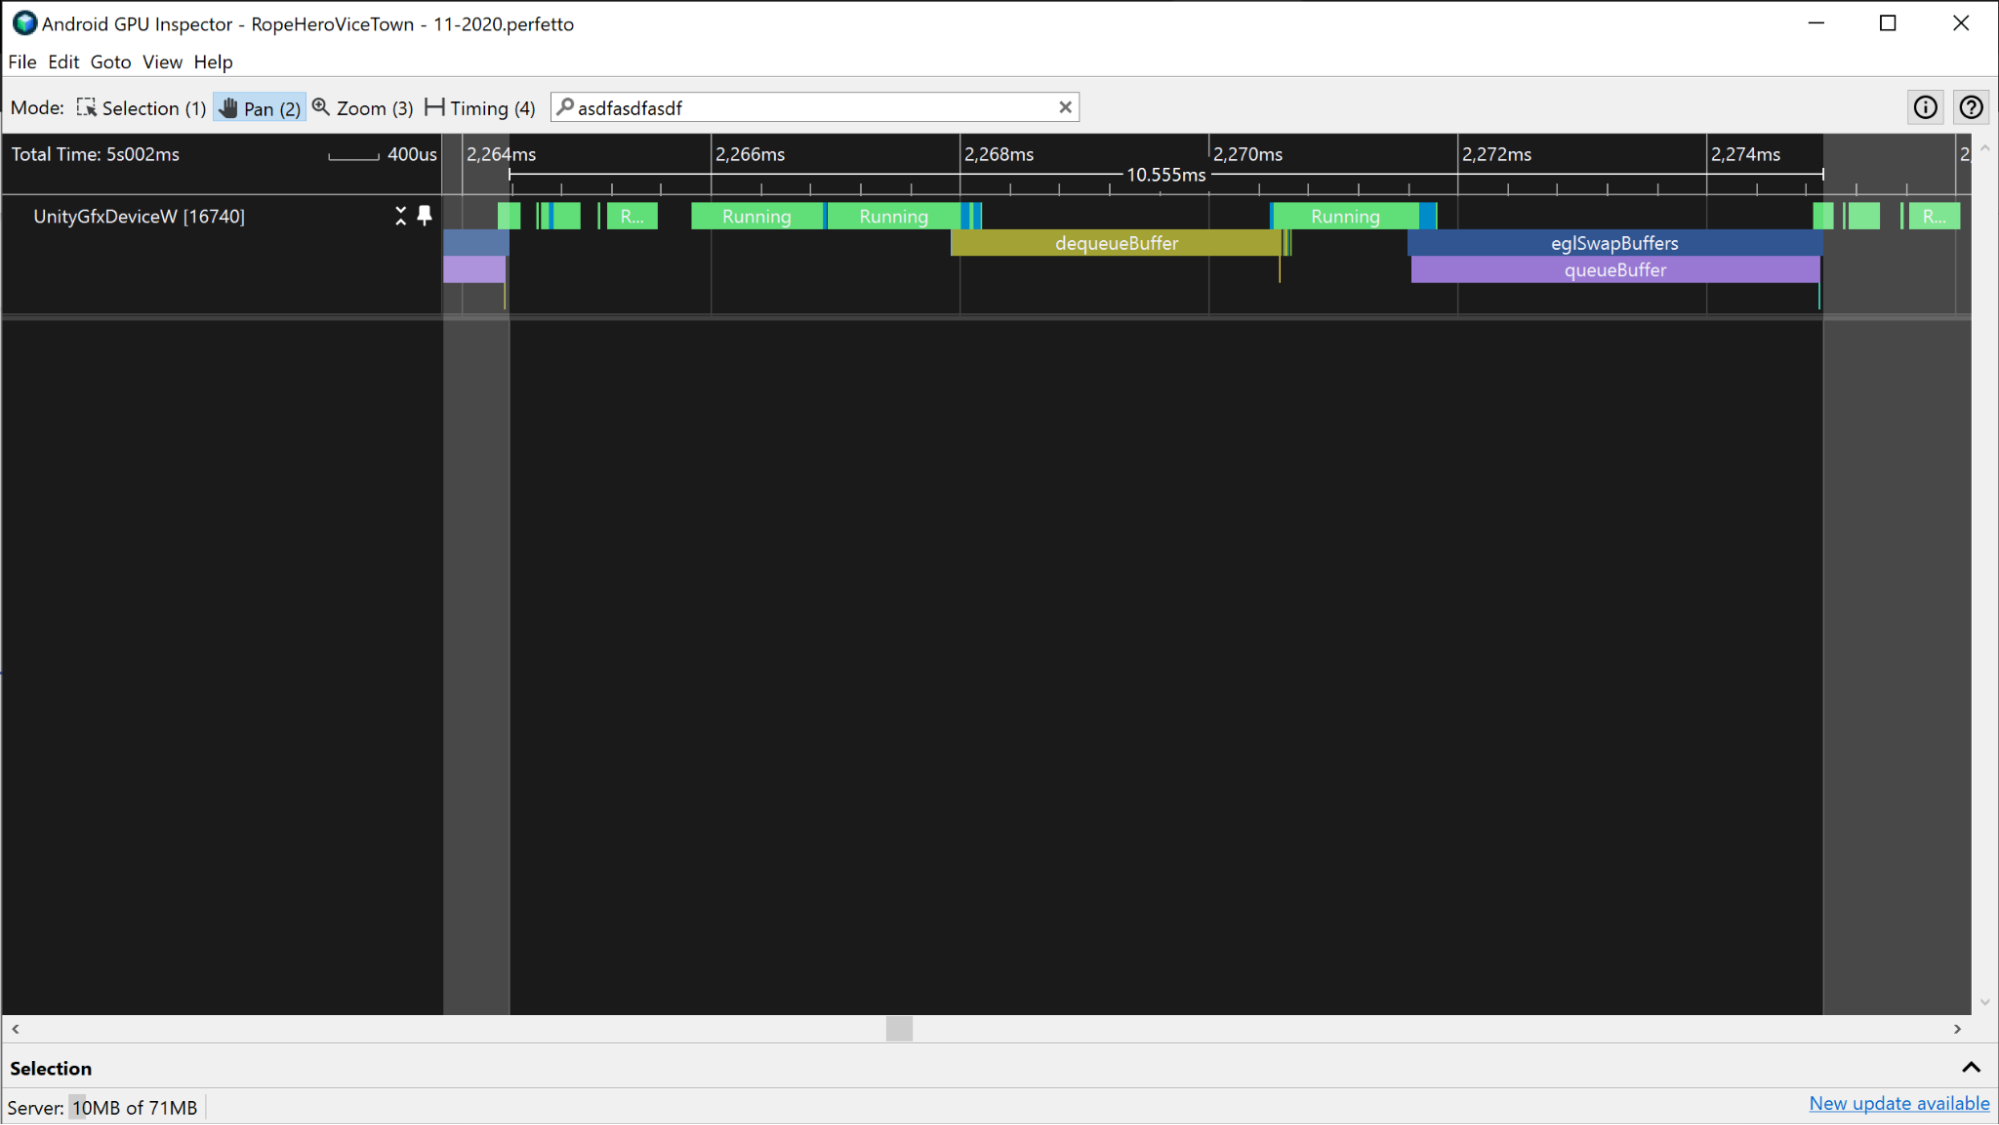
dequeueBuffer and eglSwapBuffer events.
Active CPU time
Active CPU time determines when the CPU is running the app code without being in an idle state.
To measure the active CPU time, view the Running slices just above the CPU events. Count all portions of the trace between the two frame submission events that are in the Running state. Ensure that you include working threads.
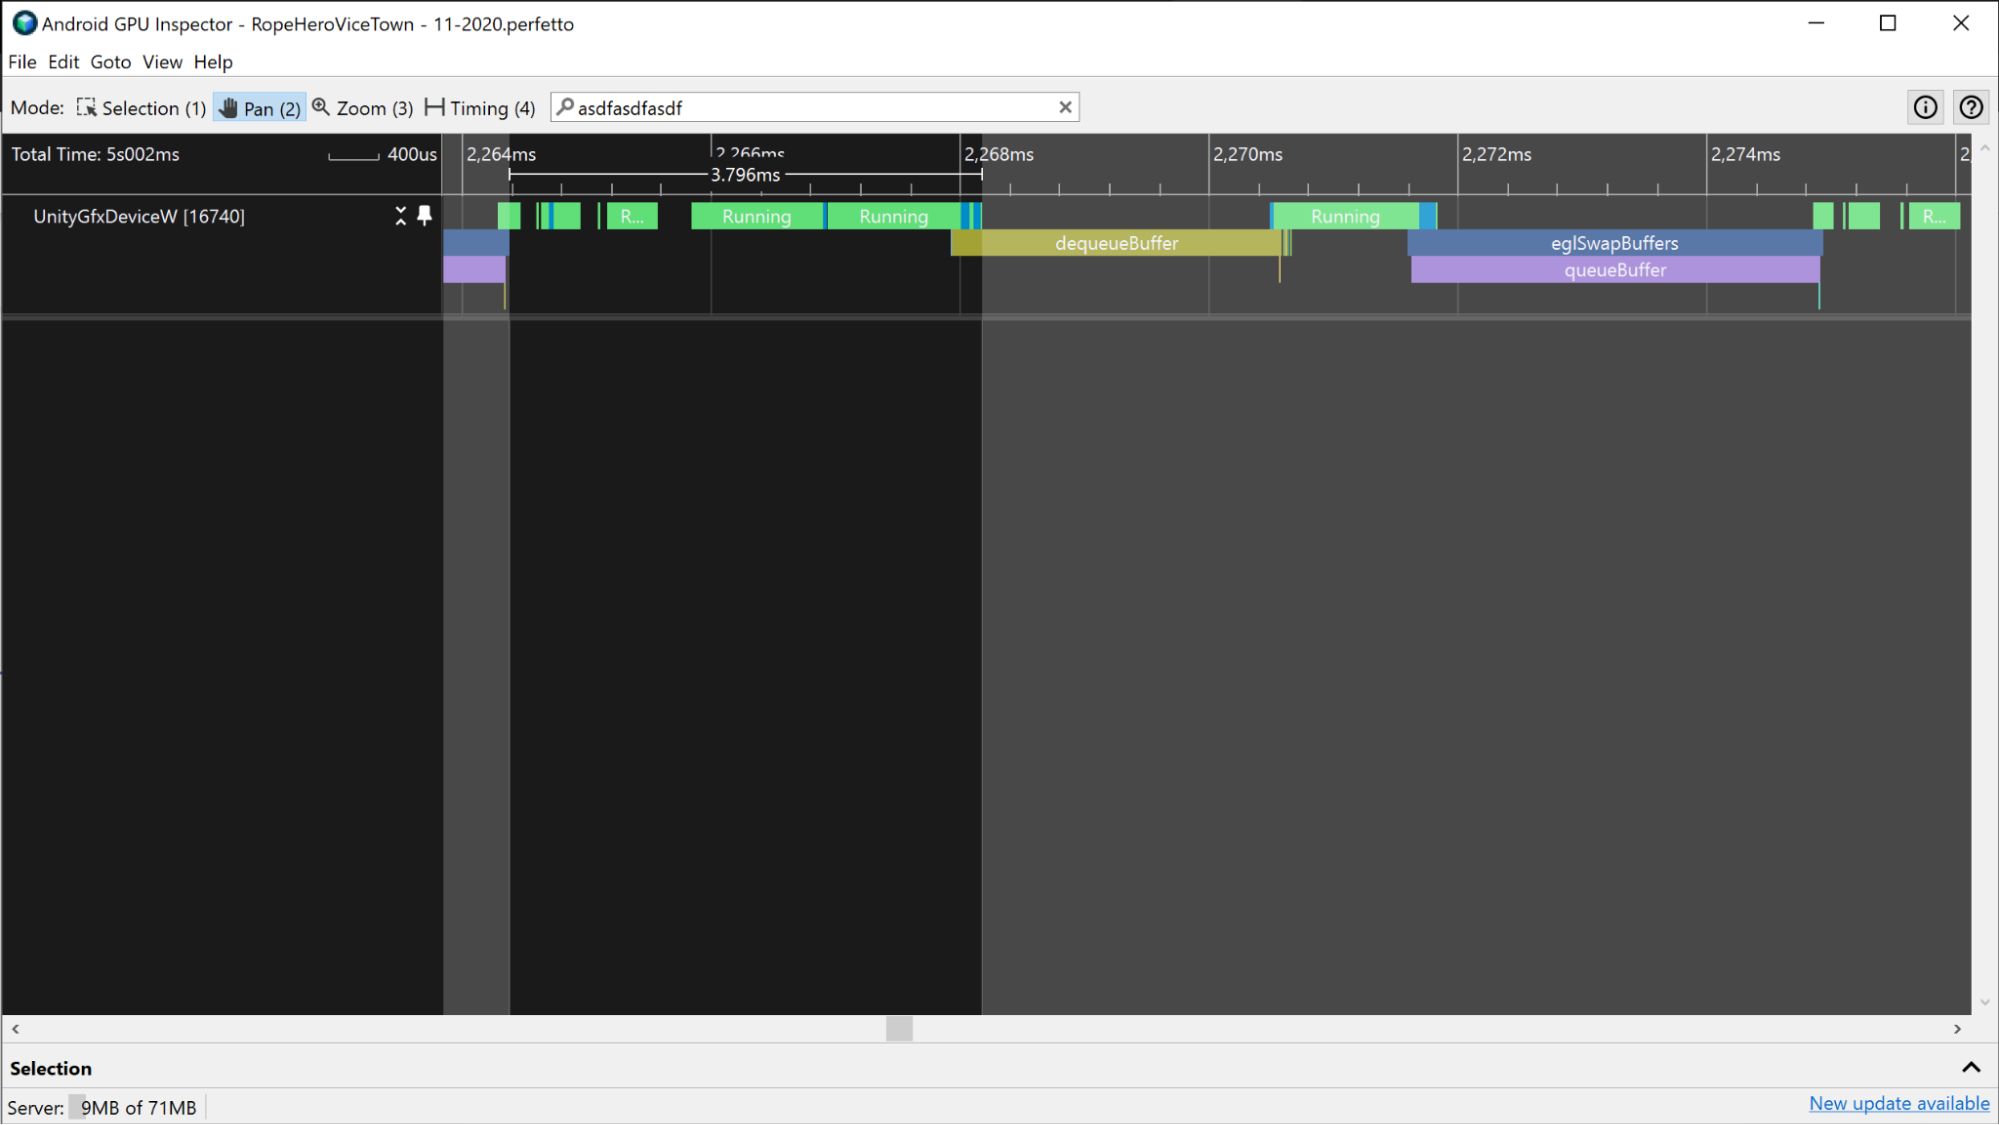
Another way to measure the active CPU time is to view the app slices in the CPU tracks. These slices indicated when the CPU is running and they correspond with the Running slices.
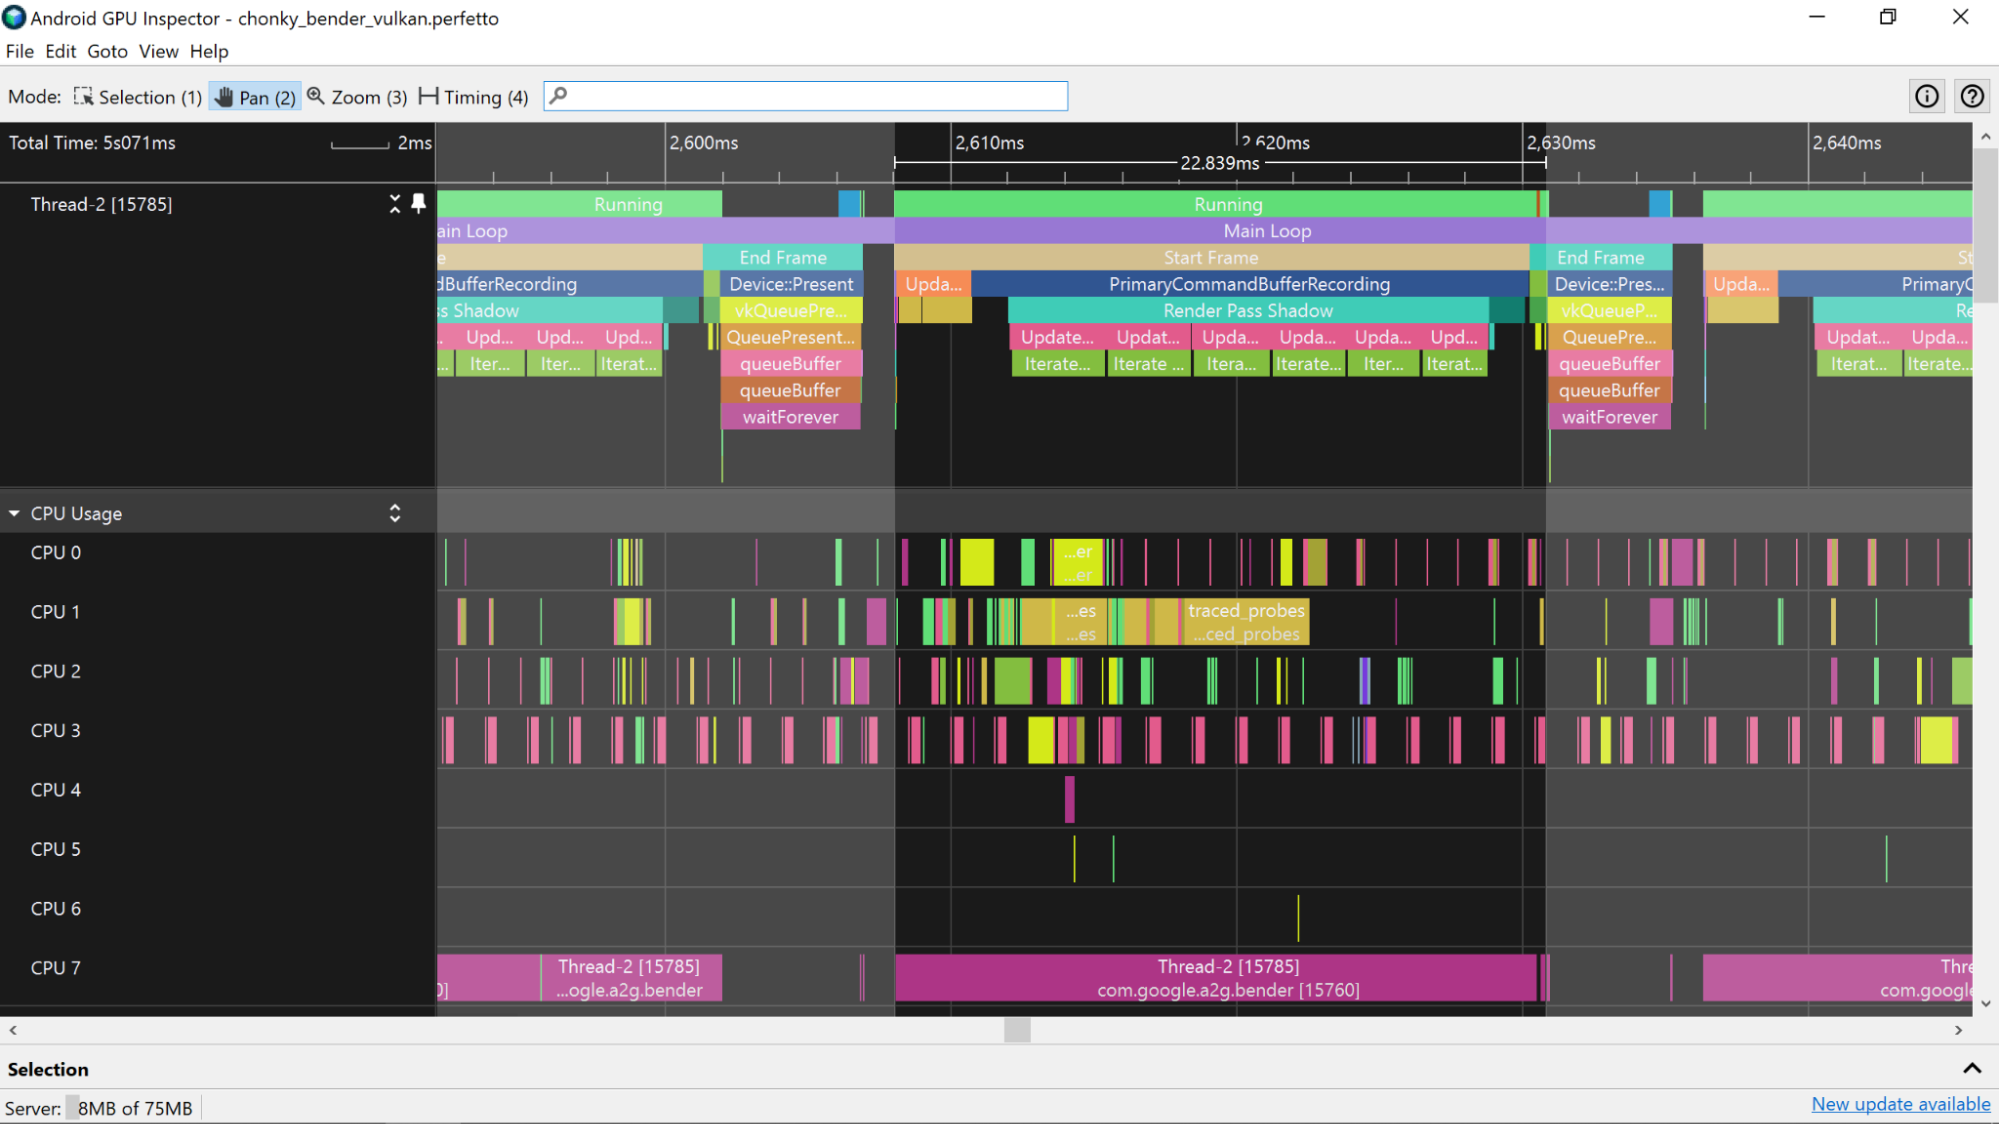
To help identify app slices, you can add ATrace markers to your app. This will display the markers in the CPU track of System Profiler.
Estimate GPU frame times
To estimate GPU frame times, you can either use GPU slices or GPU counters in System Profiler. The estimate is more accurate when using GPU slices.
GPU slices
If System Profiler has GPU slice information available, you can get very accurate GPU frame time information by measuring the total amount of time your app spends working on tasks that are associated with a single frame.
Mali devices
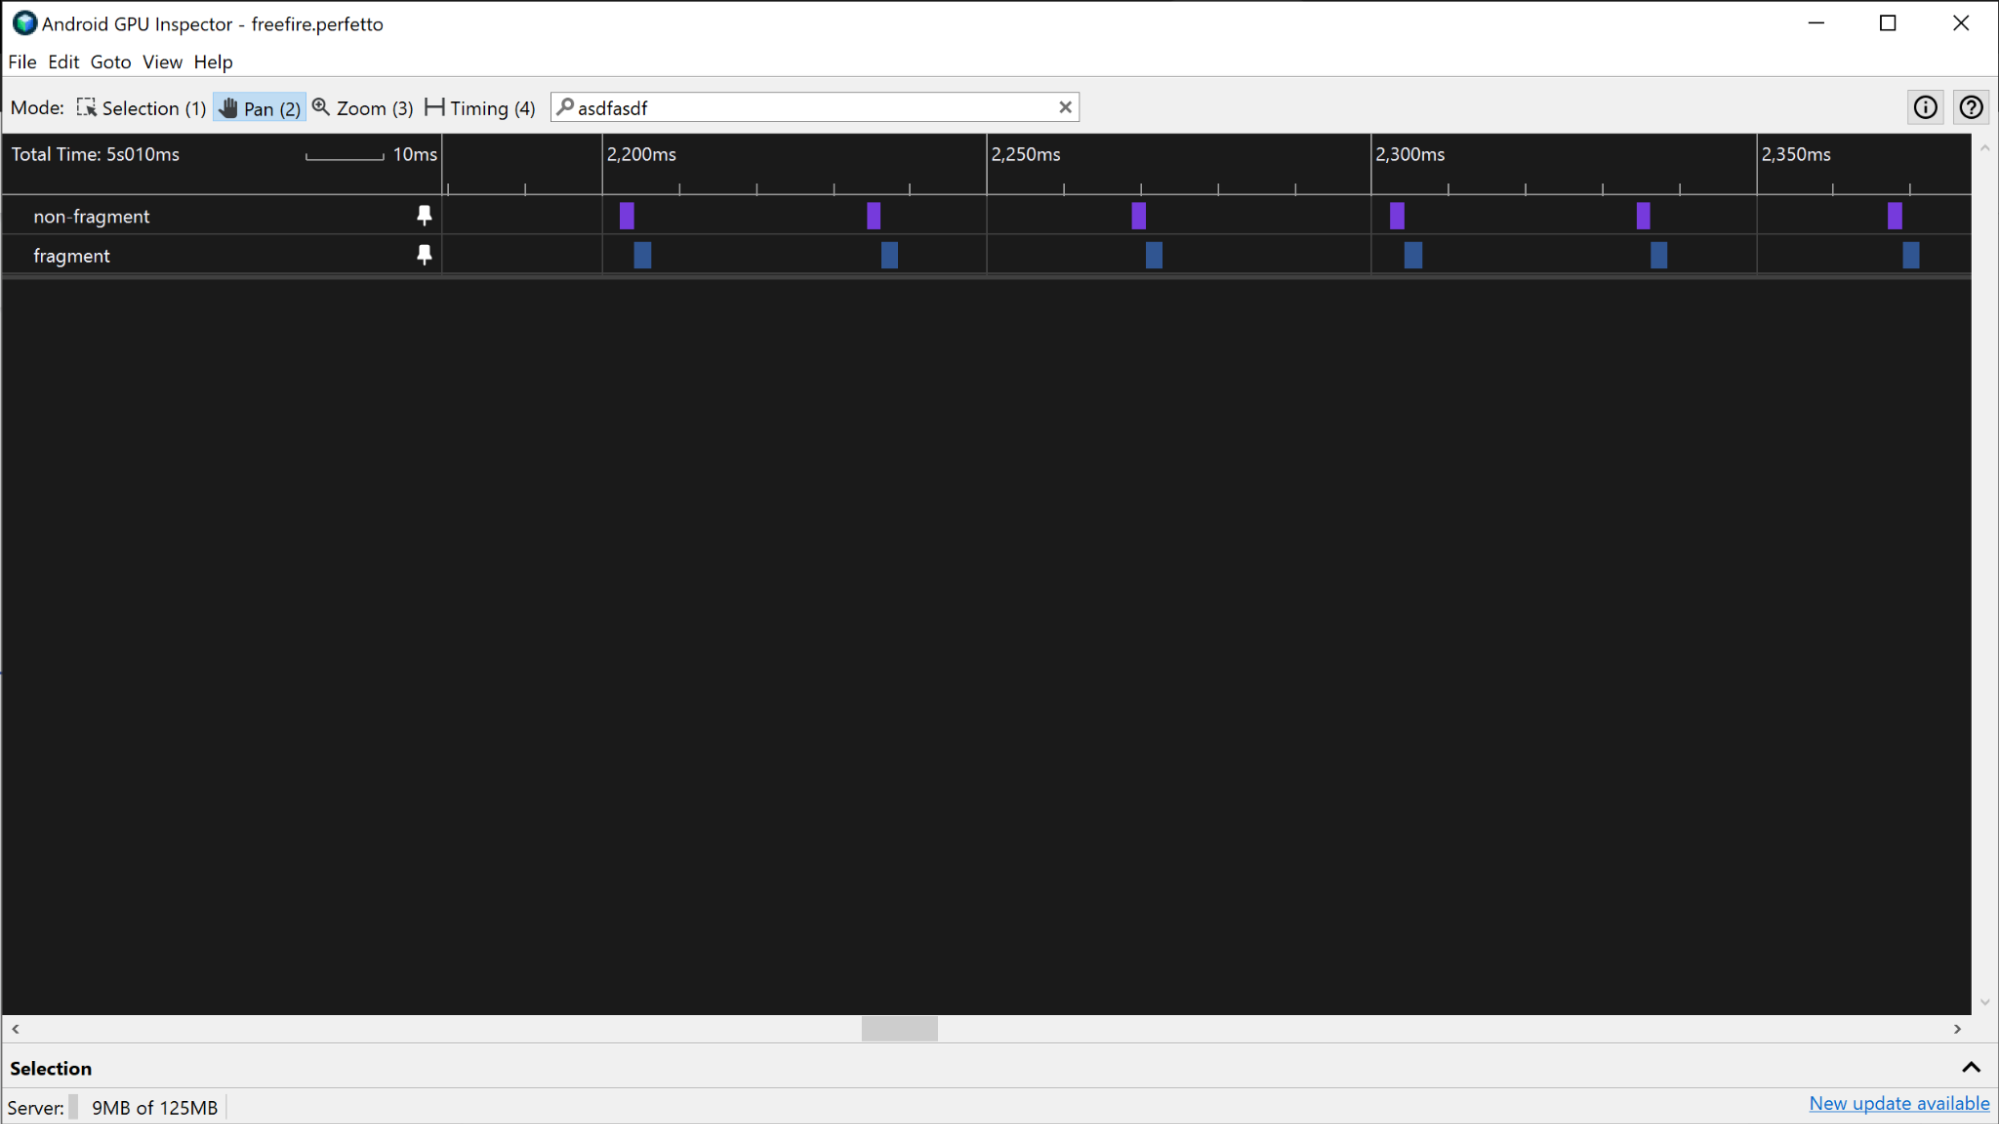
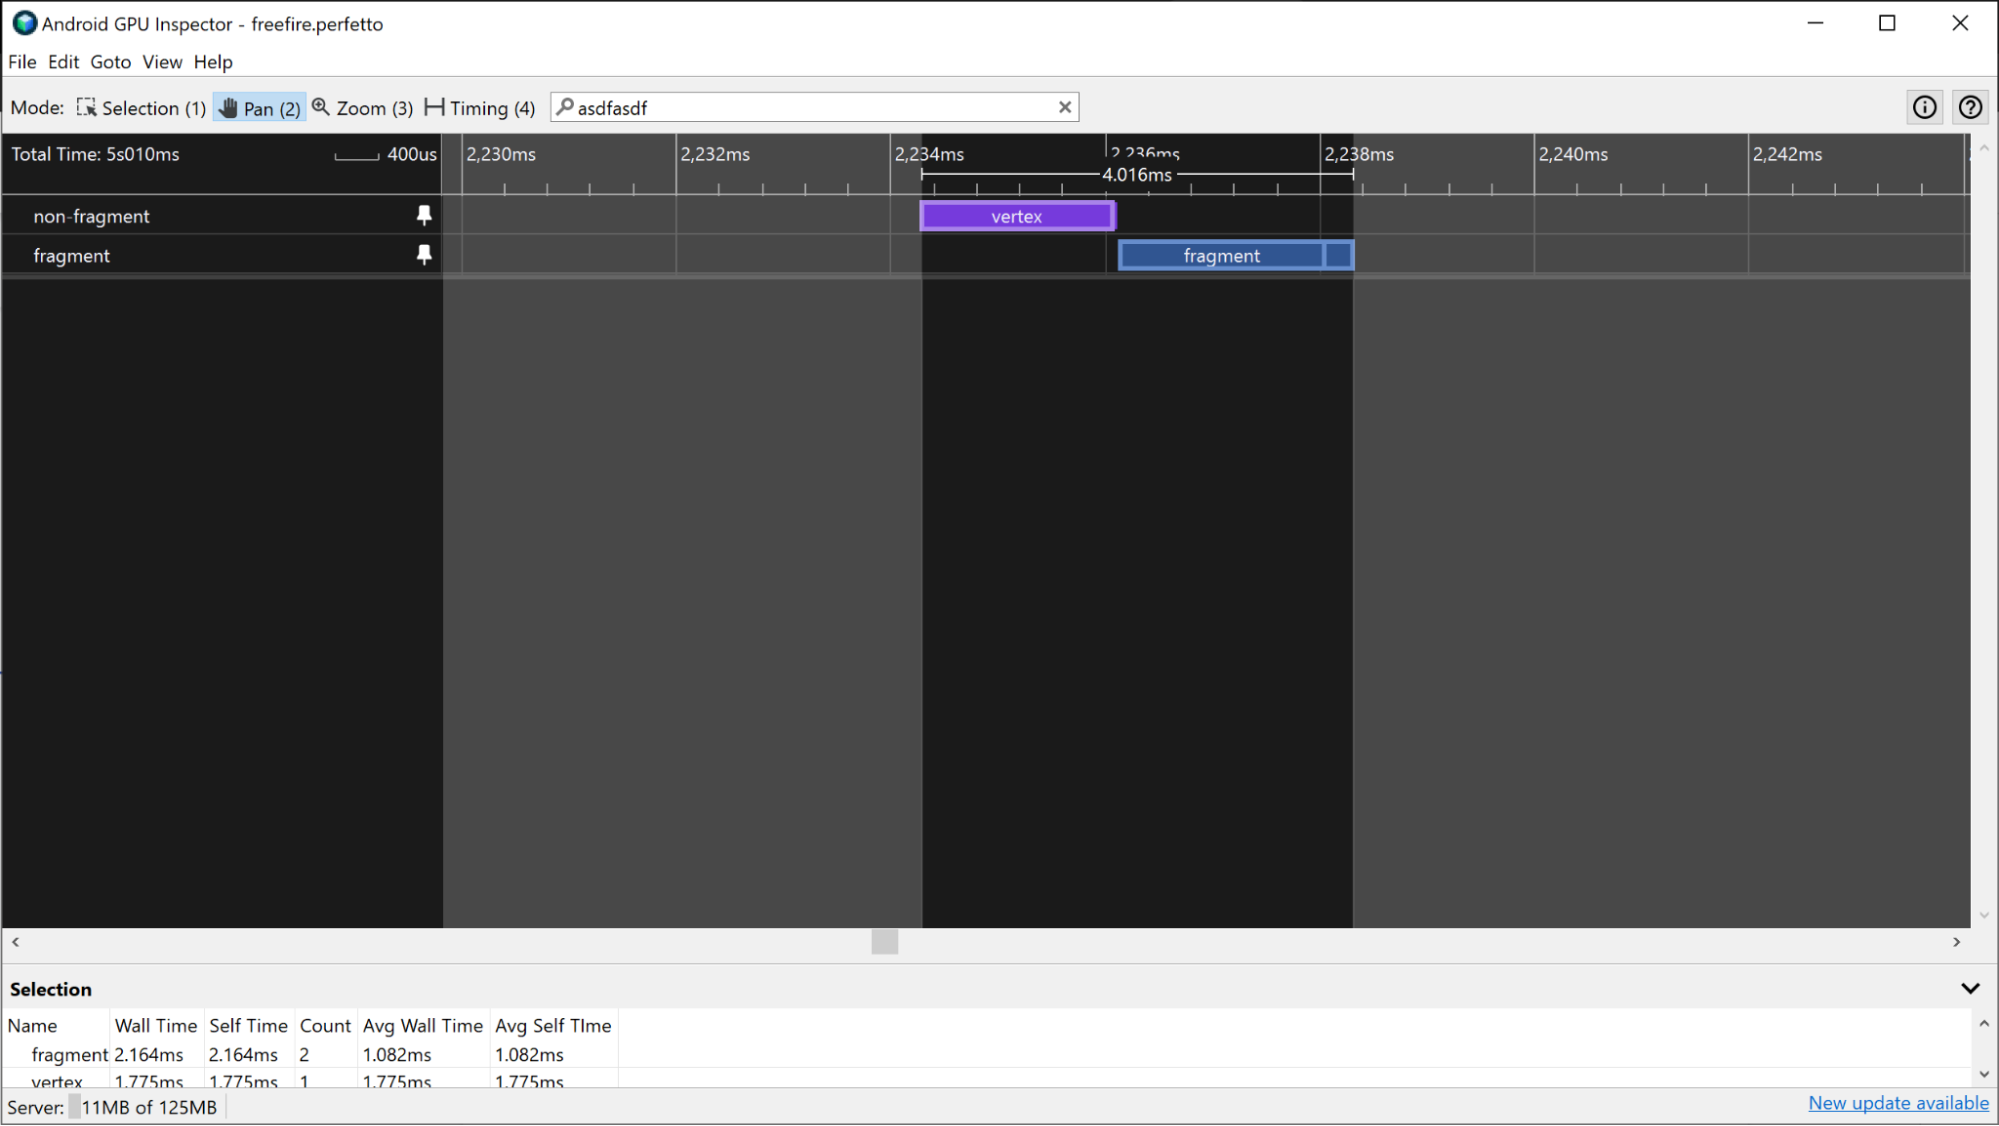
On Mali devices, GPU slices have fragment, non-fragment, and occasionally supplementary non-fragment tracks. For less complex frames, the fragment and non-fragment work is sequential, so distinguishing one frame’s work from another can be done by looking for gaps between active GPU work.
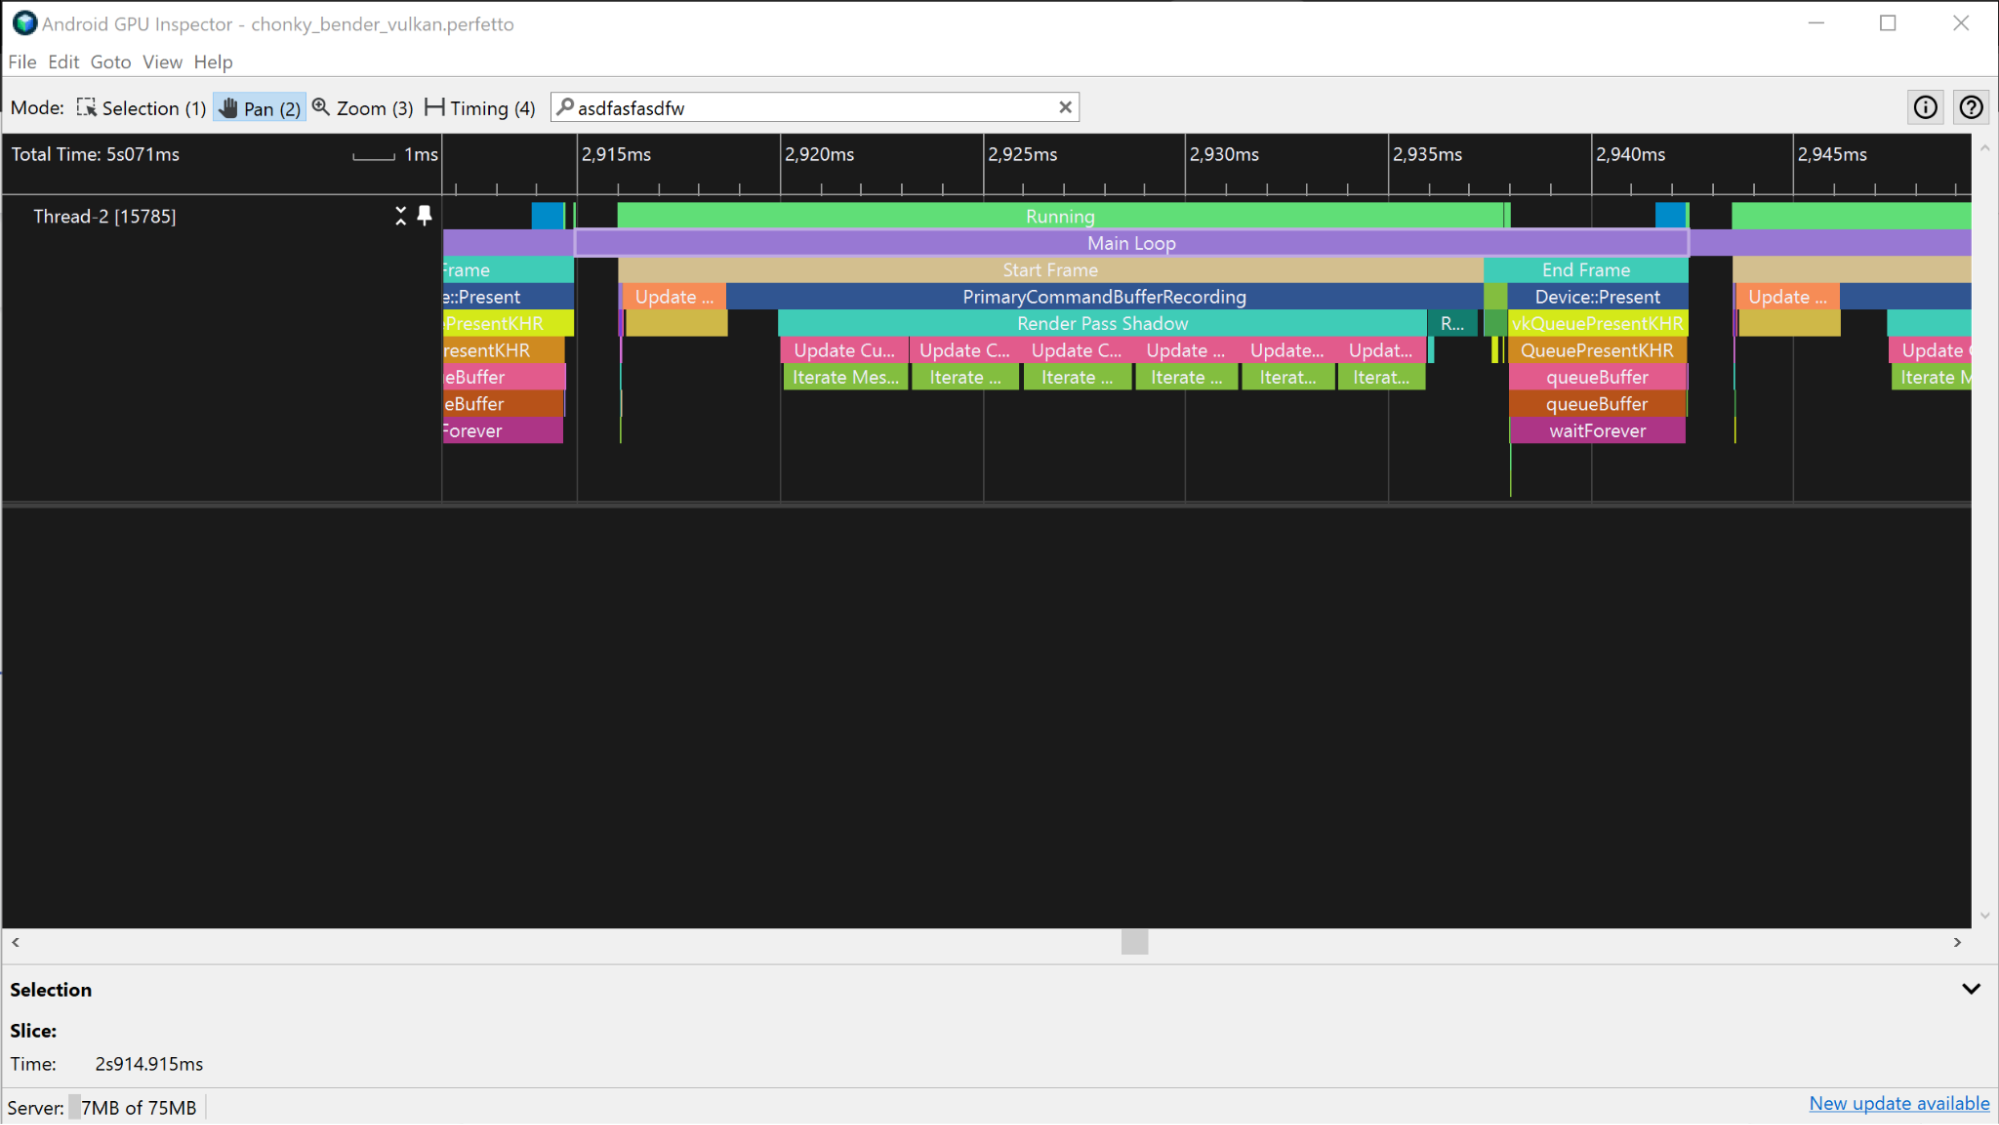
As an alternative, if you're familiar with the work that’s being submitted to the GPU, identifying the pattern of the submitted render passes provides information about when a frame starts and ends.
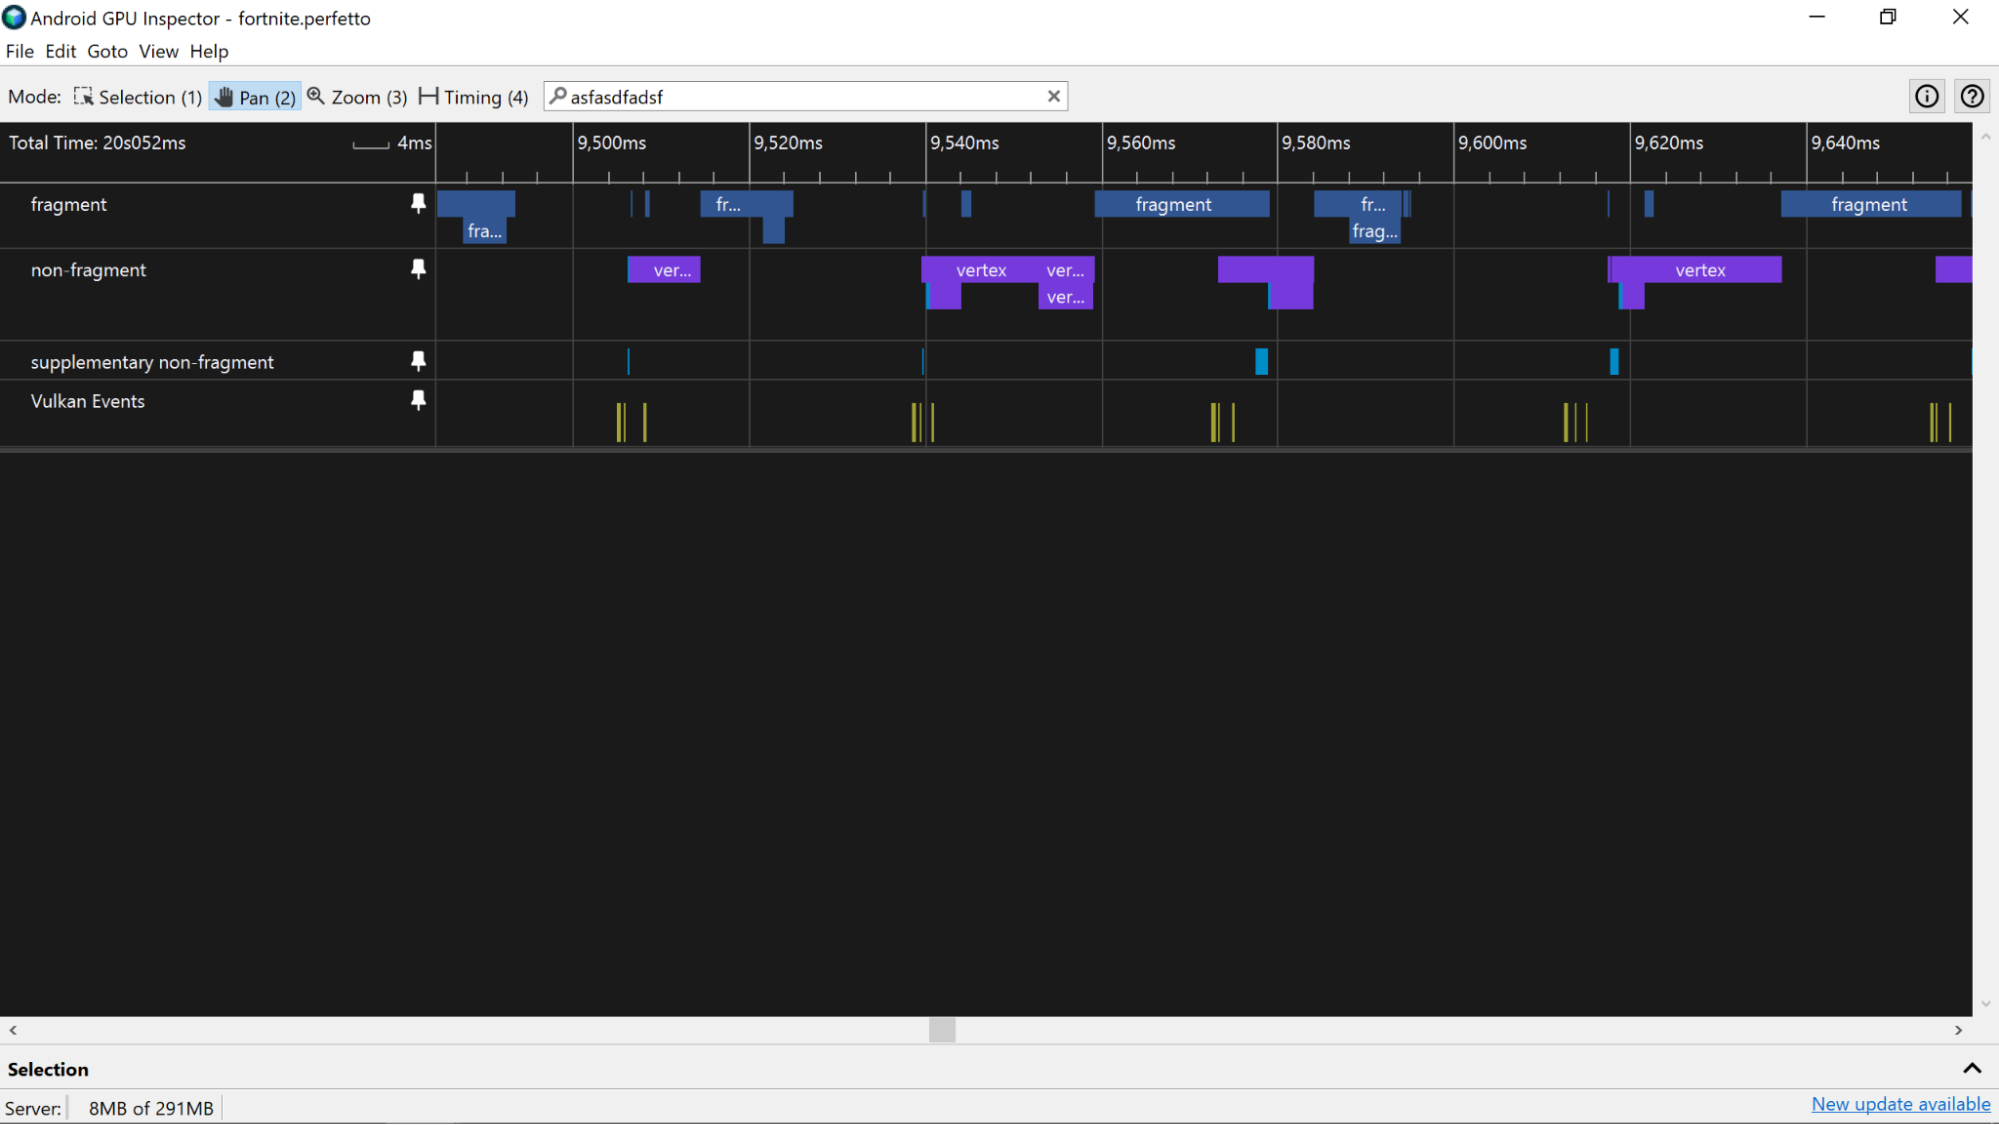
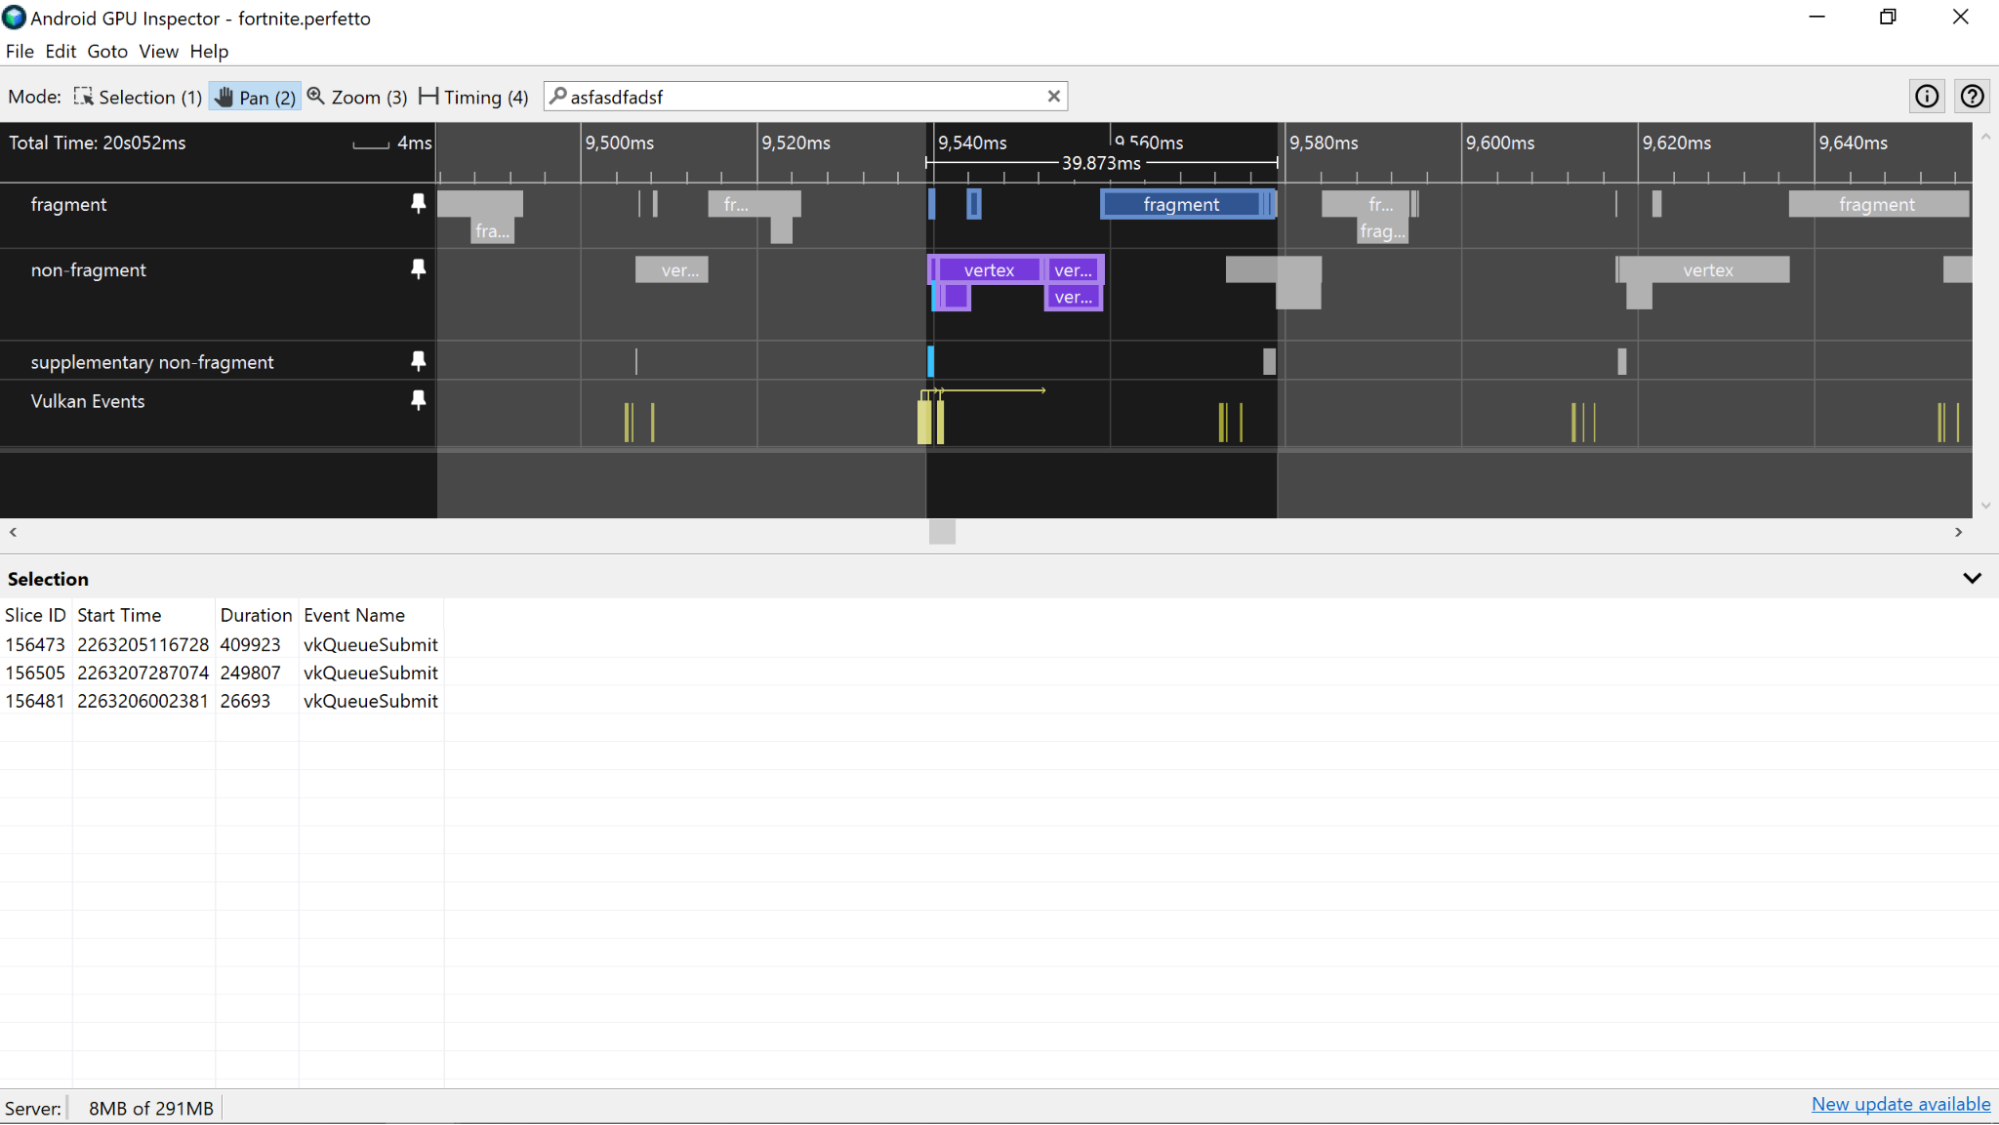
For apps that have a more heavily-parallelized GPU workflow, you can get the GPU frame times by looking for all the frames that have the same submissionID in the Selection pane for each slice.
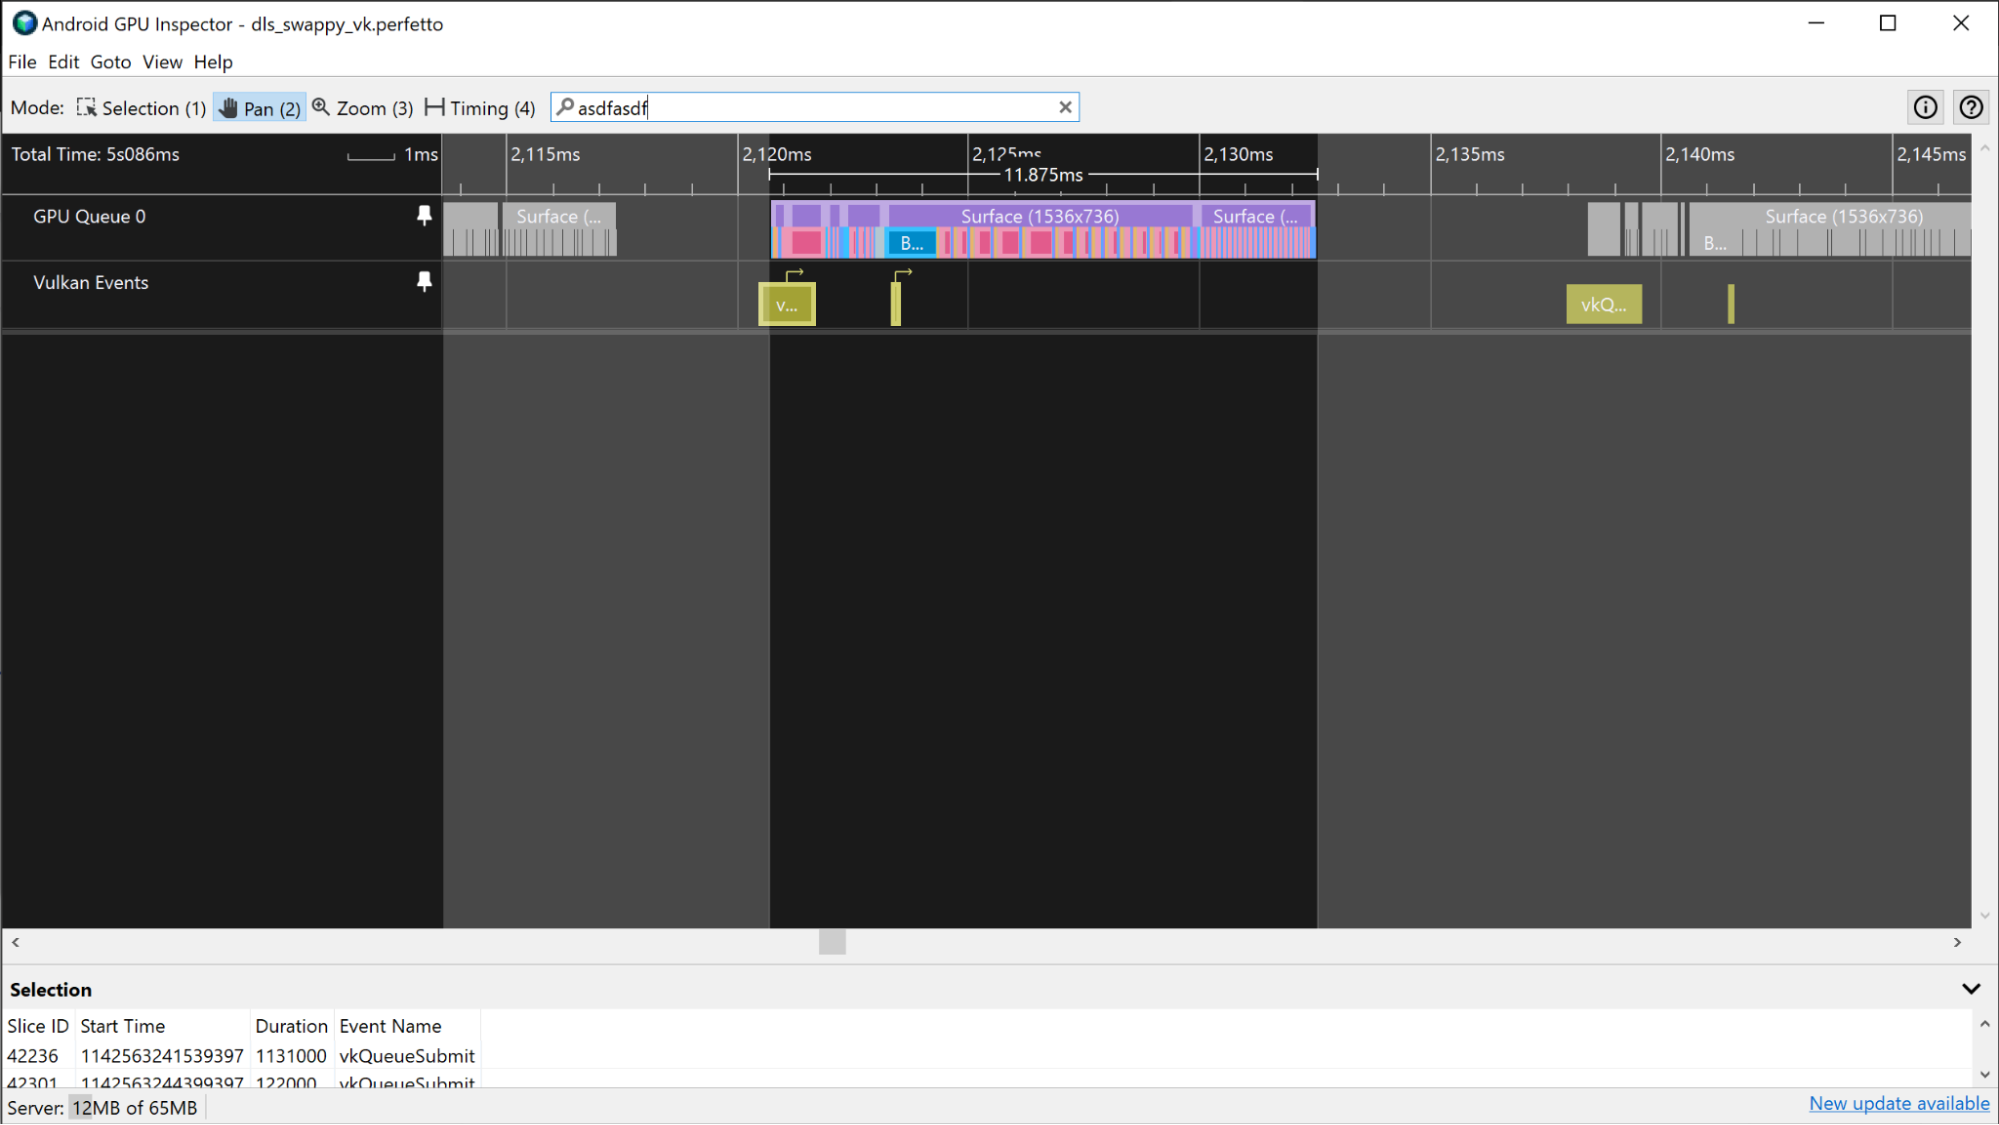
For Vulkan-based apps, multiple submissions can be used to compose a frame. Keep track of the submission IDs by using the Vulkan Events track, which contains a slice for each submission. Selecting a submission slice will highlight all the GPU activity slices that correspond to the submission.
Adreno devices
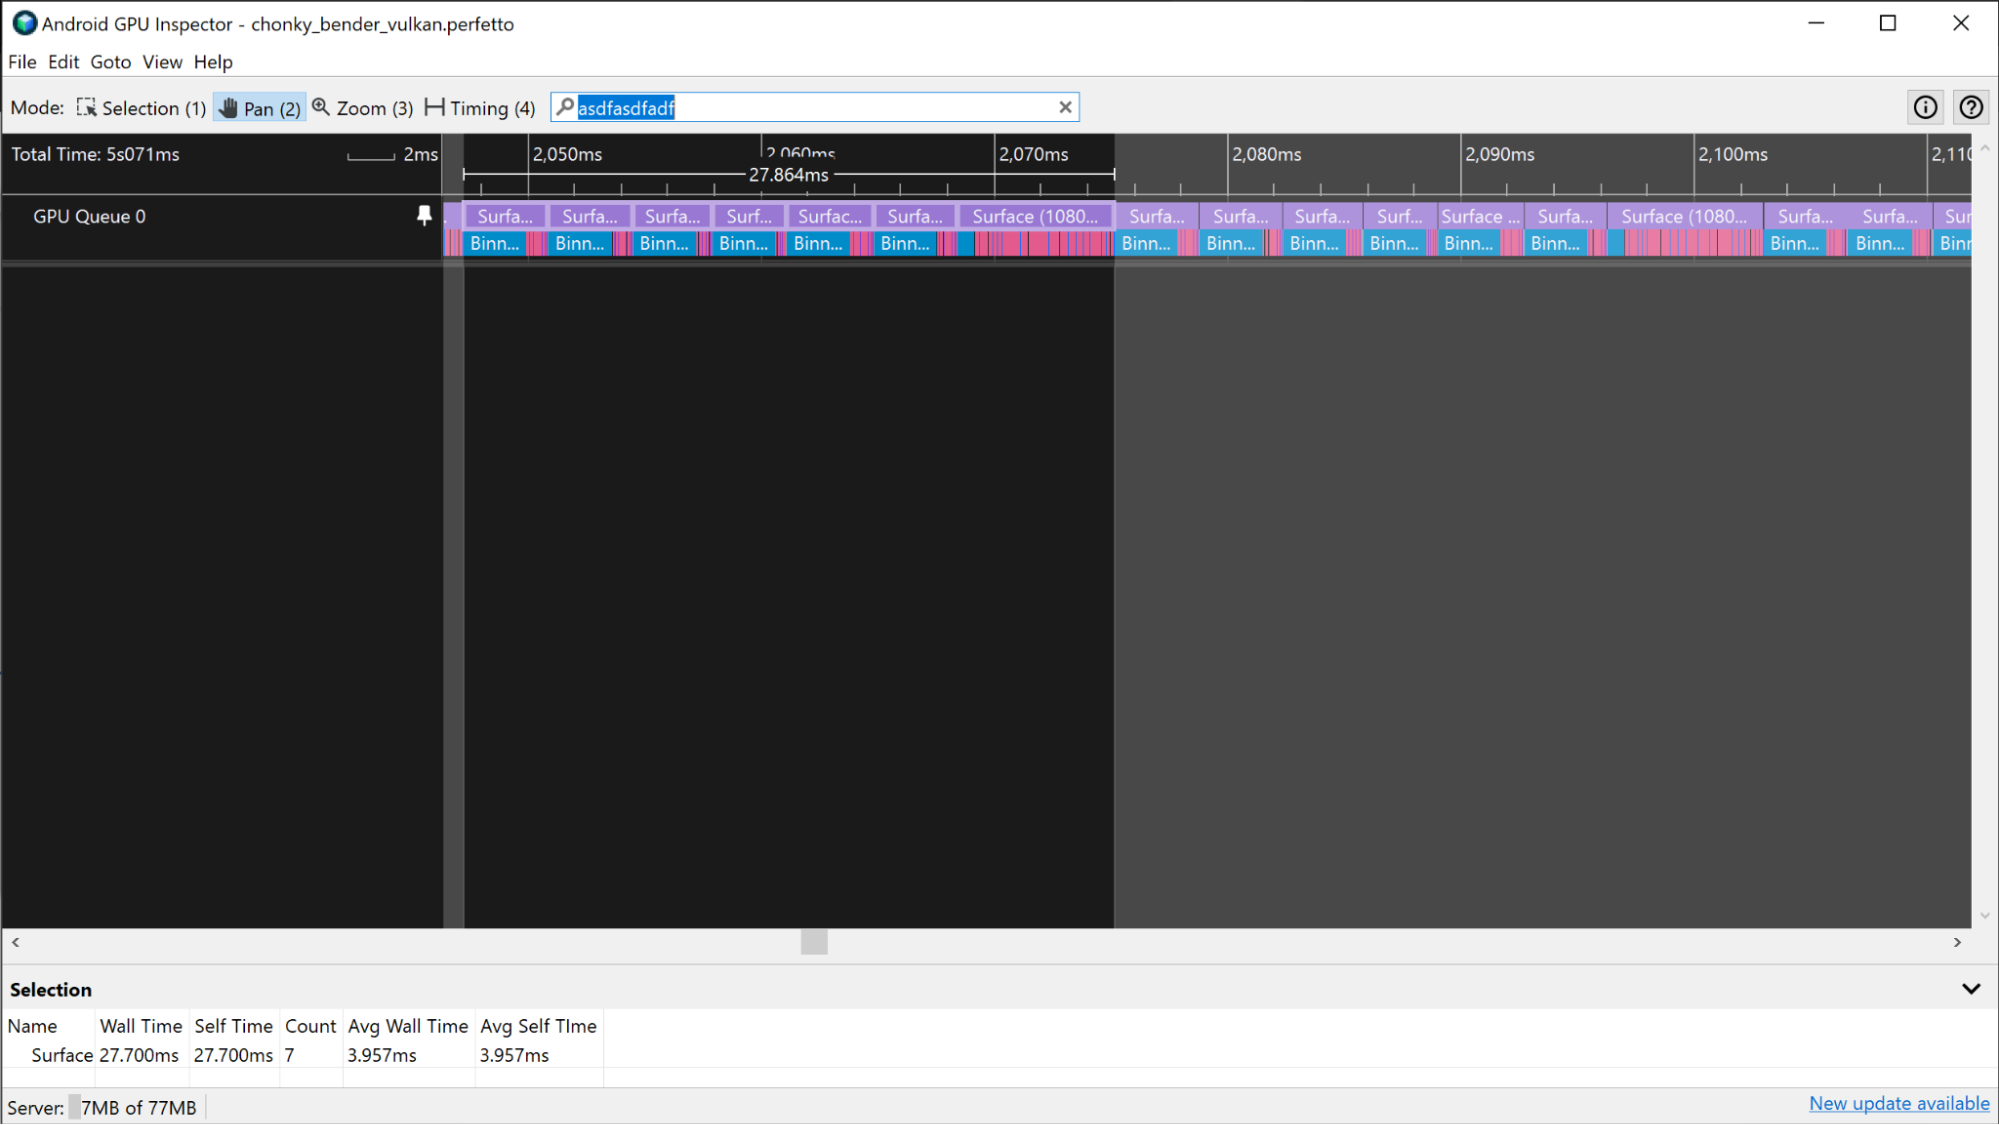
On Adreno devices, GPU slices appear in the GPU Queue 0 track and are always represented sequentially, so you can look at all the slices that represent the render passes for a frame and use them to measure GPU frame times.
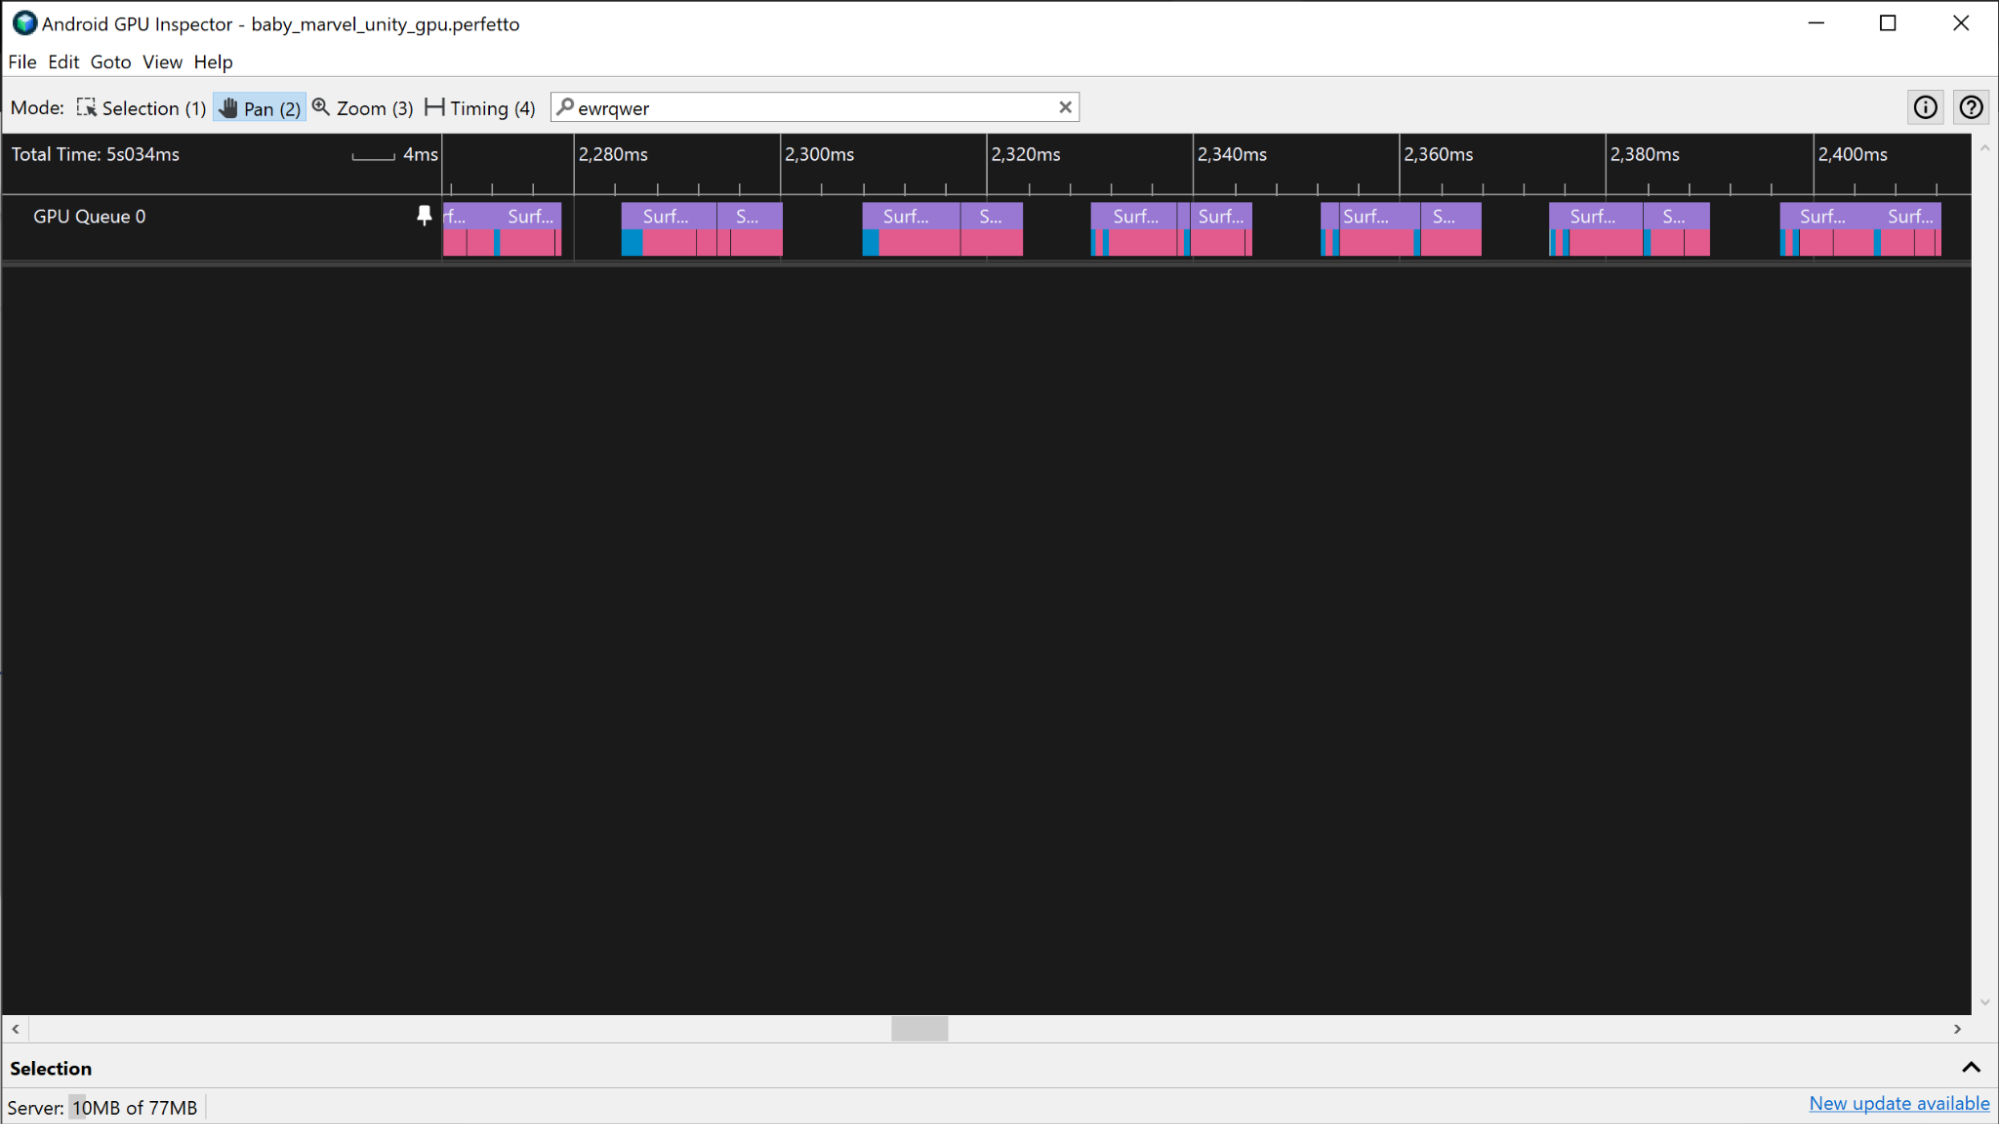
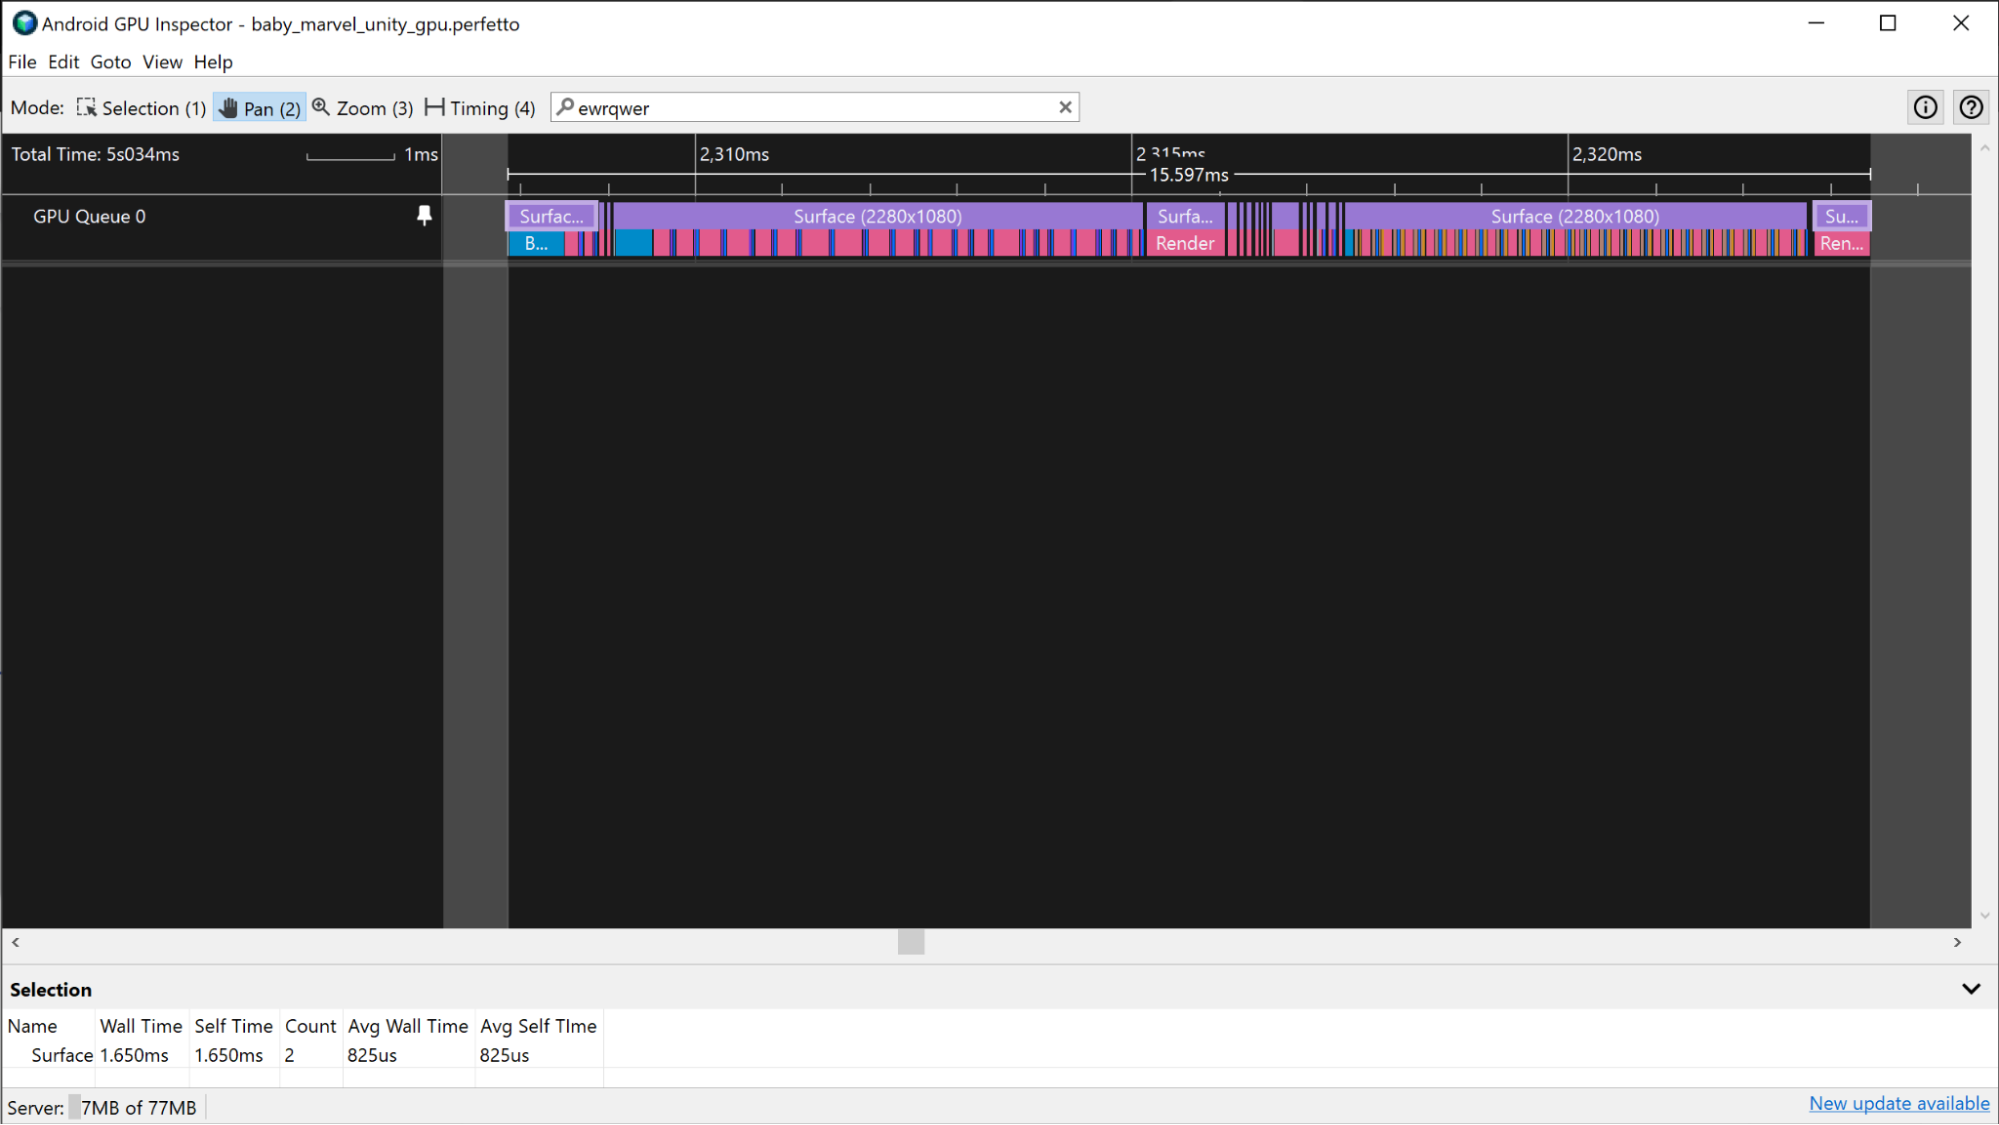
Similar to the Mali scenario described previously: if the app is using Vulkan, the Vulkan Events track provides information on the work being submitted to execute the frame. To highlight the render passes, click the Vulkan Events slices that are associated with the frame.
There are some scenarios where the GPU frame boundaries are more challenging to distinguish due to the app being heavily GPU bound. In these scenarios, if you're familiar with the work that’s being submitted to the GPU, you can identify the pattern that render passes are being executed with and determine the frame boundaries from that information.
GPU counters
If GPU slice information is not available in a trace, you can estimate the GPU frame time using the GPU counter tracks.
Mali devices
On Mali devices, you can use the GPU utilization track to estimate the GPU frame time for an app that isn't GPU intensive. When apps are less GPU intensive, they have regular periods of high and low GPU activity, instead of consistently high activity. To estimate the GPU frame times using the GPU utilization track, measure the duration of high activity periods in the track.
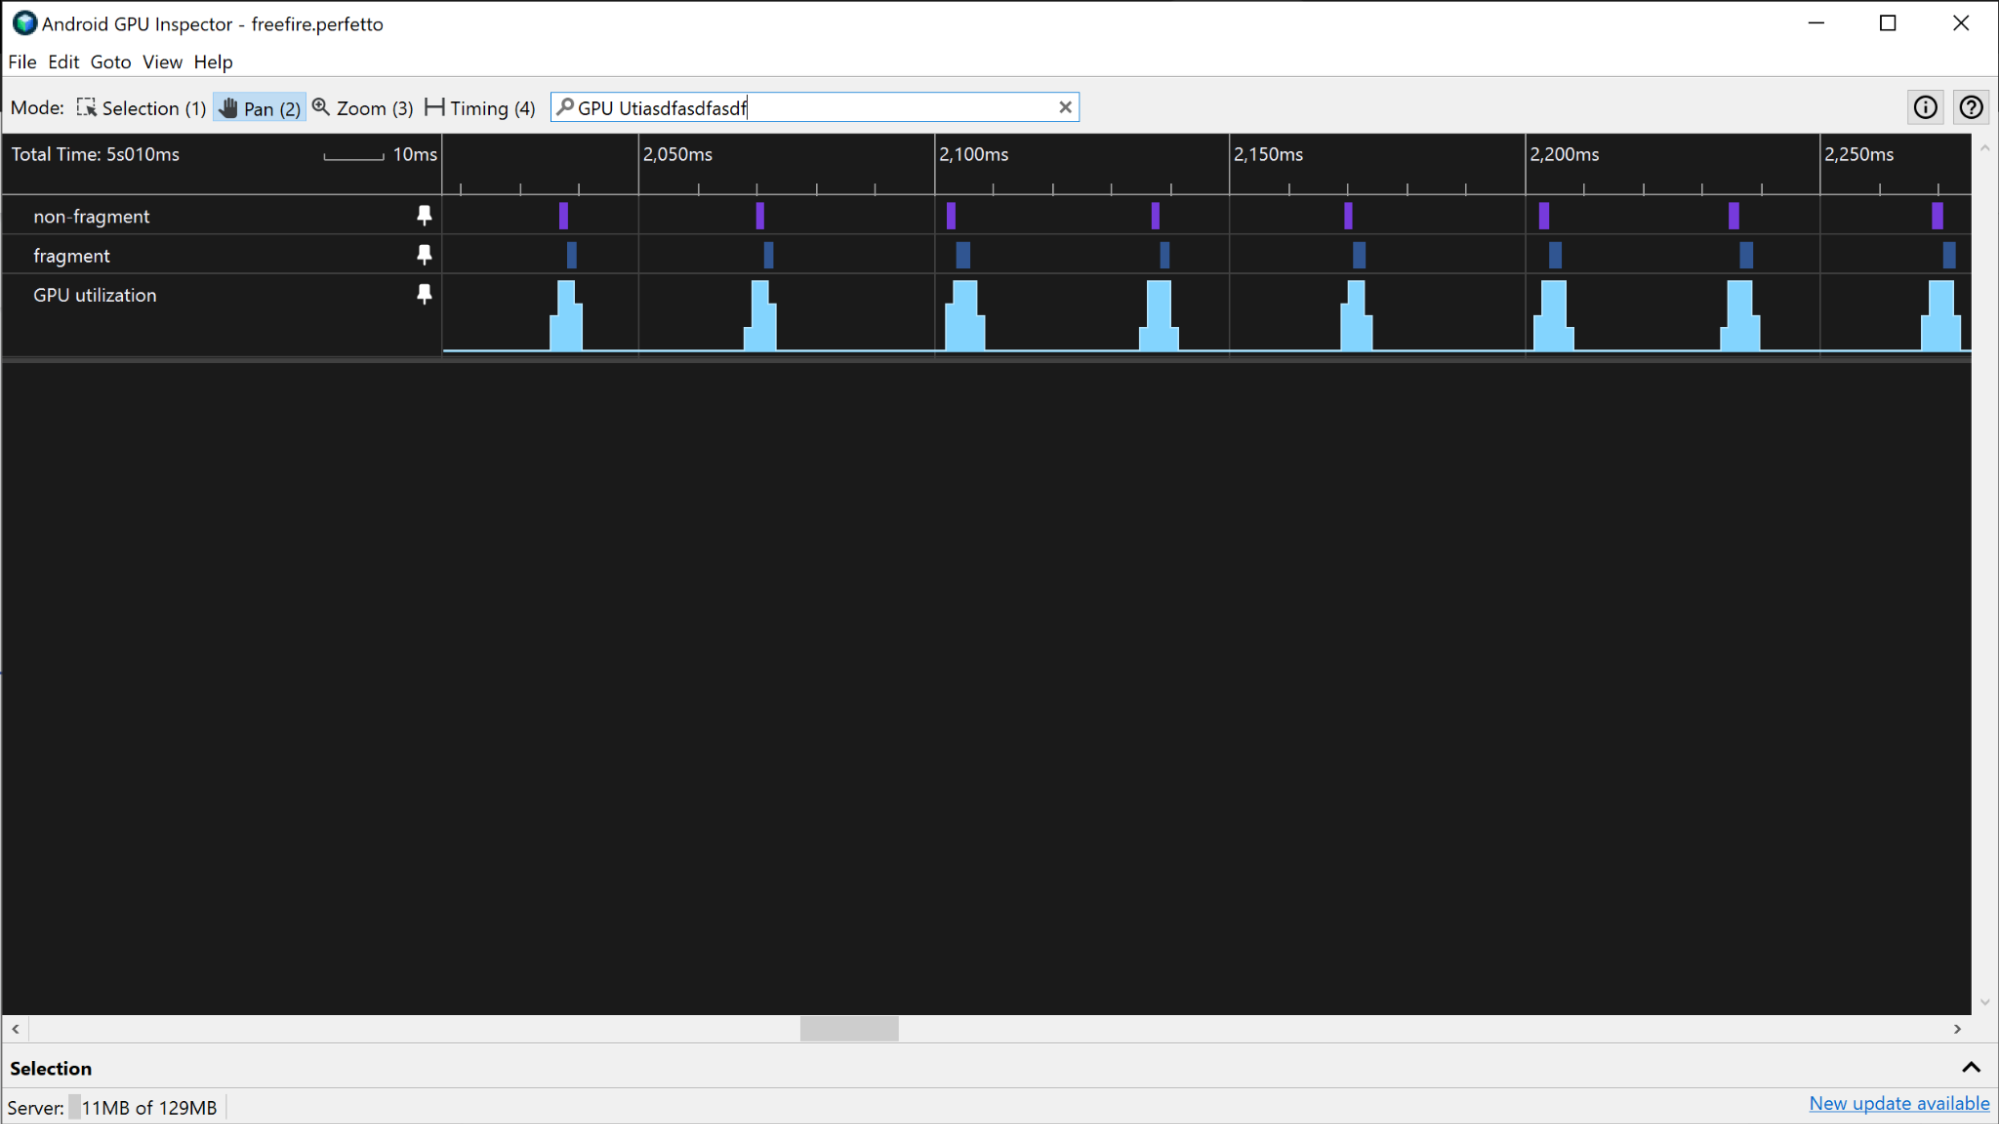
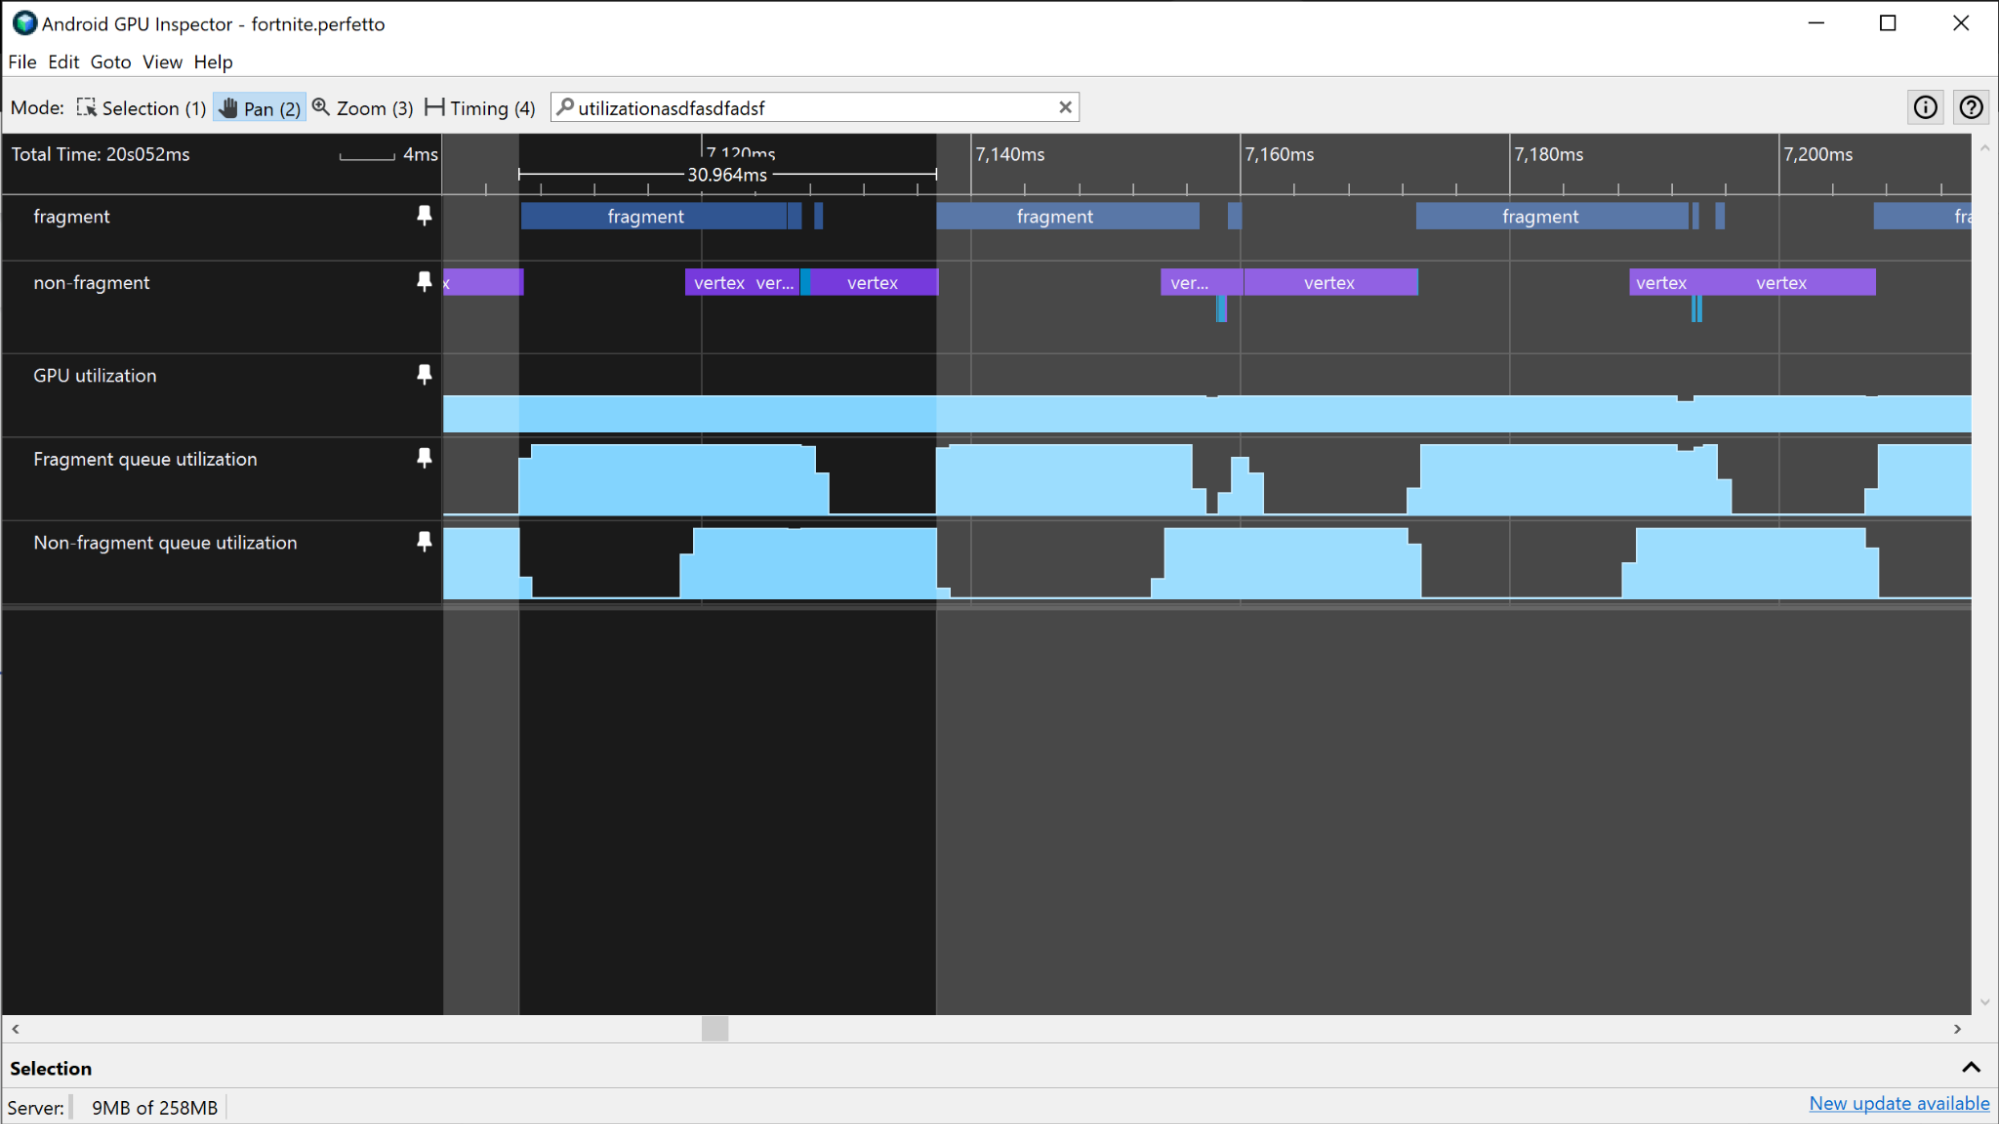
If the app is more GPU-intensive, the GPU utilization can be consistently very high. In this case, you can use the fragment queue utilization and non-fragment queue utilization tracks to monitor GPU activity and estimate GPU frame times. By looking for patterns in fragment and non-fragment tracks, you can get a rough estimate of where the boundaries of a frame are, and use that to measure the GPU frame time.
Adreno devices
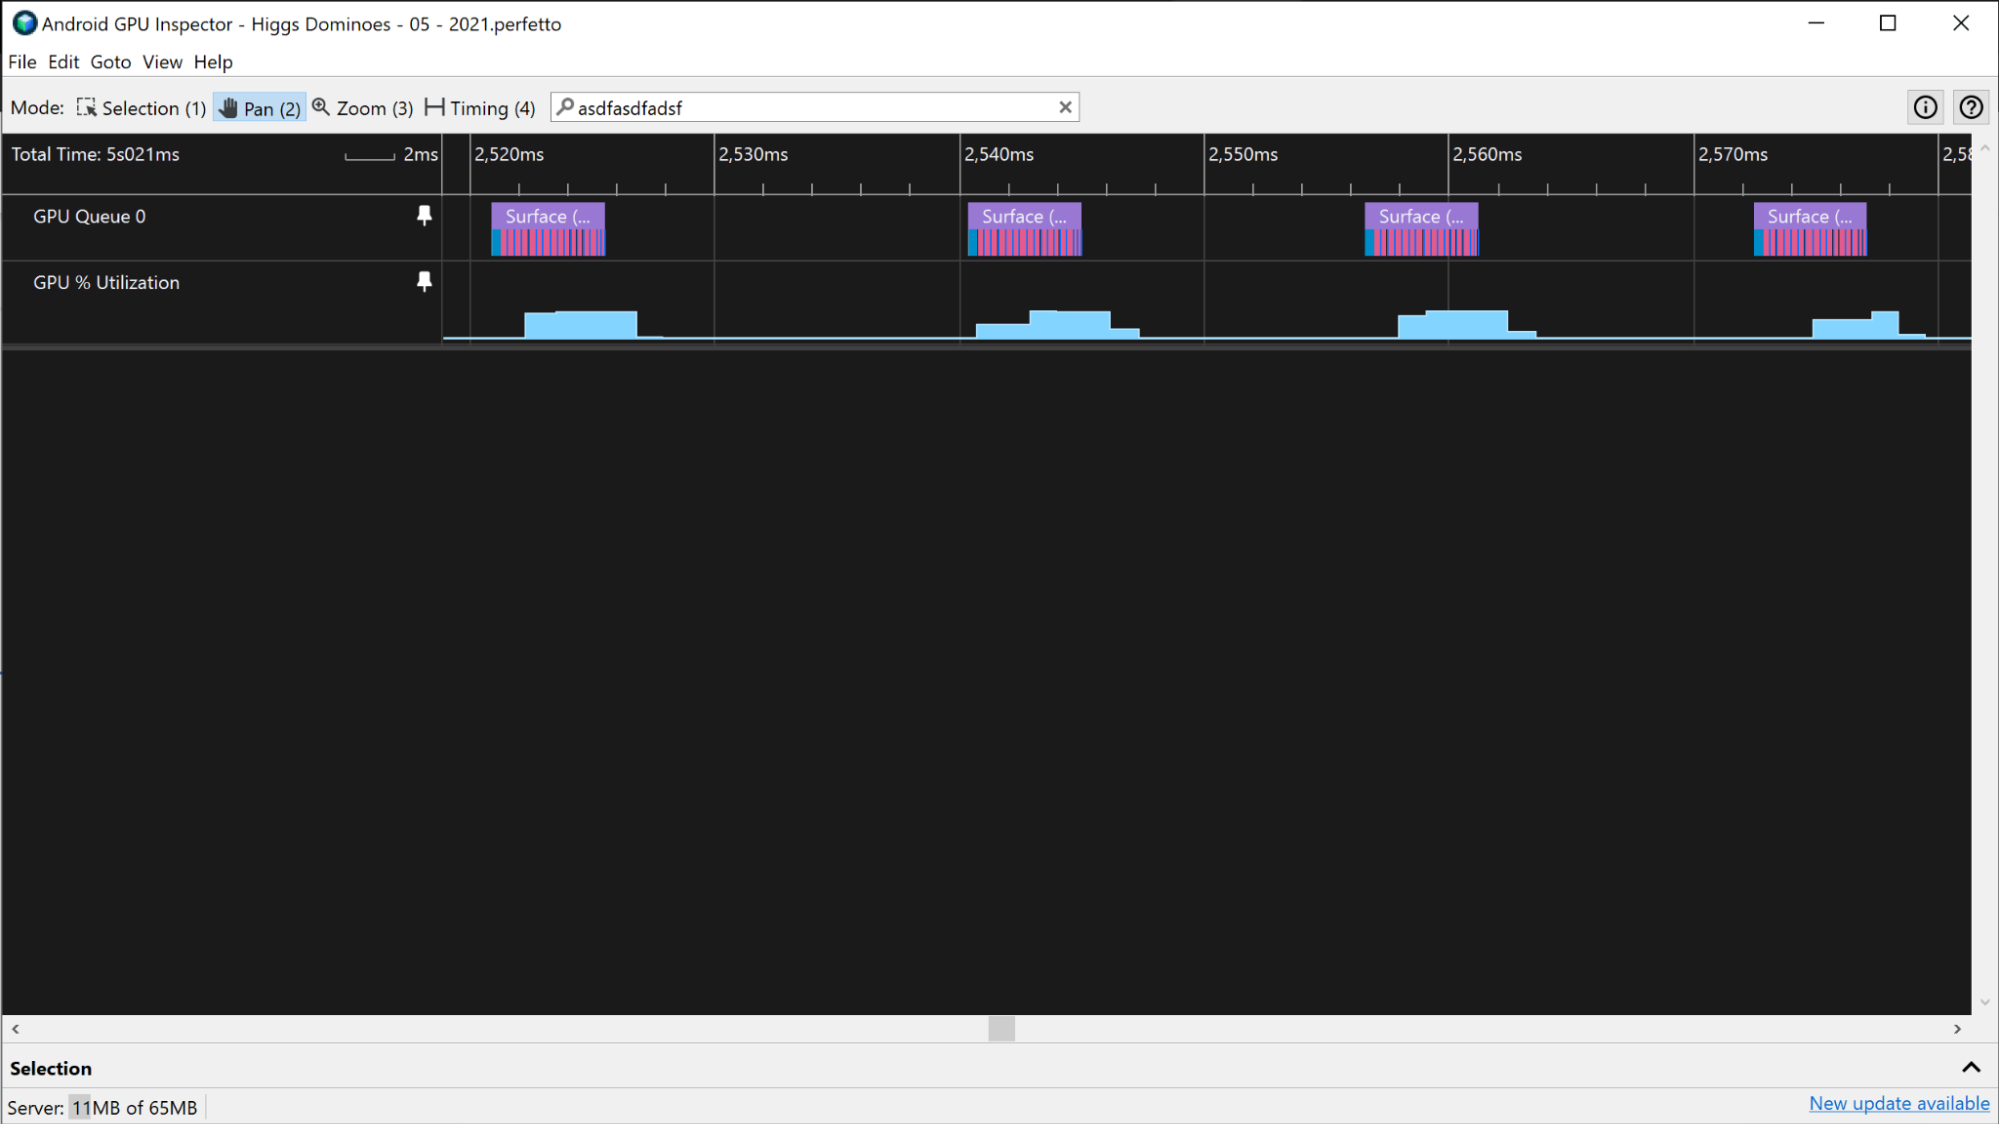
On Adreno devices, if the app is not GPU-intensive, you can estimate GPU frame times the same way you can with Mali devices in the previous section.
If the app is more GPU-intensive, and the application has consistently high GPU utilization percentage, you can use the Vertex Instructions / Second and Fragment Instructions / Second tracks to estimate GPU frame times. By looking for patterns in the activity levels of these tracks, you can get a rough estimate of where the boundaries of a frame are, and use that to measure the GPU frame time.
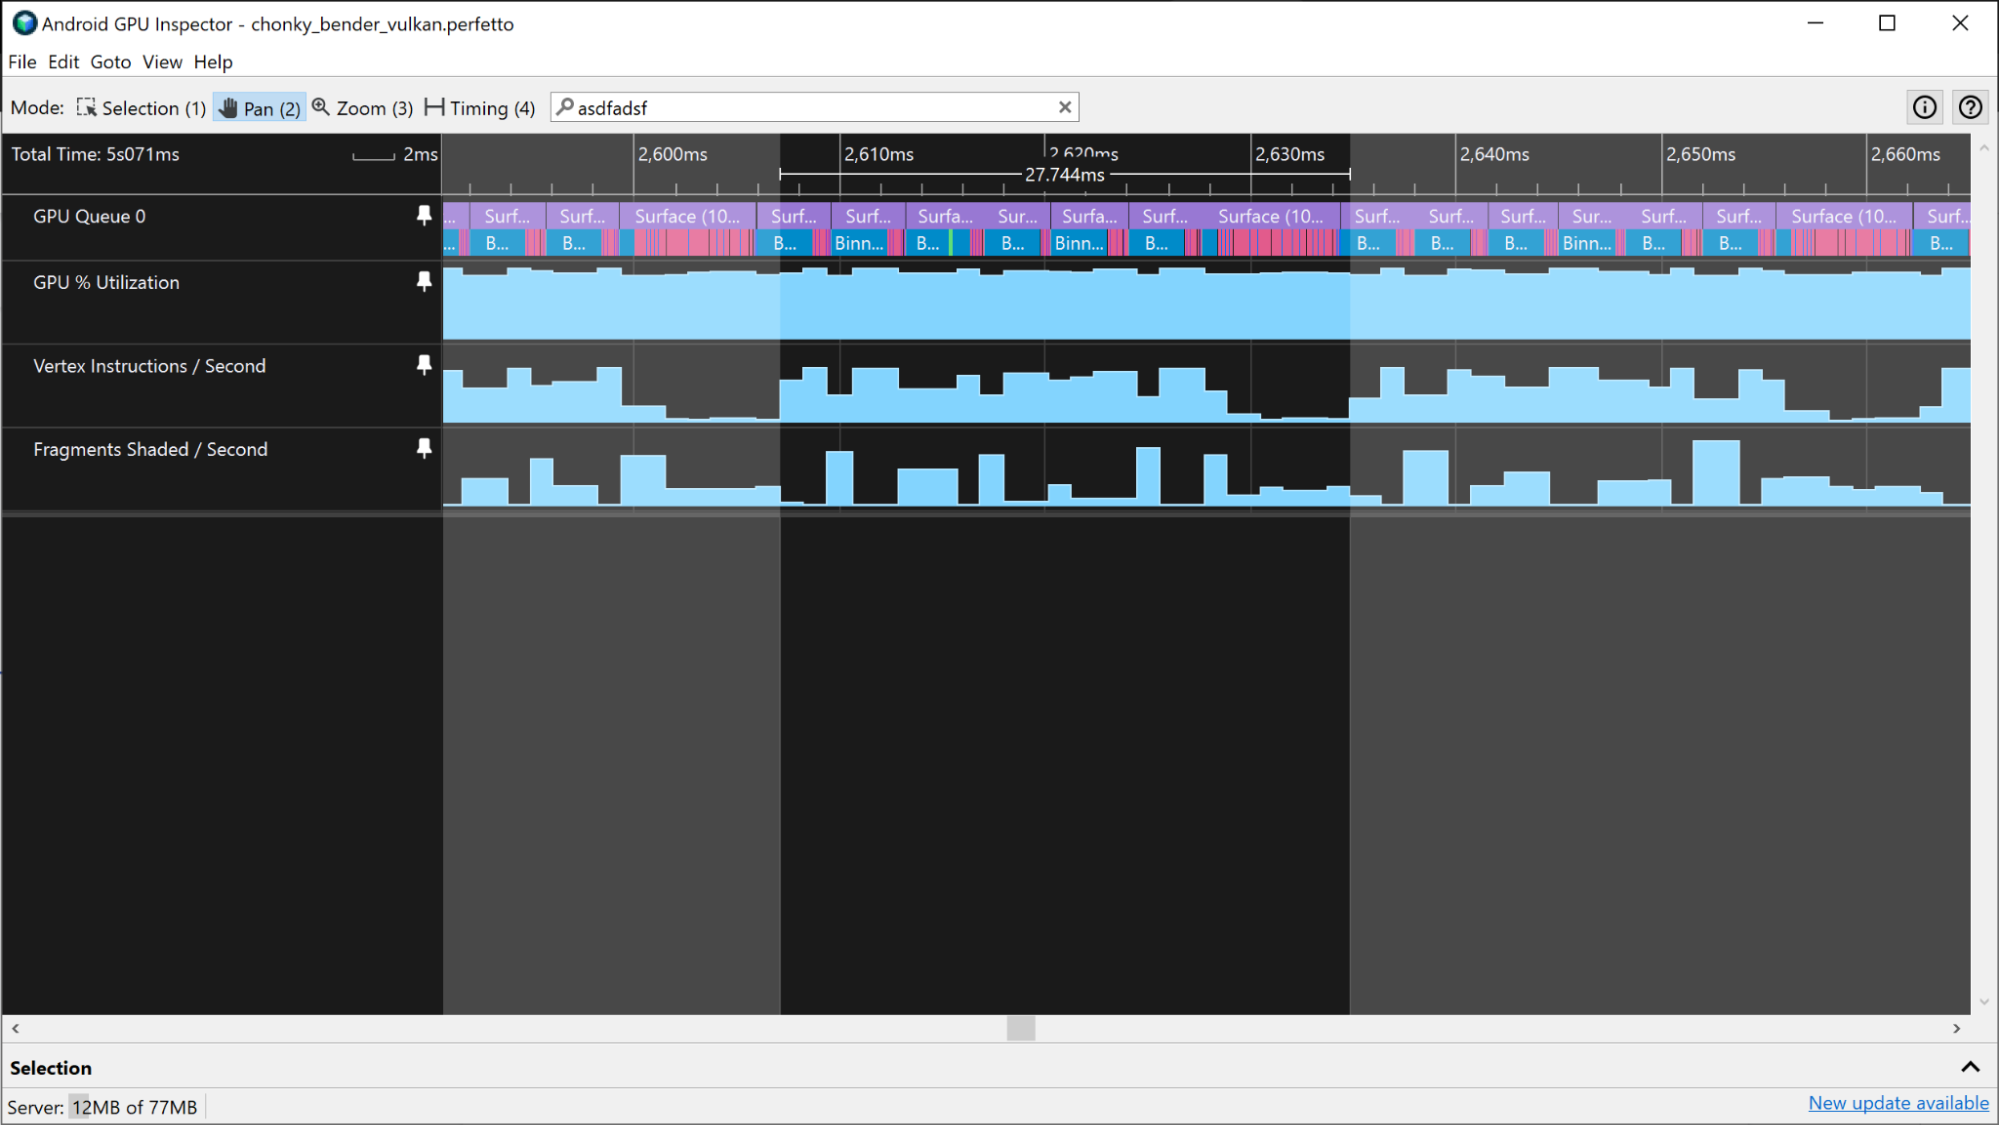
These other tracks may provide similar information:
- Vertices Shaded / Second
- Fragments Shaded / Second
- % Time Shading Vertices
- % Time Shading Fragments