
This topic describes how to perform system profiling and frame profiling on your Android app using Android GPU Inspector (AGI).
This quickstart is intended for developers that are familiar with graphics development on Android.
Computer requirements
The computer that runs AGI must meet these requirements:
One of the following operating systems is required:
Windows: Windows 7 or higher.
macOS: El Capitan (10.11) or higher.
Linux: Java 64-bit JDK or JRE 8 (or newer) is required; Ubuntu Trusty Tahr (14.04 or higher) is recommended.
Download and install AGI
Download and install AGI for your operating system.
Android app requirements
This section describes the requirements for the Android app that is being profiled:
Your Android app must be debuggable; the debuggable attribute in the Android manifest of the app must be set to
true. This attribute enables proper instrumentations from the graphics driver. For Vulkan applications, this attribute enables AGI to add its own Vulkan layer when the application starts.<application [...] android:debuggable="true">
If your app uses Vulkan natively, AGI also requires the following:
Your app must have Vulkan validation layers enabled. If they aren't enabled, you can run the following commands to force your app to run with the validation layers that are included in the AGI apk (
com.google.android.gapid.<abi>):app_package=<YOUR APP PACKAGE NAME HERE> abi=arm64v8a # Possible values: arm64v8a, armeabi-v7a, x86 adb shell settings put global enable_gpu_debug_layers 1 adb shell settings put global gpu_debug_app ${app_package} adb shell settings put global gpu_debug_layer_app com.google.android.gapid.${abi} adb shell settings put global gpu_debug_layers VK_LAYER_KHRONOS_validationWhen you're done profiling can disable these validation layers with the following commands:
adb shell settings delete global enable_gpu_debug_layers
adb shell settings delete global gpu_debug_app
adb shell settings delete global gpu_debug_layers
adb shell settings delete global gpu_debug_layer_app
Your app must not report any warnings or errors when it runs with the Vulkan validation layers enabled. Fix any Vulkan validation error before profiling.
If you are using beta GPU drivers, include the following metadata in the
<application>tag of the Android manifest:<meta-data android:name="com.android.graphics.developerdriver.enable" android:value="true" />
Android device requirements
AGI has the following Android device requirements:
A supported Android device running Android 11 or higher.
A USB cable.
adb debugging must be enabled and the device must be accessible through adb. If the Install via USB option is present, enable it.
Device validation
AGI requires a compatible GPU driver. To ensure it provides valid profiling data, AGI runs a validation check the first time you connect a new device, which takes about ten seconds. After passing the check, you can use the device to profile Android apps.
Do not disturb the device while validation is in progress. This may cause the device to fail validation. If a device fails validation but is set up correctly, you can retry validation by re-selecting the device.
Validation is a one-time step for a device, and results are cached for future use of AGI. However, AGI will run validation again if the device setup changes, such as if the GPU driver or Android version is updated.
If a device is listed as a supported device, you can expect AGI to pass validation. If the device is not listed, its GPU driver is most likely incompatible with AGI.
If your device is supported but fails validation
Make sure you've met all Android requirements and computer requirements described in the preceding sections, and that the device is properly connected to the computer with a USB cable.
If all of the requirements are met, file a issue in our GitHub repository describing the behavior.
If your device isn't supported
We are working with our OEM partners to add support for more devices. You can file an issue in our GitHub repository to request support for a device.
Capture profiling data
The following sections describe how to capture profiling data, and open the resulting trace file so you can analyze the results.
Configure Android settings
Before you begin profiling, you must configure these Android app and device settings, which specify the app and device to profile.
Using a USB cable, connect your Android device to your computer.
Launch AGI on your computer.
The first time you launch AGI, it displays the Welcome screen, which prompts you for the path to the adb executable. AGI saves these settings in the
.agicfile in yourHOMEfolder. If you've already done this, you can skip this step.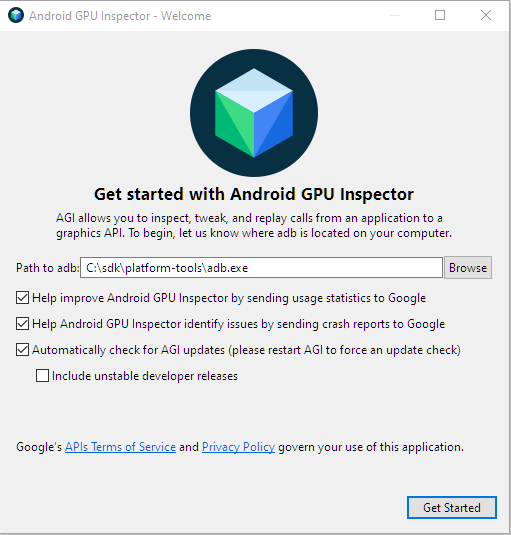
Figure 1: Welcome screen. Enter the path to the adb executable in the Path to adb field. The checkboxes following this field are optional.
Click Get Started to display the launch screen.
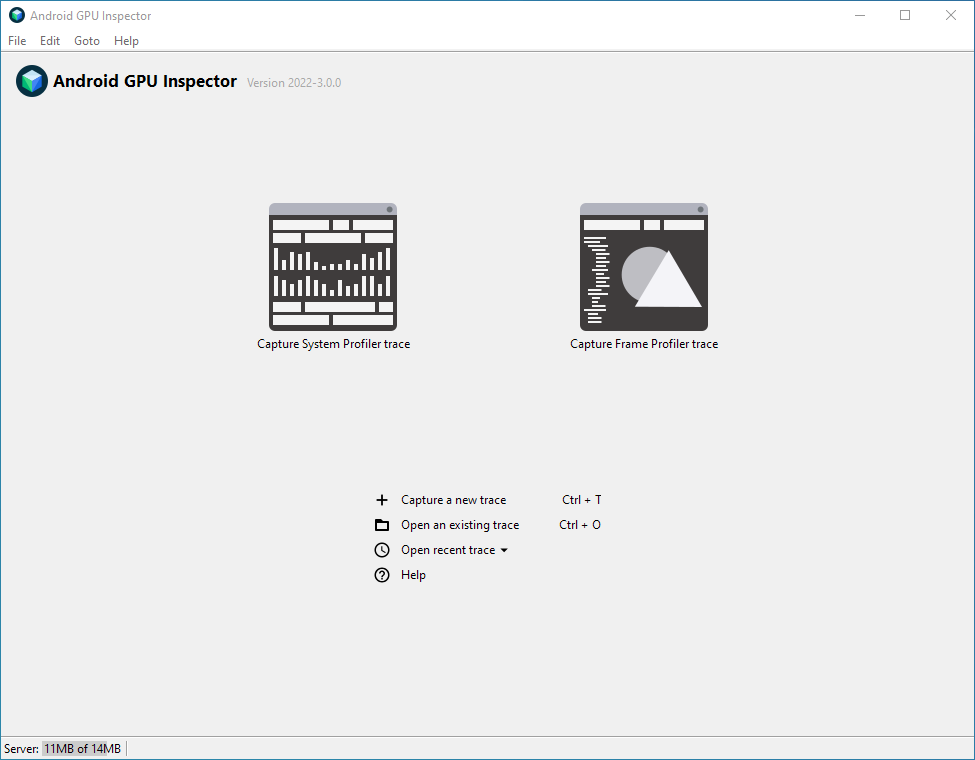
Figure 2: Android GPU Inspector main launch screen. In the launch screen, click Capture a new trace. This displays the Capture A New Trace dialog. Alternatively, you can click the Capture System Profile trace button.
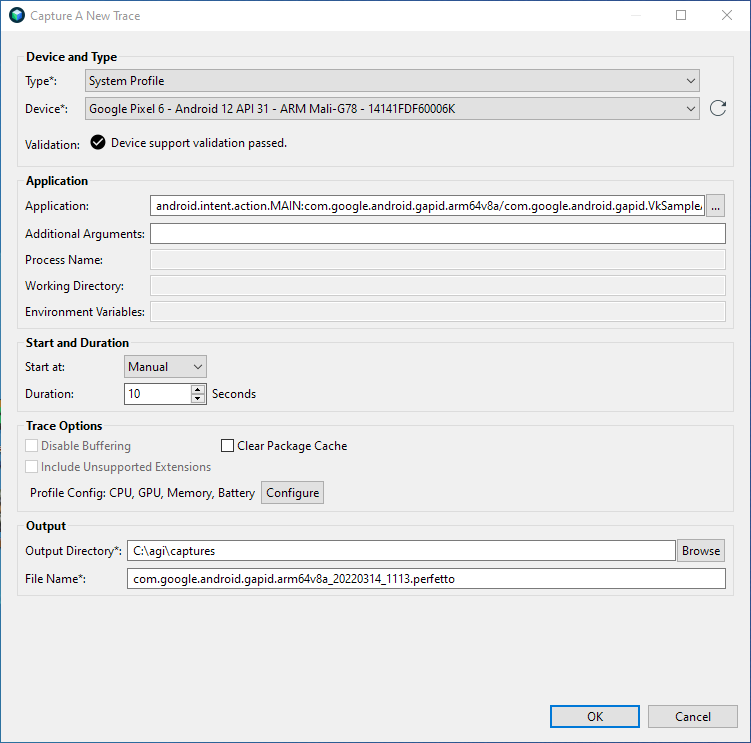
Figure 3: Capture A New Trace dialog. In the Device and Type section, select the Android device you want to profile. If it's not displayed in the Device list, click the reload arrow to refresh the list.
In the Application section, select the app you want to profile. If there is only one activity in the package, you can select the package instead of the activity.
AGI includes a sample Vulkan app. To use the sample app instead of your own, perform these steps:
Click the ... button next to the Application field.
This shows the Select an Application to Trace dialog, which displays a list of apps that are traceable on the selected device.
In the Filter text box, type
gapidto only display applications that containgapidin their package name.Expand the package and select com.google.android.gapid.VkSampleActivity, and then click OK.
This returns you to the Capture A New Trace dialog, with the Application field populated by the app you selected.
In the Application section, leave the other fields empty.
Click OK.
Now you're ready to use AGI to perform system and frame profiling.
Profile a system
To profile a system, perform these steps:
In the AGI launch screen, click Capture a new trace to display the Capture System Profile dialog.
In the Type list, select System profile.
In the Start and Duration section, set Start at to Manual, and Duration to
2.In the Trace Options section, click Configure. This displays a list of profiling options.
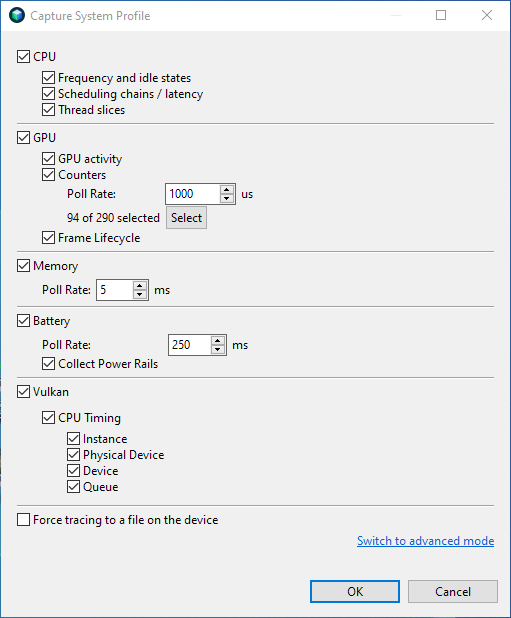
Figure 4: The profiling options in the Capture System Profile dialog. Select the profiling data you want to capture.
In the GPU section, click Select.
This displays a list of counters to select.
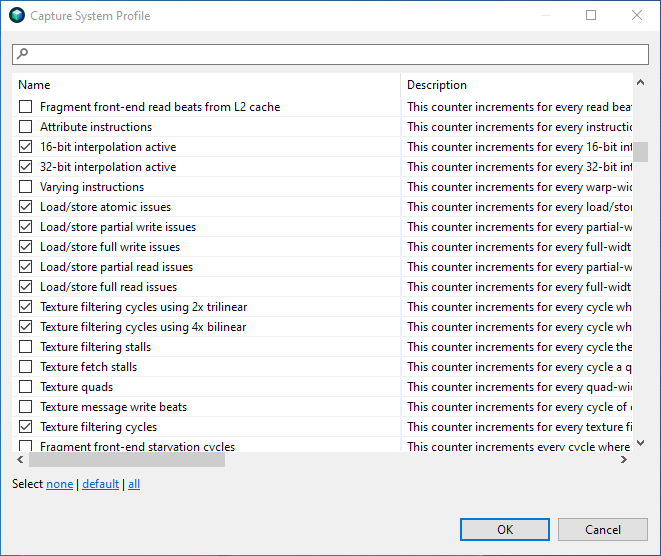
Figure 5: Selecting counters. Click default to select the set of default counters, and click OK to return the profiling options.
Click OK to return to the main Capture System Profile dialog.
In the Output section, select an Output Directory to store the the trace files that are generated during profiling. The File Name field should be auto-filled, but you can also edit it.
Click OK. This starts the selected app on the Android device, and displays a pop-up window with a Start button.
Click the Start button to start capturing profiling data, and wait a couple of seconds for the process to finish.
Click Open Trace. The initial view that is displayed is similar to systrace.
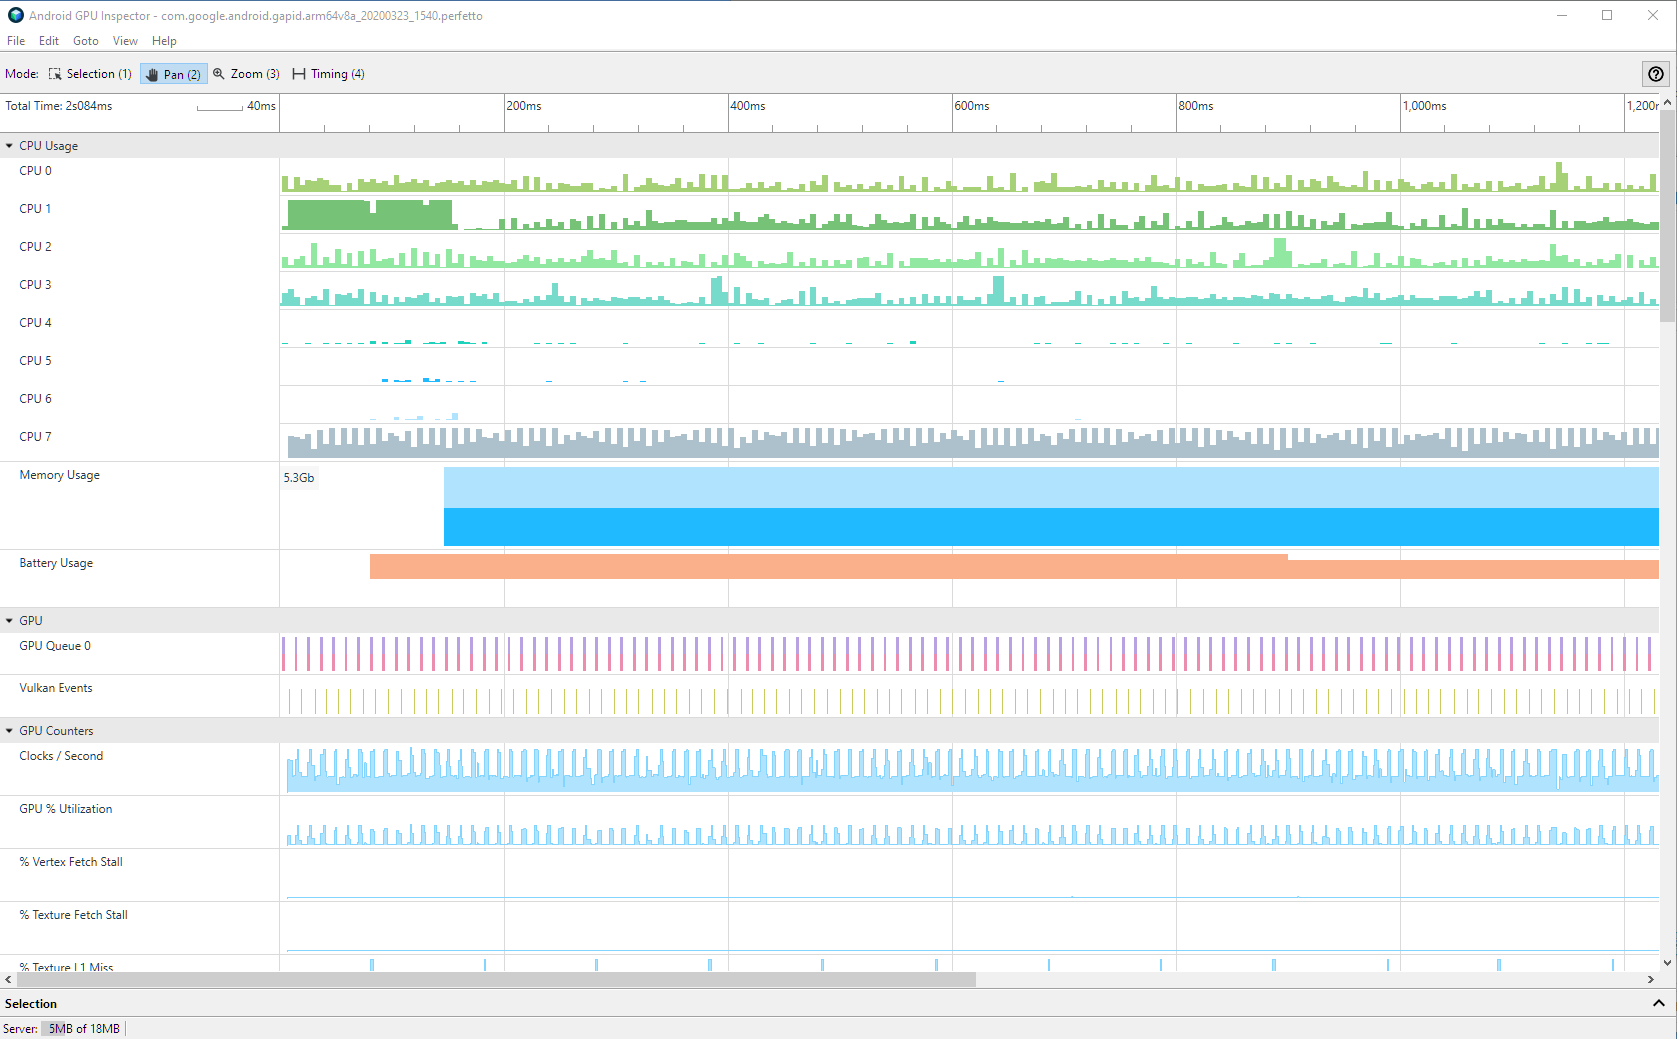
Figure 6: The System Profiler UI. In addition to the data available in systrace, AGI also shows GPU performance information. For more information about viewing system profiling data, see View an AGI system profile.
For information about additional settings, see system profiling options.
Profile a frame
To profile an individual frame from your app, perform these steps:
In the AGI launch screen, click Capture a new trace to display the Capture A New Trace dialog. Alternatively, you can click the Capture Frame Profile trace button.
In the Type list, select Vulkan or OpenGL on ANGLE depending on which Graphics API your app uses. Make sure you're choosing the right one, otherwise AGI won't capture any graphics commands.
In the Start and Duration section, set Start at to Manual. If you clicked the Capture Frame Profile trace button, this step is already completed.
In the Output section, select an Output Directory to store the trace files. The File Name field should be auto-filled, but you can also edit it.
Optional: Some apps spawn a different process that does all the graphics processing. To capture that process, specify its name.
Click OK. This starts your app on the Android device, and displays a pop-up window with a Start button.
Click the Start button and wait a few of seconds for profiling to complete.
Click Open Trace to view the profiling data. For information about each pane in the Frame Profiler UI, see the Frame profiling overview.
For information about additional settings, see frame profiling options.