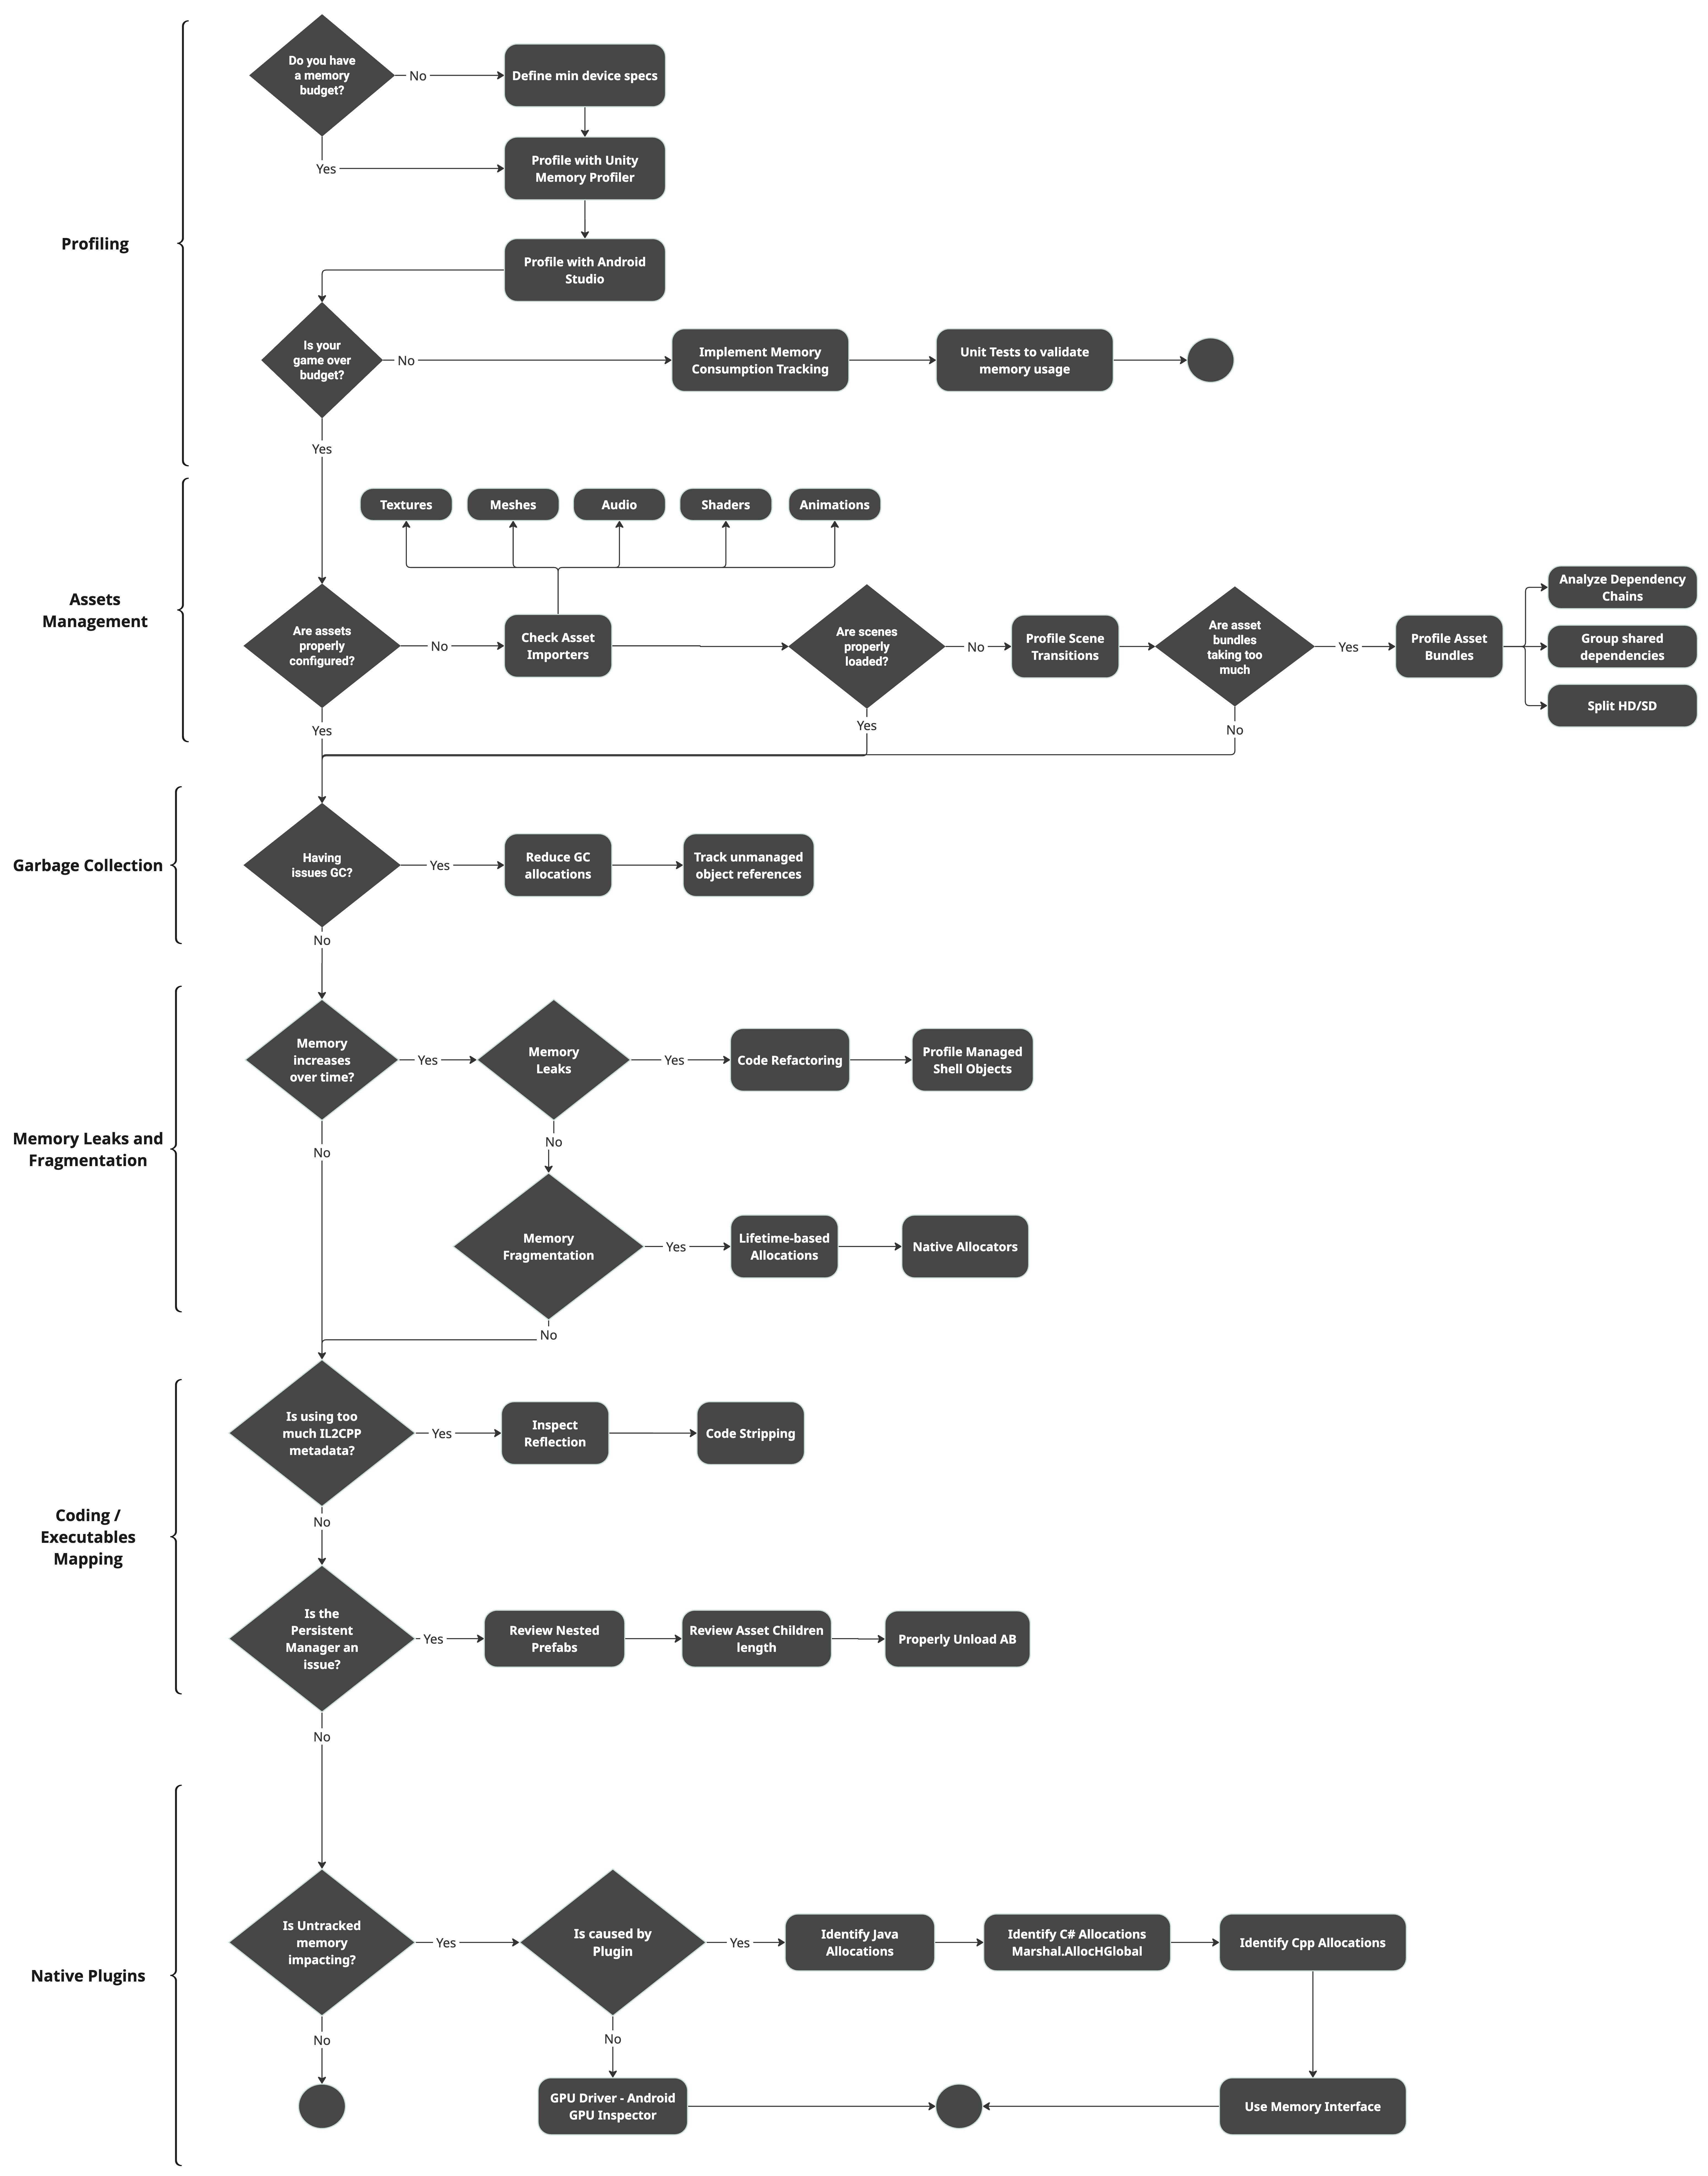
Solving LMKs in your Unity game is a systematic process:

Obtain a memory snapshot
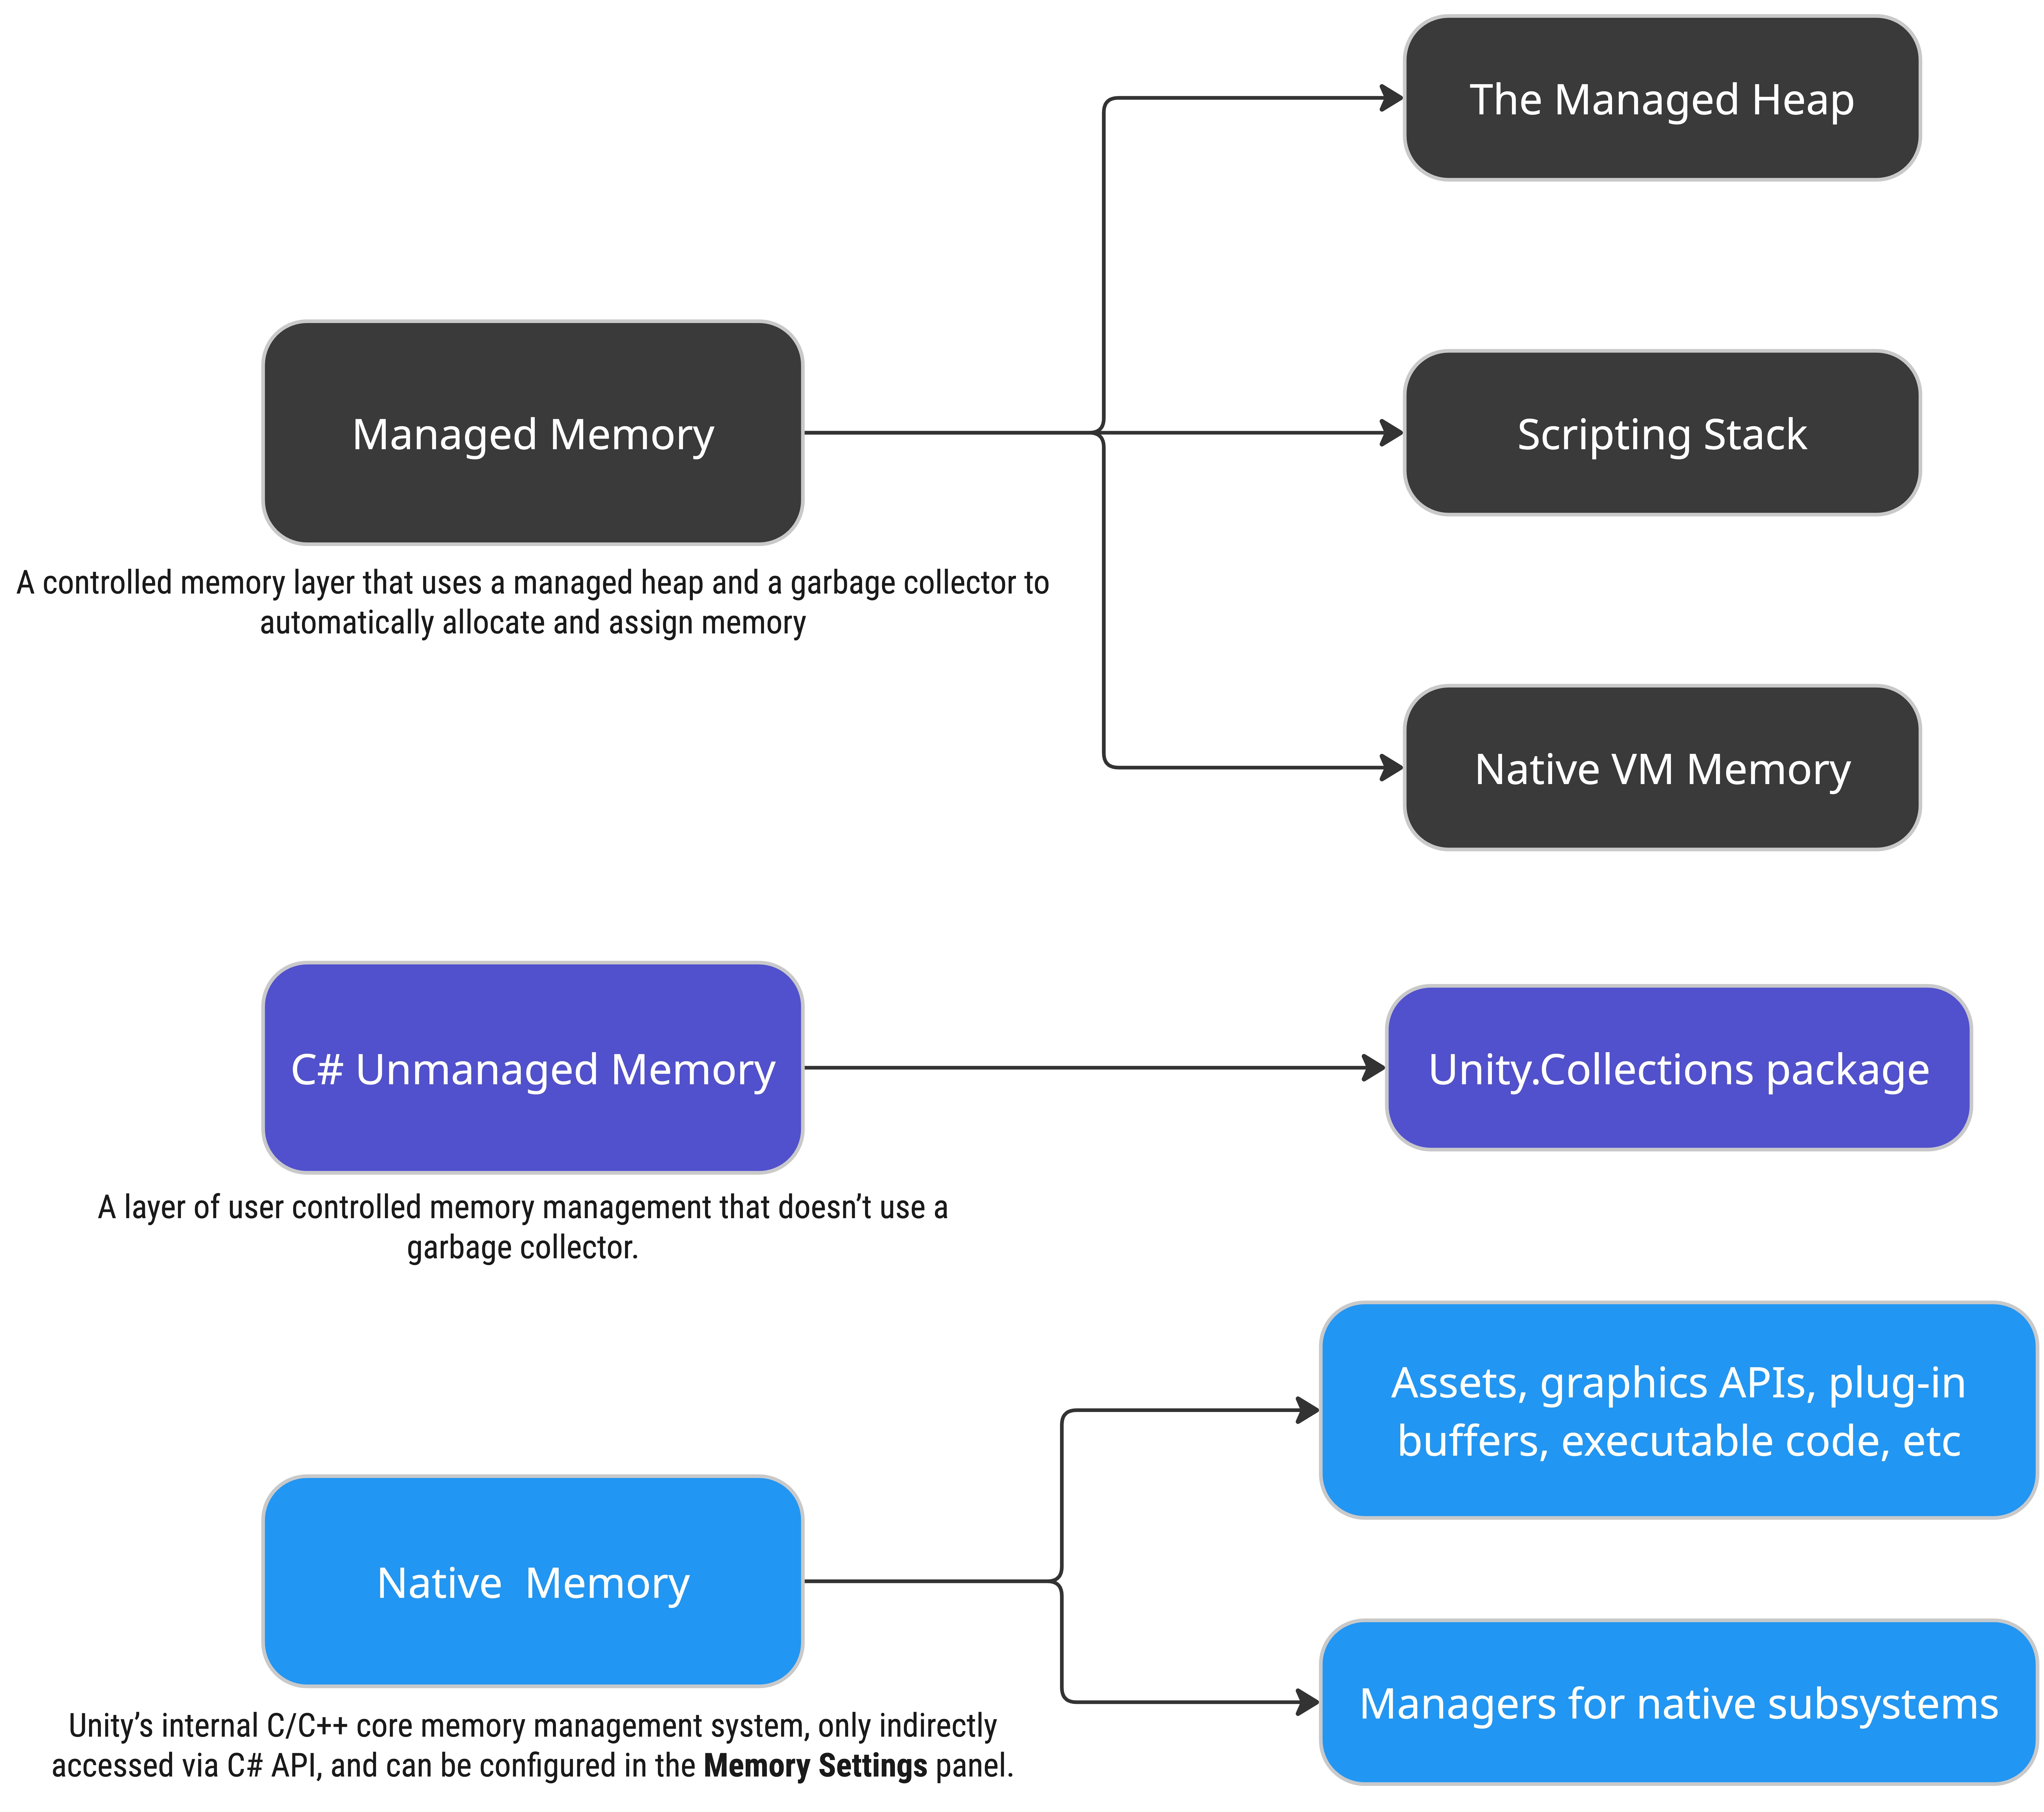
Use the Unity Profiler to get a Unity-managed memory snapshot. Figure 2 shows the memory management layers Unity uses to handle memory in your game.

Managed memory
Unity's memory management implements a controlled memory layer that uses a managed heap and a garbage collector to allocate and assign memory automatically. The managed memory system is a C# scripting environment based on Mono or IL2CPP. The benefit of the managed memory system is that it utilizes a garbage collector to automatically free memory allocations.
C# unmanaged memory
The unmanaged C# memory layer provides access to the native memory layer, enabling precise control over memory allocations while using C# code. This memory management layer can be accessed through the Unity.Collections namespace and by functions such as UnsafeUtility.Malloc and UnsafeUtility.Free.
Native memory
Unity's internal C/C++ core uses a native memory system to manage scenes, assets, graphics APIs, drivers, subsystems, and plug-in buffers. While direct access is restricted, you can safely manipulate data with Unity's C# API and benefit from efficient native code. Native memory rarely requires direct interaction, but you can monitor native memory impact on performance using the Profiler and adjust settings to optimize performance.
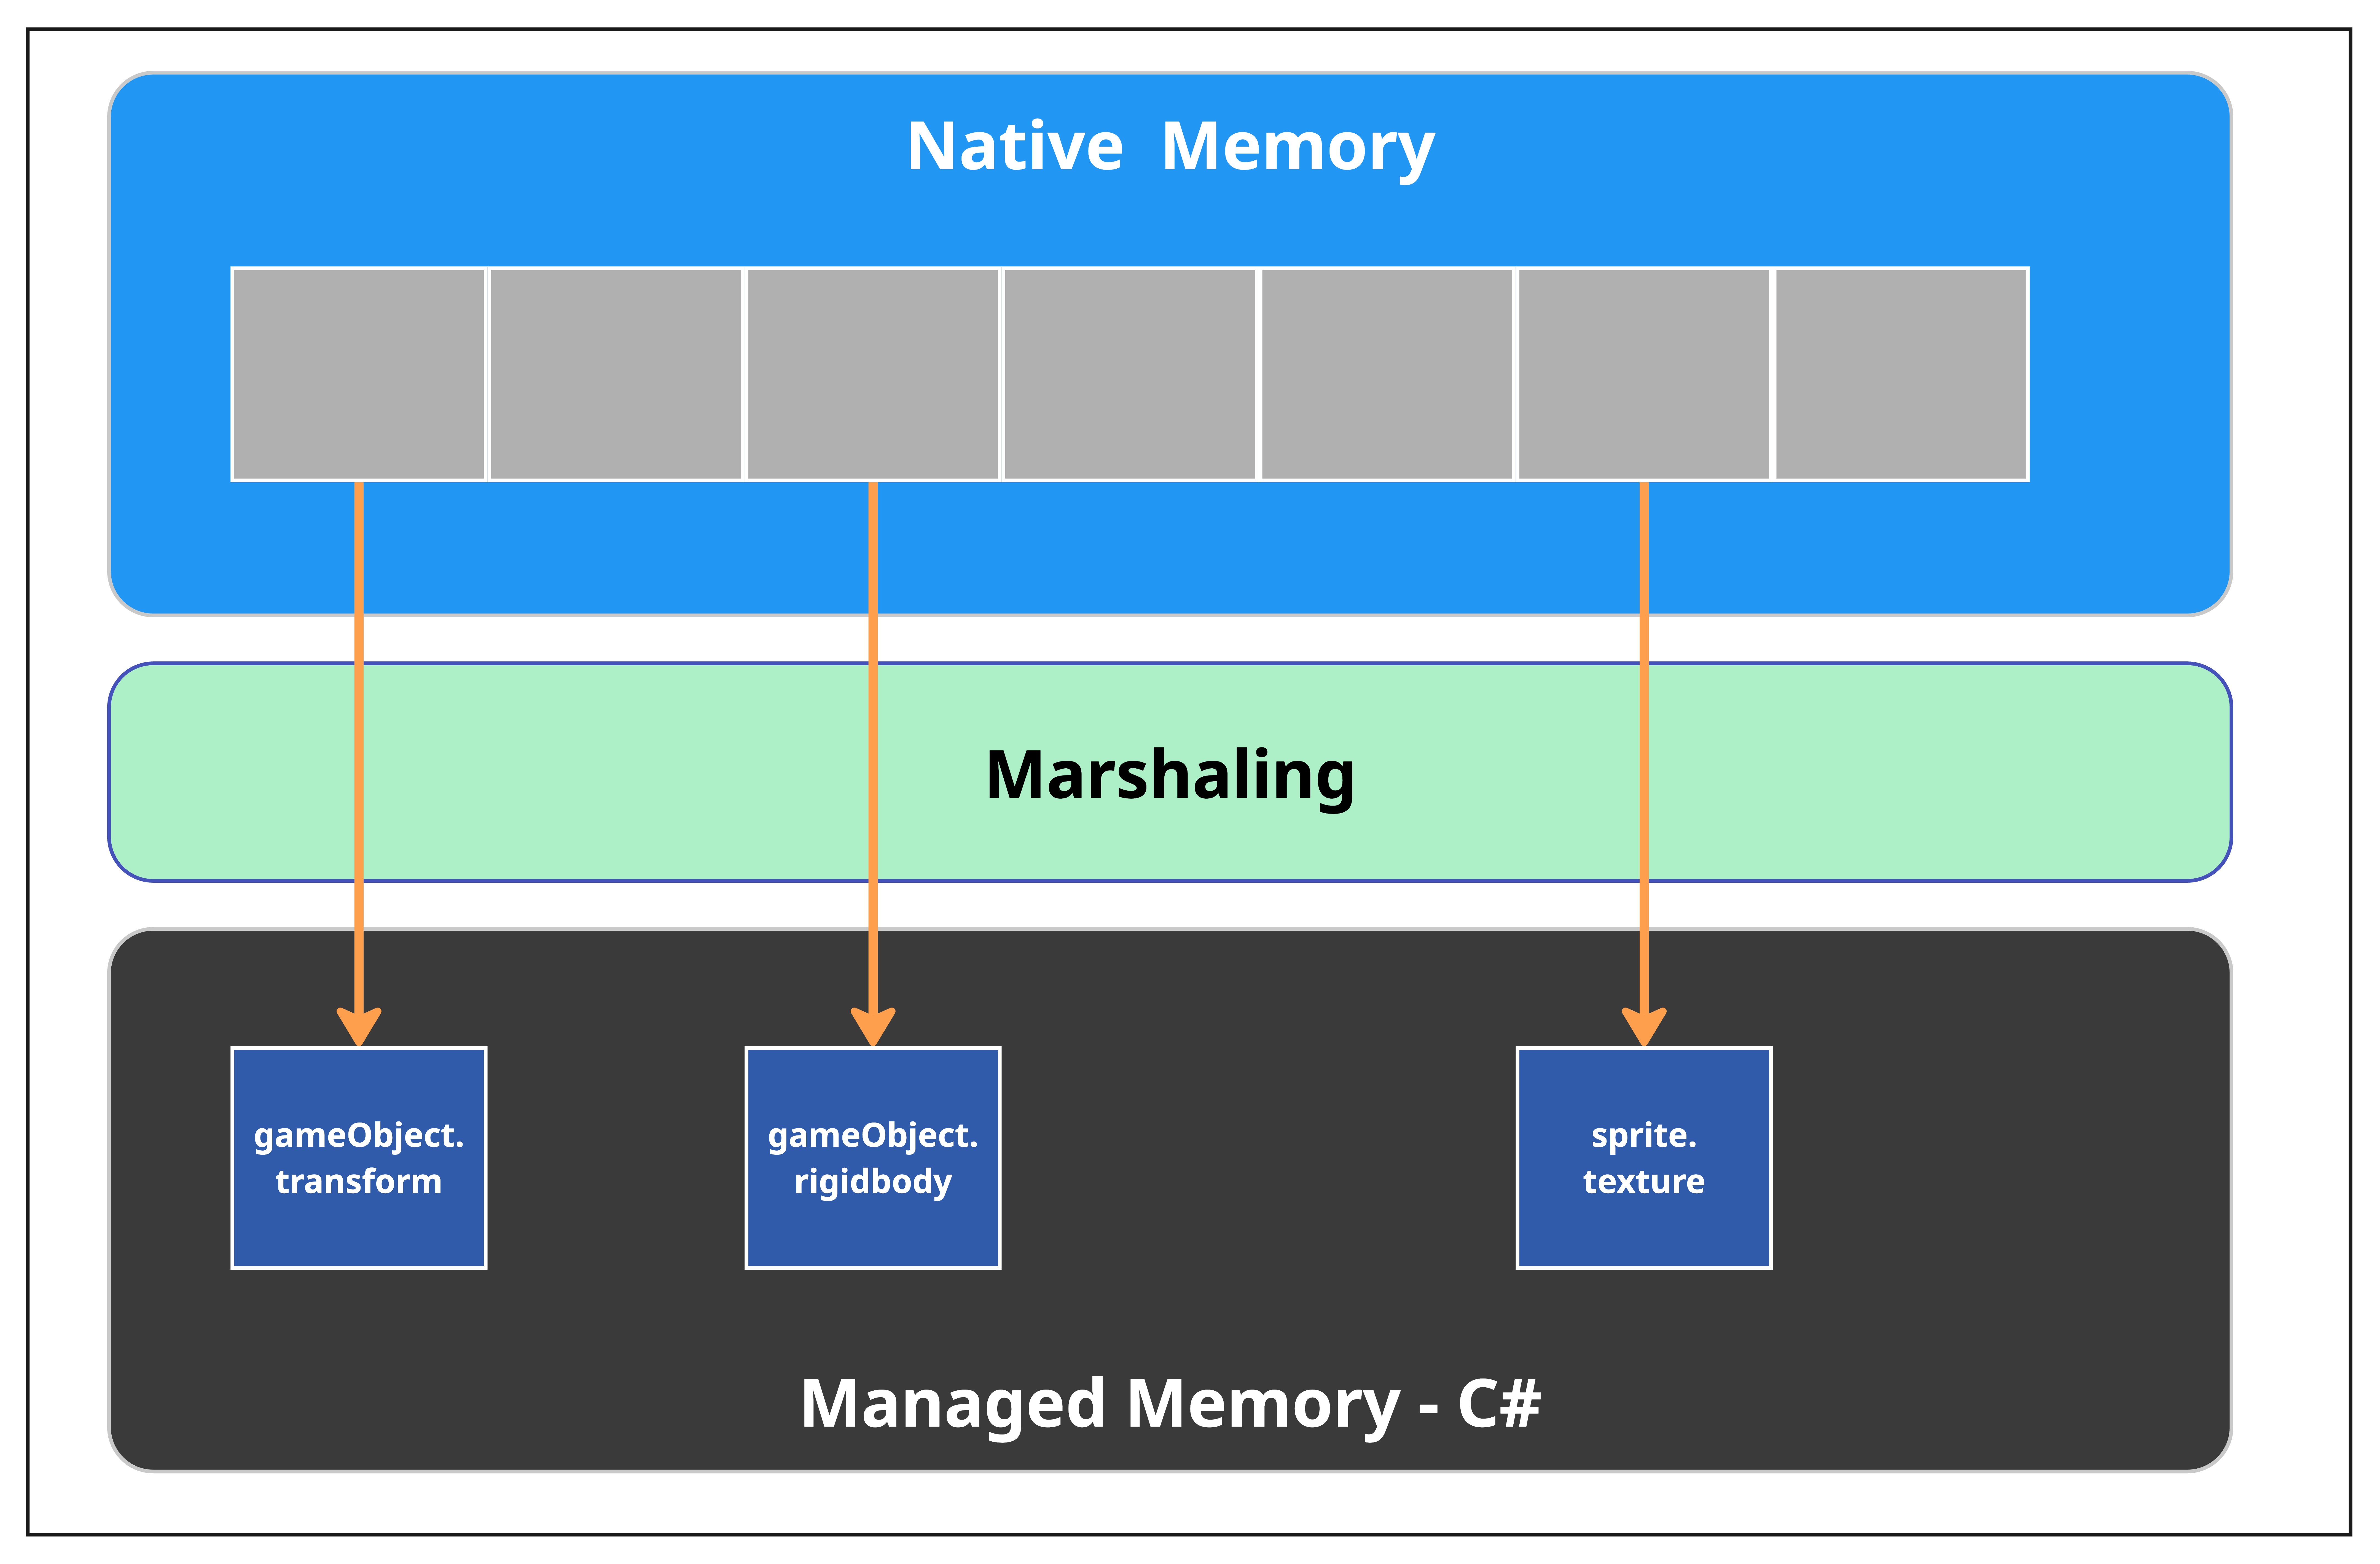
Memory is not shared between C# and native code as shown in figure 3. Data required by C# is allocated in the managed memory space each time it is needed.
For the managed game's code (C#) to access the engine's native memory data, for instance, a call to GameObject.transform makes a native call to access memory data in the native area and then returns values to C# using Bindings. Bindings ensure proper calling conventions for each platform and handle automatic marshalling of managed types into their native equivalents.
This happens only the first time, as the managed shell for accessing the transform property is preserved in native code. Caching the transform property can reduce the number of back-and-forth calls between managed and native code, but the usefulness of caching depends on how often the property is used. Also, note that Unity does not copy parts of native memory into managed memory when you access these APIs.

To learn more, refer to Memory in Unity introduction.
In addition, establishing a memory budget is crucial to keep your game running smoothly, and implementing a memory consumption analytics or reporting system ensures that each new release does not exceed the memory budget. Integrating Play Mode tests with your continuous integration (CI) to verify memory consumption in specific areas of the game is another strategy to gain better insight.
Manage assets
This is the most impactful and actionable part of memory consumption. Profile as early as possible.
Memory usage in Android games can vary significantly depending on the type of game, number and types of assets, and memory optimization strategies. However, common contributors to memory usage typically include textures, meshes, audio files, shaders, animations, and scripts.
Detect duplicated assets
The first step is to detect poorly configured assets and duplicated assets using the memory profiler, a build report tool, or the Project Auditor.
Textures
Analyze your game's device support and decide the correct texture format. You can split the texture bundles for high-end and low-end devices using Play Asset Delivery, Addressable, or a more manual process with an AssetBundle.
Follow the most well-known recommendations available in the Optimize Your Mobile Game Performance and in the Optimising Unity Texture Import Settings discussion post. Then try these solutions:
Compress textures with ASTC formats for a reduced memory footprint and experiment with a higher block rate, such as 8x8.
If using ETC2 is required, pack your textures in Atlas. Placing multiple textures into a single texture ensures its Power of Two (POT), can reduce draw calls, and can speed up rendering.
Optimize RenderTarget texture format and size. Avoid unnecessarily high-resolution textures. Using smaller textures on mobile devices saves memory.
Use Texture channel packing to save texture memory.
Meshes and models
Start by checking the fundamental settings (page 27) and verify these mesh importing settings:
- Merge redundant and smaller meshes.
- Reduce the vertex count for objects in scenes (for example, static or distant objects).
- Generate Level of Detail (LOD) groups for high-geometry assets.
Materials and shaders
- Strip unused shader variants programmatically during the build process.
- Consolidate frequently used shader variants into uber shaders to avoid shader duplication.
- Enable dynamic shader loading to address the large memory footprint of preloaded shaders in VRAM/RAM. However, pay attention if shader compilation is causing frame hiccups.
- Use dynamic shader loading to prevent all the variants from being loaded. For more information, refer to the Improvements to shader build times and memory usage blog post.
- Use material instancing properly by leveraging
MaterialPropertyBlocks.
Audio
Start by checking the fundamental settings (page 41), and verify these mesh importing settings:
- Remove unused or redundant
AudioClipreferences when employing third-party audio engines like FMOD or Wwise. - Preload audio data. Disable preload for clips that are not immediately required during runtime or scene startup. This helps reduce memory overhead during scene initialization.
Animations
- Adjust Unity's animation compression settings to minimize
the number of keyframes and eliminate redundant data.
- Keyframe reduction: Automatically removes unnecessary keyframes
- Quaternion compression: Compresses rotation data to reduce memory usage
You can adjust compression settings in the Animation Import Settings under the Rig or Animation tab.
Reuse animation clips instead of duplicating animation clips for different objects.
Use Animator Override Controllers to reuse an Animator Controller and replace specific clips for different characters.
Bake physics-based animations: If your animations are physics driven or procedural, bake them into animation clips to avoid runtime calculations.
Optimize skeleton rig: Use fewer bones in your rig to reduce complexity and memory consumption.
- Avoid excessive bones for small or static objects.
- If certain bones are not animated or needed, remove them from the rig.
Reduce animation clip length.
- Trim animation clips to include only the necessary frames. Avoid storing unused or excessively long animations.
- Use looping animations instead of creating long clips for repeated movements.
Ensure only one animation component is attached or activated. For example, disable or remove Legacy animation components if you're using Animator.
Avoid using the Animator if it's unnecessary. For simple VFX, use tweening libraries or implement the visual effect in a script. The animator system can be resource intensive, particularly on low-end mobile devices.
Use the Job System for animations when handling a large number of animations, as that system has been fully redesigned to be more memory efficient.
Scenes
When new scenes are loaded, they bring in assets as dependencies. However, without proper asset lifecycle management, these dependencies are not monitored by reference counters. As a result, assets may remain in memory even after the unused scenes have been unloaded cause memory fragmentation.
- Use Unity's Object Pooling to reuse GameObject instances for
recurring gameplay elements because object pooling uses a stack to hold a
collection of object instances for reuse and is not thread safe. Minimizing
InstantiateandDestroyimproves both CPU performance and memory stability. - Unloading assets:
- Unload assets strategically during less critical moments, like splash screens or loading screens.
- Frequent use of
Resources.UnloadUnusedAssetscauses spikes in CPU processing due to large internal dependency monitoring operations. - Check for large CPU spikes in the GC.MarkDependencies
profile marker.
Remove or reduce its execution frequency, and manually unload specific
resources instead using Resources.UnloadAsset rather than
relying on the all-encompassing
Resources.UnloadUnusedAssets().
- Restructure scenes rather than constantly using Resources.UnloadUnusedAssets.
- Calling
Resources.UnloadUnusedAssets()forAddressablescan unintentionally unload dynamically loaded bundles. Carefully manage the lifecycle of dynamically loaded assets.
Miscellaneous
Fragmentation caused by scene transitions — When the method
Resources.UnloadUnusedAssets()is called, Unity does the following:- Frees memory for assets no longer in use
- Runs a garbage collector–like operation to check the managed and native object heap for unused assets and unloads them
- Cleans up texture, mesh, and asset memory provided that no active reference exists
AssetBundleorAddressable- making changes in this area is complex and demands a collective effort from the team to implement the strategies. However, once these strategies are mastered, they significantly improve memory usage, reduce download size, and lower cloud costs. For more information on asset management in Unity with, seeAddressables.Centralized shared dependencies &mdash: Group shared dependencies, such as shaders, textures, and fonts, systematically into dedicated bundles or
Addressablegroups. This reduces duplication and ensures that unnecessary assets are unloaded efficiently.Use
Addressablesfor dependency tracking - Addressables simplify loading and unloading can automatically unload dependencies that are no longer referenced. Transitioning toAddressablesfor content management and dependency resolution may be a viable solution, depending on the game's specific case. Analyze dependency chains with the Analyze tool to identify unnecessary duplicates or dependencies. Alternatively, refer to the Unity Data Tools if you're using AssetBundles.TypeTrees- if your game'sAddressablesandAssetBundlesare built and deployed using the same version of Unity as the player and do not require backward compatibility with other player builds, consider disabling writingTypeTree, which should reduce bundle size and serialized file object memory footprint. Modify the build process in the local Addressables package setting ContentBuildFlags to DisableWriteTypeTree.
Write garbage collector–friendly code
Unity utilizes garbage collection (GC) to manage memory by automatically identifying and freeing up unused memory. While GC is essential, it can cause performance issues (for example, frame rate spikes) if not handled properly, as this process can momentarily pause the game, leading to performance hiccups and a suboptimal user experience.
Refer to the Unity manual for useful techniques on reducing the frequency of managed heap allocations and to the UnityPerformanceTuningBible, page 271, for examples.
Reduce garbage collector allocations:
- Avoid LINQ, lambdas, and closures, which allocate heap memory.
- Use
StringBuilderfor mutable strings in place of string concatenation. - Reuse collections by calling
COLLECTIONS.Clear()rather than re-instantiating them.
More information is available in the Ultimate Guide to Profiling Unity games e-book.
Manage UI canvas updates:
- Dynamic changes to UI elements — When UI elements like Text, Image, or
RectTransformproperties are updated (for example, changing text content, resizing elements, or animating positions), the engine may allocate memory for temporary objects. - String allocations — UI elements like Text often require string updates, since strings are immutable in most programming languages.
- Dirty canvas — When something on a canvas changes (for example, resizing, enabling and disabling elements, or modifying layout properties), the entire canvas or a portion of it may be marked as dirty and be rebuilt. This can trigger the creation of temporary data structures (for example, mesh data, vertex buffers, or layout calculations), which adds to garbage generation.
- Comples or frequent updates — If the canvas has a large number of elements or is updated frequently (for example, every frame), these rebuilds can lead to significant memory churn.
- Dynamic changes to UI elements — When UI elements like Text, Image, or
Enable incremental GC to reduce large collection spikes by spreading allocation cleanups over multiple frames. Profile to verify whether this option improves your game's performance and memory footprint.
If your game requires a controlled approach, set the garbage collection mode to manual. Then, on a level change or at another moment without active gameplay, call the garbage collection.
Invoke manual garbage collection GC.Collect() calls for game state transitions (for example, level switching).
Optimize arrays starting from simple code practices and, if necessary, by using native arrays or other native containers for large arrays.
Monitor managed objects using tools like the Unity Memory Profiler to track unmanaged object references that persist after destruction.
Use a Profiler Marker to submit to the Performance Reporting Tool for an automated approach.
Avoid memory leaks and fragmentation
Memory leaks
In C# code, when a reference to a Unity Object exists after
the object has been destroyed, the managed wrapper object, known as the Managed
Shell, remains in memory. The native memory associated with the
reference is released when the scene is unloaded or when the GameObject the
memory is attached to, or any of its parent objects, are destroyed through the
Destroy() method. However, if other references to the Scene or GameObject were
not cleared, the managed memory may persist as a Leaked Shell
Object. For further details on Managed Shell Objects, consult
the Managed Shell Objects manual.
Additionally, memory leaks can be caused by event subscriptions, lambdas and closures, string concatenations, and improper management of pooled objects:
- To get started, see Find memory leaks to compare Unity memory snapshots properly.
- Check for event subscriptions and memory leaks. If objects subscribe to events (for example, by delegates or UnityEvents) but do not properly unsubscribe before being destroyed, the event manager or publisher may retain references to those objects. This prevents those objects from being garbage collected, leading to memory leaks.
- Monitor global or singleton class events that aren't unregistered on object destruction. For example, unsubscribe or unhook delegates in object destructors.
- Ensure destruction of pooled objects fully nullifies references to text mesh components, textures, and parent GameObjects.
- Keep in mind that when comparing Unity Memory Profiler snapshots and observing a difference in memory consumption without a clear reason, the difference may be caused by the graphics driver or the operating system itself.
Memory fragmentation
Memory fragmentation occurs when many small allocations are freed in a random order. Heap allocations are made sequentially, which means new memory chunks are created when the previous chunk runs out of space. Consequently, new objects do not fill the empty areas of old chunks, leading to fragmentation. Additionally, large temporary allocations can cause permanent fragmentation for the duration of a game's session.
This issue is particularly problematic when short-lived large allocations are made near long-lived ones.
Group allocations based on their lifespan; ideally, long-lived allocations should be made together, early in the application's lifecycle.
Observers and event managers
- In addition to the problem mentioned in the (Memory Leaks)77 section, over time, memory leaks can contribute to fragmentation by leaving unused memory allocated to objects that are no longer in use.
- Ensure destruction of pooled objects fully nullifies references to
text mesh components, textures, and parent
GameObjects. - Event managers often create and store lists or dictionaries to manage event subscriptions. If these grow and shrink dynamically during runtime, they can contribute to memory fragmentation due to frequent allocations and deallocations.
Code
- Coroutines sometimes allocate memory, which can be easily avoided by caching the return statement of the IEnumerator instead of declaring a new one every time.
- Continuously monitor the lifecycle states of pooled objects to avoid keeping
UnityEngine.Objectghost references.
Assets
- Use dynamic fallback systems for text-driven game experiences to avoid preloading all fonts for multilanguage cases.
- Organize assets (for example, textures and particles) together by type and expected lifecycle.
- Condense assets with idle lifecycle attributes, like redundant UI images and static meshes.
Lifetime-based allocations
- Allocate long-lived assets at the start of the application lifecycle to ensure compact allocations.
- Use NativeCollections or custom allocators for memory-intensive or transient data structures (for example, physics clusters).
Code-related and executables memory action
Game executable and plugins also affect the memory usage.
IL2CPP Metadata
IL2CPP generates metadata for every type (for example, classes, generics, and delegates) at build time, which is then used at runtime for reflection, type checking, and other runtime-specific operations. This metadata is stored in memory and can contribute significantly to the total memory footprint of the application. IL2CPP's metadata cache makes a significant contribution to initialization and loading times. Additionally, IL2CPP doesn't deduplicate certain metadata elements (for example, generic types or serialized information), which can result in bloated memory usage. This is exacerbated by repetitive or redundant type usage in the project.
IL2CPP metadata can be reduced by:
- Avoiding the use of reflection APIs, as they can be a significant contributor to IL2CPP metadata allocations
- Disabling built-in packages
- Implementing Unity 2022 full generic sharing, which should help reduce the overhead caused by generics. However, to help reduce allocations even further, reduce the use of generics.
Code stripping
Beyond reducing the size of the build, code stripping also decreases the memory usage. When building against the IL2CPP scripting backend, managed bytecode stripping (which is activated by default) removes unused code from managed assemblies. The process works by defining root assemblies and then using static code analysis to determine what other managed code those root assemblies use. Any code that is not reachable is removed. For more information about Managed Code Stripping, see the TTales from the optimization trenches: Better managed code stripping with Unity 2020 LTS blog post and the Managed code stripping documentation.
Native allocators
Experiment with native memory allocators to fine-tune memory allocators. If the game is low on memory, use smaller memory blocks, even if this involves slower allocators. See Dynamic heap allocator example to learn more.
Manage native plugins and SDKs
Find the problematic plugin — Remove each plugin and compare the game memory snapshots. This involves disabling a lot of code functionality with Scripting Define Symbols and refactoring highly coupled classes with interfaces. Check Level up your code with game programming patterns to facilitate the process of disabling external dependencies without making your game unplayable.
Contact the plugin or SDK author — Most of the plugins are not open source.
Reproduce the plugin memory usage — You can write a simple plugin (use this Unity plugin as reference) that does memory allocations. Inspect the memory snapshots using Android Studio (as Unity doesn't track these allocations) or call the
MemoryInfoclass andRuntime.totalMemory()method in the same project.
A Unity plugin allocates Java and native memory; here's how to do it:
Java
byte[] largeObject = new byte[1024 * 1024 * megaBytes];
list.add(largeObject);
Native
char* buffer = new char[megabytes * 1024 * 1024];

// Random data to fill the buffer
for (int i = 1; i < megabytes * 1024 * 1024; ++i) {
   buffer[i] = 'A' + (i % 26); // Fill with letters A-Z
}
