This document shows you how to optimize game performance by using tools to identify and resolve CPU and GPU bottlenecks.
CPU optimization
If analysis shows the game is CPU-bound, further investigation is essential. This requires identifying the specific threads or APIs that cause bottlenecks and reduce FPS.
For CPU optimization, a universal solution is generally not effective. Instead, you must identify the most demanding workload based on the game or scene, and then optimize the relevant logic and functions.
Game engine timing trace tools
The following tools can assist with this analysis:
Unreal insights
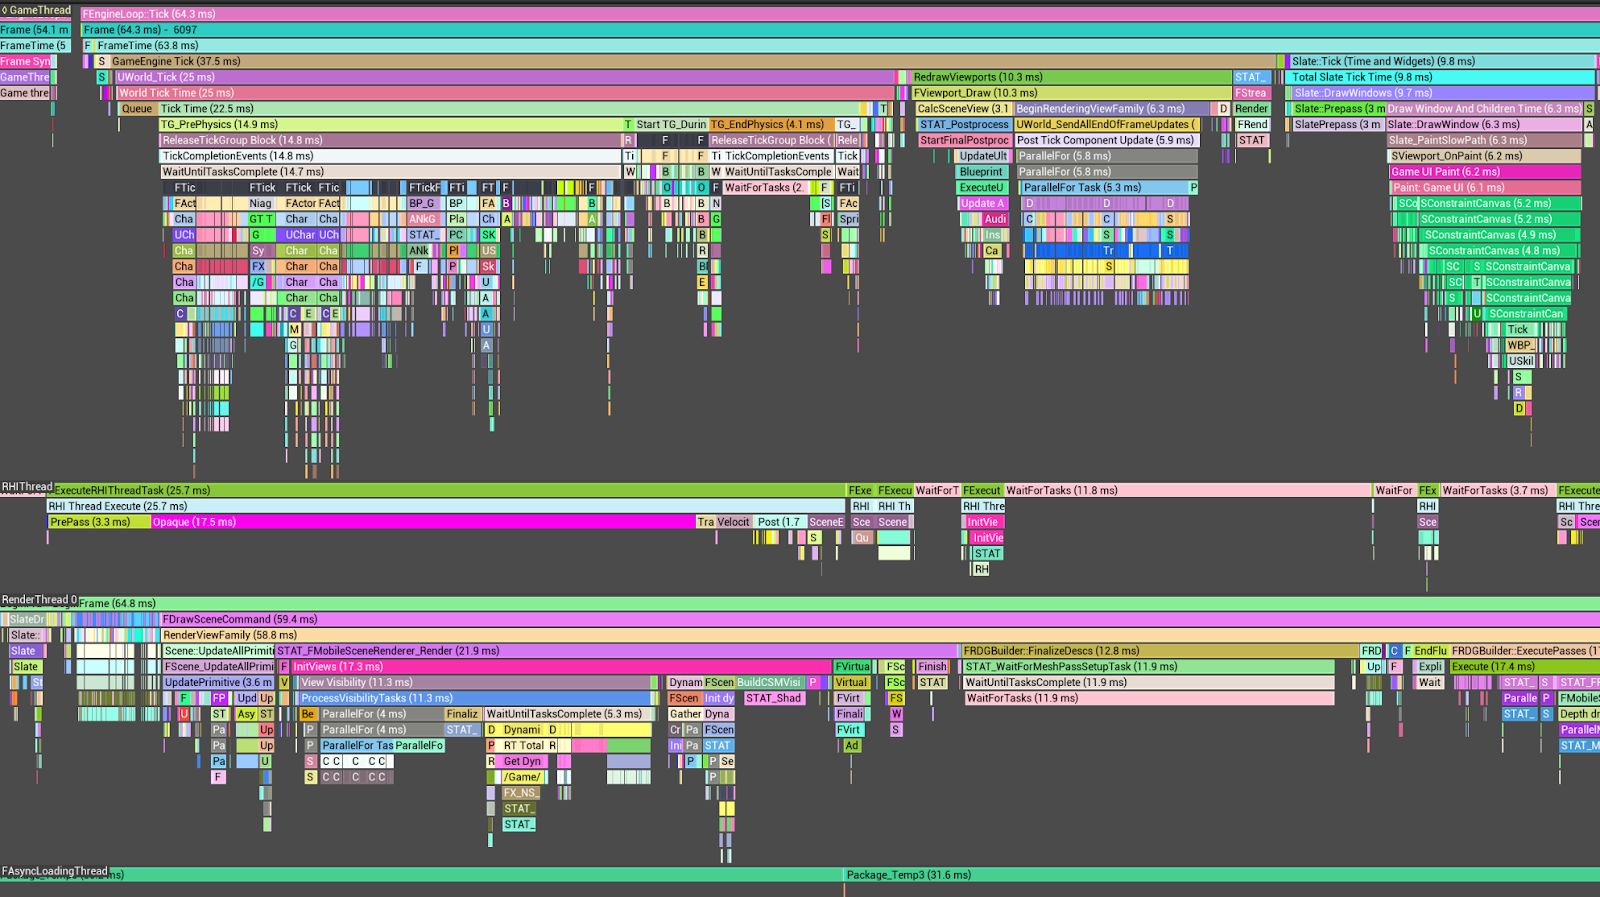
Within Unreal Engine projects, the Unreal Insight Tool facilitates the analysis of timing trace information for individual threads comprising a frame.
As an illustration, the GameThread typically utilizes the largest proportion of
CPU time, primarily attributable to Tick Time. Furthermore, a substantial
portion of Tick Time is consumed by tasks associated with
FActorComponentTickFunction.
To optimize FActorComponentTick, it is imperative to exclude calculations and
implement culling for characters and objects positioned outside the camera's
field of view. Additionally, leveraging LOD (Level of Detail)-based animations
can yield further performance enhancements.
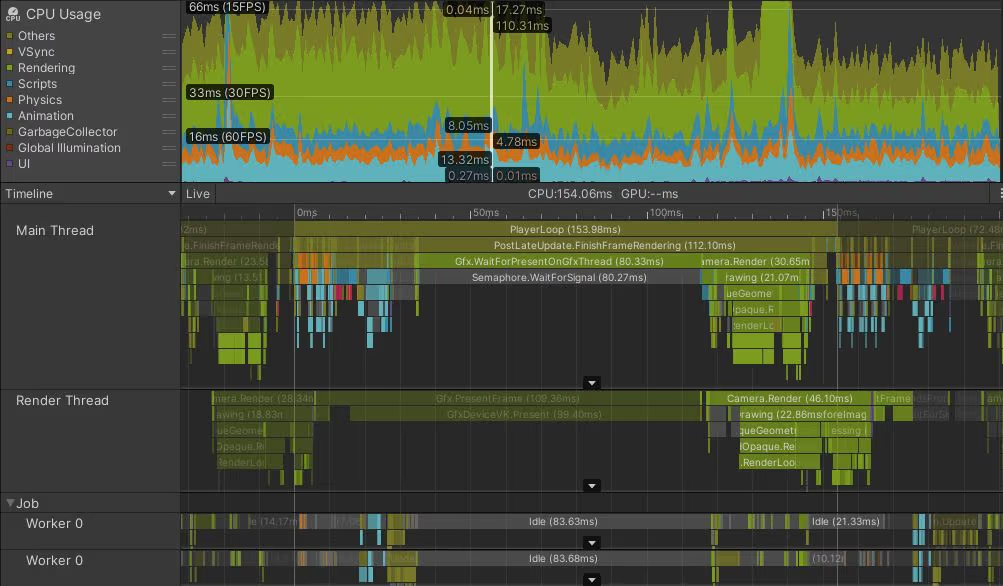
Unity Profiler (Unity)
Analysis using the Unity Profiler reveals that the Main Thread consumes over 45ms, with PostLateUpdate.FinishFrameRendering occupying 16.23ms, rendering it the most time-intensive operation. Within this, multiple invocations of Inl_RenderCameraStack are observed. It is advisable to ascertain the necessity of enabled cameras and optimize them accordingly.
System-level profiling tools
Use the following profiling tools:
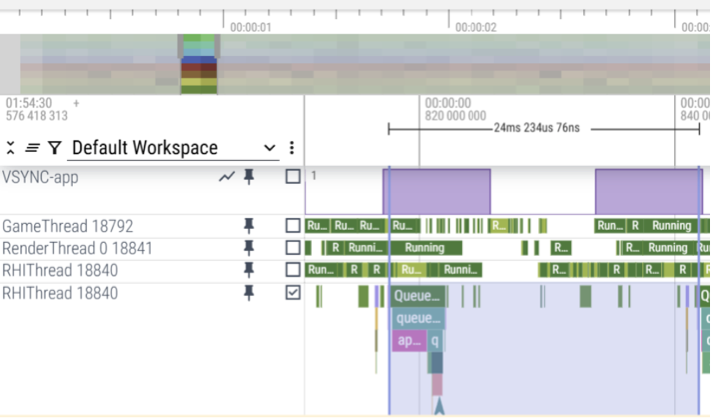
Perfetto
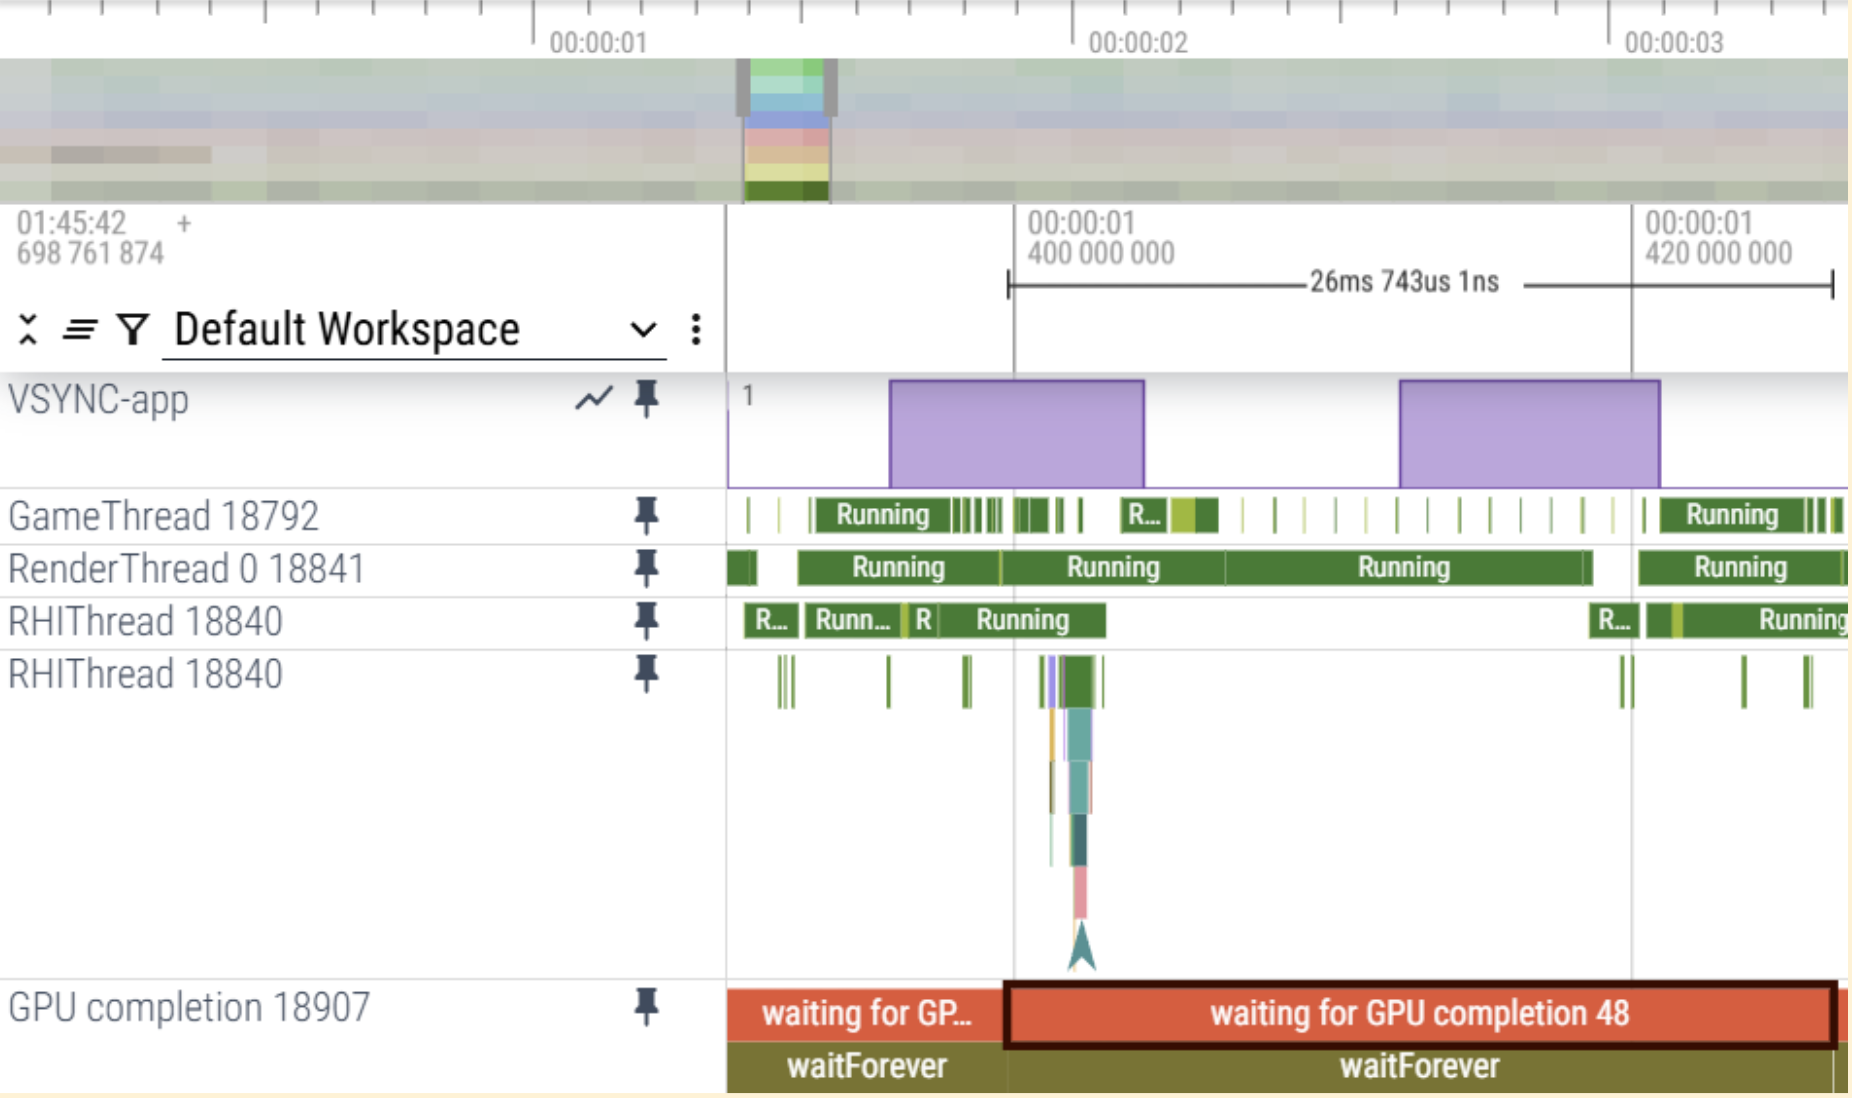
Using Perfetto trace, you can determine the CPU core assignments and execution details of each thread on an Android-powered device. This lets you identify performance bottlenecks by analyzing thread execution data.
CPU overhead case
The trace indicates that the workload on the GameThread and RenderThread is causing delays in the RHI Thread's QueuePresent, leading to a CPU-bound scenario, based on VSync.
GPU overhead case
The trace indicates that the GPU completion itself exceeds 25ms, which signifies a GPU-bound scenario.
Simpleperf
To identify the functions with the highest current CPU usage, simpleperf can be utilized. For optimal outcomes, it is recommended to sort these functions to prioritize and address those with the highest usage first.
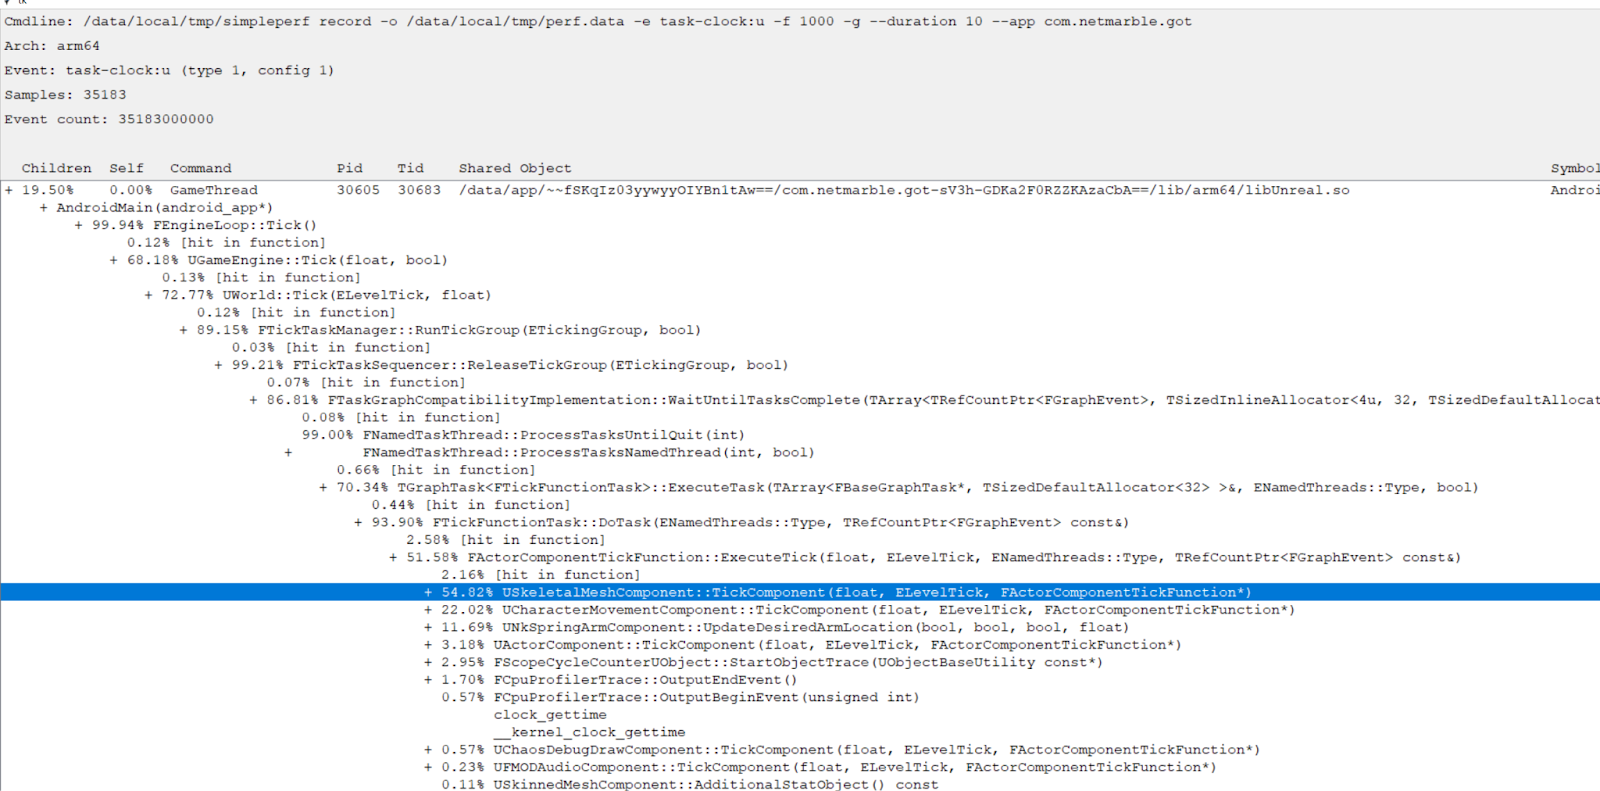
Simpleperf helps you examine data about functions that use the most CPU time. To
optimize CPU usage, start with the functions that use the most CPU. In this
example, USkeletalMeshComponent, which is associated with animation in
ActorComponentTickFunctions, uses the most CPU.
GPU Optimization
If analysis shows that the game is GPU-bound, further investigation is essential. This requires using various tools and techniques for GPU optimization and analysis.
To optimize the GPU, use a frame debugger to analyze the render pipeline and draw calls for each scene. Also, you must thoroughly understand GPU architecture and pipeline behavior to identify unnecessary operations or areas to optimize.
The following sections explain methods and tools for GPU optimization.
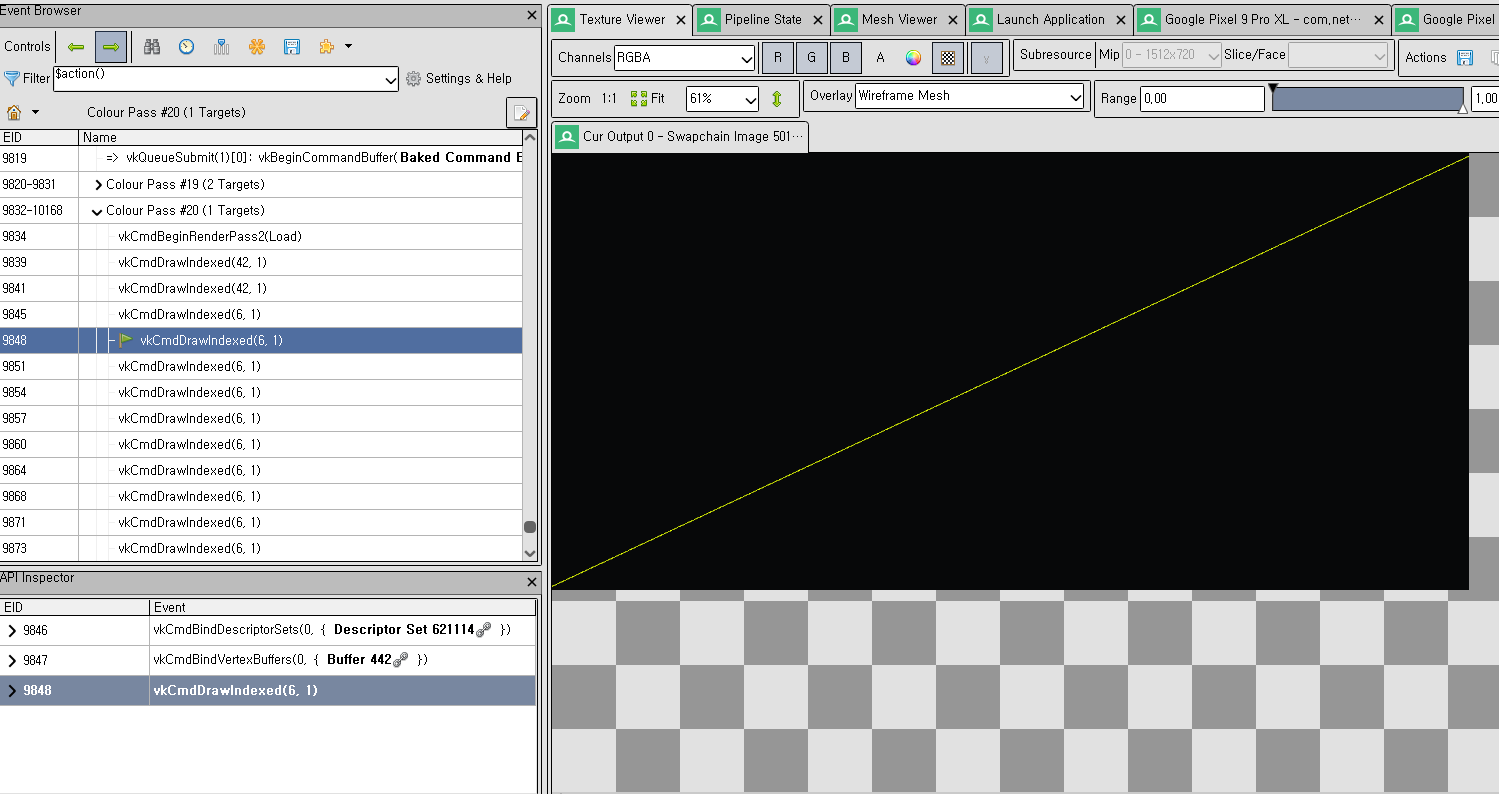
Eliminate unnecessary RenderPasses
To improve rendering performance and reduce GPU workload, eliminate unnecessary render passes. These include any render pass that lacks draw calls or whose output is not used in the final frame.
Use a GPU debugger, such as RenderDoc, to analyze the rendering pipeline and
identify optimization opportunities.
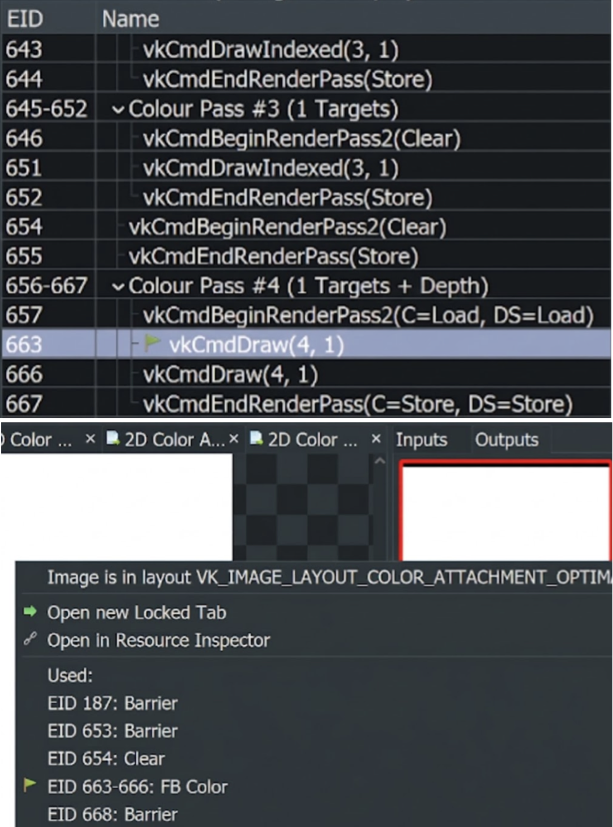
No Draw Calls: Check if the render pass includes any draw calls. If it has no draw calls, remove the pass.
Unused Output: Check if subsequent passes access or display the render pass outputs, for example, color or depth. If they don't, remove the pass.
Mergeable Passes: Identify passes that you can merge:
- Same framebuffer or attachments
- Compatible load or store operations
- No dependency barriers in between
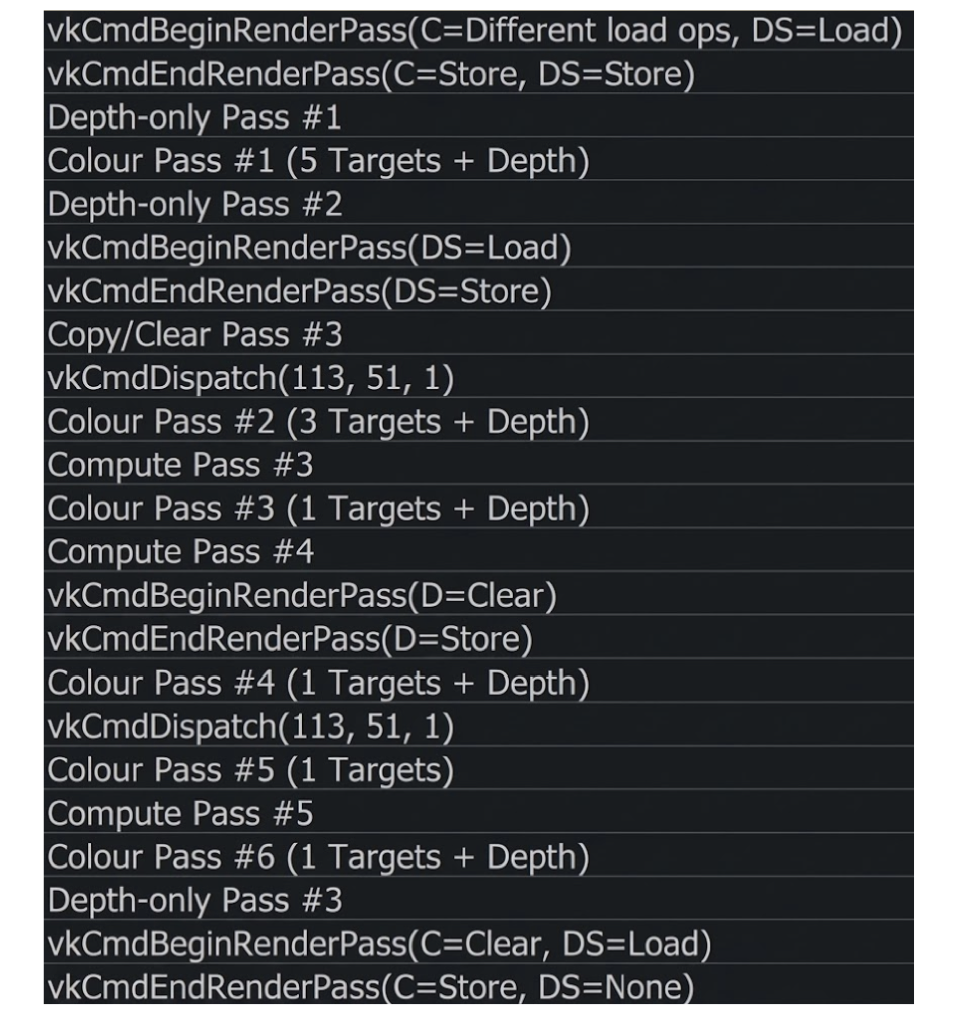
Minimize load or store operations
Load or store operations are resource intensive because they use a lot of
memory.
Minimize unnecessary load-store operations. Perform these actions only when
attachments within a RenderPass are required. Otherwise, replace them with
Clear or Don't care operations to reduce overhead.
How to optimize
Use a GPU debugger, such as RenderDoc, to analyze the rendering pipeline and
identify the following optimization opportunities:
Load: If a render pass attachment does not use data from a preceding pass or attachment, a load operation is unnecessary. In such instances, using
Don't careorClearcan reduce overhead.Store: If a render pass attachment is not used after the current render pass, the store operation is unnecessary. In such instances, use either
Don't careorClear.Replace: Determine if the current load or store settings can be replaced by
ClearorDon't Carewithout affecting the final frame.
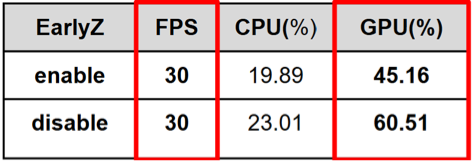
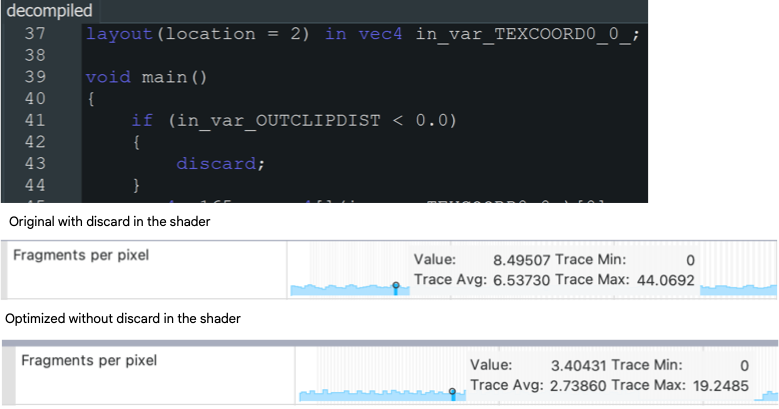
Avoid discard to enable Early-Z
Early-Z improves performance on mobile platforms. However, a discard
instruction within a shader automatically disables Early-Z. If the discard
instruction is not essential, remove it.
Early-Z acceleration
This optimization significantly reduces fragment shader operations and improves GPU performance.
Early-Z Depth and stencil testing
How to optimize
Use a GPU debugger, such as RenderDoc, to analyze the rendering pipeline and
identify the following optimization opportunities:
Use of
discardin fragment shaders: Thediscardkeyword prevents the GPU from performing early depth tests because the fragment's visibility is not known in advance.Modification of
gl_FragDepth: Dynamically modifyinggl_FragDepthchanges a fragment's depth, which disables Early-Z optimization because the final depth is unknown before fragment processing.Alpha-to-coverage enabled: When alpha-to-coverage is enabled (often used in MSAA rendering), fragment coverage depends on alpha values. This can delay depth testing and disable Early-Z.
Optimize texture format
Optimal texture format selection reduces memory consumption, enhances bandwidth efficiency, and improves rendering performance. Employing excessively high-precision formats can squander GPU resources without providing visual advantages.
How to optimize
Use a GPU debugger, such as RenderDoc, to analyze the rendering pipeline and
identify the following optimization opportunities:
- Use
D24S8instead ofD32S8for depth-stencil buffers: UsingD24S8for depth-stencil buffers reduces memory consumption by 20% compared toD32S8, with little to no noticeable difference in visual quality across most applications. - Use
ASTCcompression for color textures:ASTCcompression significantly reduces texture memory usage—by a factor of up to 8x compared to uncompressed formats—while preserving high visual quality. - Use half-float formats instead of full-float: Use
R16ForRG16Fto reduce memory bandwidth and storage consumption. These formats are well-suited for post-processing buffers.
Optimize geometry complexity
Minimizing geometric complexity improves rendering performance, particularly on mobile devices with constrained GPU capabilities. This involves using a reduced number of vertices and triangles, consolidating objects to decrease draw calls, and eliminating unrendered or unnecessary geometry. Techniques like mesh simplification, Level of Detail (LOD), and frustum or occlusion culling can significantly reduce GPU workload and increase frame rates.
How to optimize
Use profiling tools and GPU debuggers, such as RenderDoc, Android GPU
Inspector, or other performance analyzers, to identify geometry-related
performance bottlenecks.
Reduce Triangle Count: Minimize polygon usage, particularly for small or distant objects.
Use Level of Detail (LOD): Based on the camera's distance, simpler meshes are used automatically.
Merge Small Meshes: Consolidate static objects to reduce draw calls and CPU overhead.
Frustum and Occlusion Culling: Avoid rendering objects that are outside the view or are obscured by other elements.
Remove unnecessary attachments
Render pass attachments (for example, color, depth, stencil) consume memory bandwidth and GPU resources, even if they are not used. Removing unnecessary or redundant attachments improves performance and reduces power consumption, particularly on mobile platforms.
How to optimize
Use profiling tools and GPU debuggers, such as RenderDoc,
Android GPU Inspector, or other performance analyzers, to identify
geometry-related performance bottlenecks.
- Check actual usage: Are there any draw calls or shaders that are writing to or reading from the attachment?
- Analyze frame output: Use
RenderDocor comparable utilities to determine whether the attachment contributes to the final image. - Consider transient or dummy attachments: Transient attachments or a 'Don't Care' store operation should be used for temporary data that does not require persistent storage.
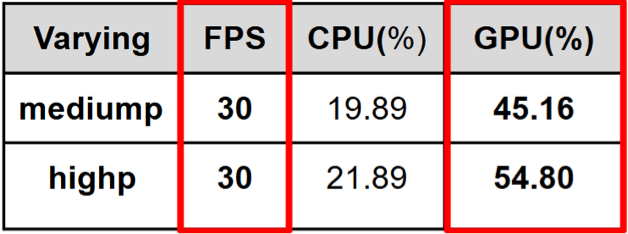
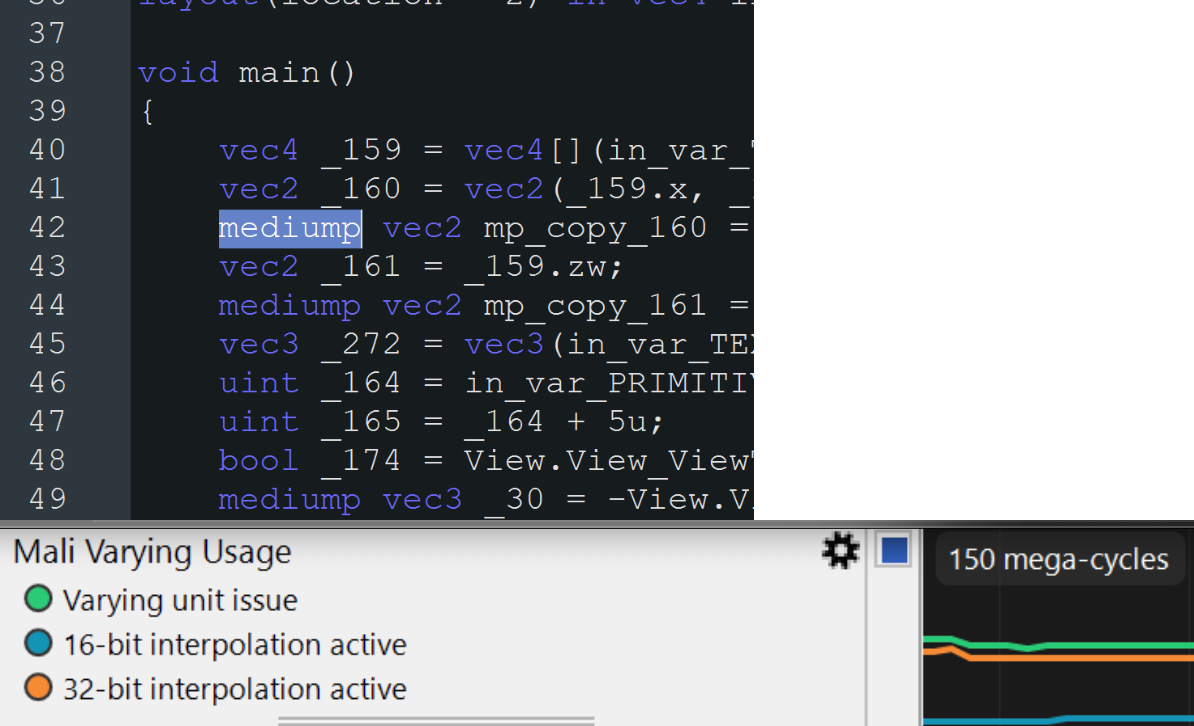
Optimize shader precision
Using excessively high precision (for example, highp instead of mediump or lowp) within shaders increases GPU workload, power consumption, and register pressure, particularly on mobile GPUs. By using the lowest adequate precision for variables (for example, positions, colors, UVs), you can improve performance without a discernible visual impact.
How to optimize
Use profiling tools and GPU debuggers such as RenderDoc, Android GPU Inspector, or other performance analyzers to identify geometry-related performance bottlenecks.
Review shader code: Assess shader variables and confirm that high precision is used only when necessary, such as for depth or screen-space computations. Use medium or low precision for colors, UV coordinates, or values that don't require high precision.
Use GPU debuggers: Diagnostic utilities, such as RenderDoc or mobile GPU profilers (for example, AGI, Mali/GPU Inspector), identify elevated register use or shader stalls associated with precision issues.
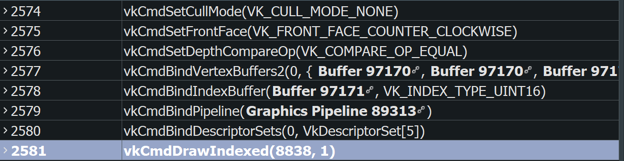
Enable back-face culling
Rendering triangles that face away from the camera (back-faces) is often unnecessary for solid objects.
How to optimize
Using VK_CULL_MODE_NONE can negatively affect performance because it forces
the GPU to render both front and back faces, which increases the rendering
workload.
Minimize overdraw in UI scenes
Eliminate unnecessary draw calls and render passes, particularly in UI scenes, to enhance rendering performance and reduce GPU workload. For example, in a UI scene where the entire world renders before overlaying the UI across the screen, rendering the world becomes redundant.
How to optimize
Use a GPU debugger, such as RenderDoc, to analyze the rendering pipeline and
identify the following optimization opportunities:
- Verify the absence of superfluous overdraw. In user interface contexts, where the entire screen might render, confirm that preceding rendering passes are not unnecessarily overdrawn.
- Enable depth testing and culling to optimize performance.
- Consider rendering order from front to back.