
One fundamental aspect of your app or game's performance is its memory usage patterns. You can use the System Profiler in Android Performance Analyzer to analyze these patterns by looking at the GPU counter data available for your test device.
Highlight a frame
Begin by highlighting a period of time consistent with a single GPU frame as described in Estimate with GPU counters. You should determine your frame time boundaries based on counters instead of GPU slices for this analysis task because it will better match the timing of the other counter tracks, as opposed to GPU slices, whose data is collected independently from the counter track data.
Estimate total memory bandwidth
The next step is to get a good overall look at how much data is crossing the memory bus over the course of a single frame.
Adreno
After you've highlighted a single frame in the profiler, start by looking at the Read Total (Bytes/sec) and Write Total (Bytes/sec) counter tracks.
You can also use the Vertex Memory Read (Bytes/Second) and Texture Memory Read (Bytes/Second) counter tracks to determine the bandwidth usage breakdown between vertex and texture data.
Mali
After you've highlighted a single frame in the profiler, start by looking at the Output External Read bytes and Output External Write bytes counter tracks.
You can also use the Input internal read stall cycles and Input internal write stall cycles counter tracks to check for excessive cache reads. Higher values for these counters mean that there are too many read requests being made and as a result shader code is stalling waiting to get access to memory.
Wherever possible, minimize the amount of data that you send over the bus. Memory bandwidth usage is a large source of battery drain on mobile devices. What you consider a good range for these values depends on the type of workloads in your app or game. For example, 2D applications might see relatively large (~2GBps) amounts of texture memory bandwidth being used, but very small (~50MBps) amounts of vertex memory bandwidth. For more details, see Analyze texture memory bandwidth usage and Analyze vertex memory bandwidth usage.
Analyze fetch stalls
Another metric to look at is the percentage of fetch stall cycles.
Adreno
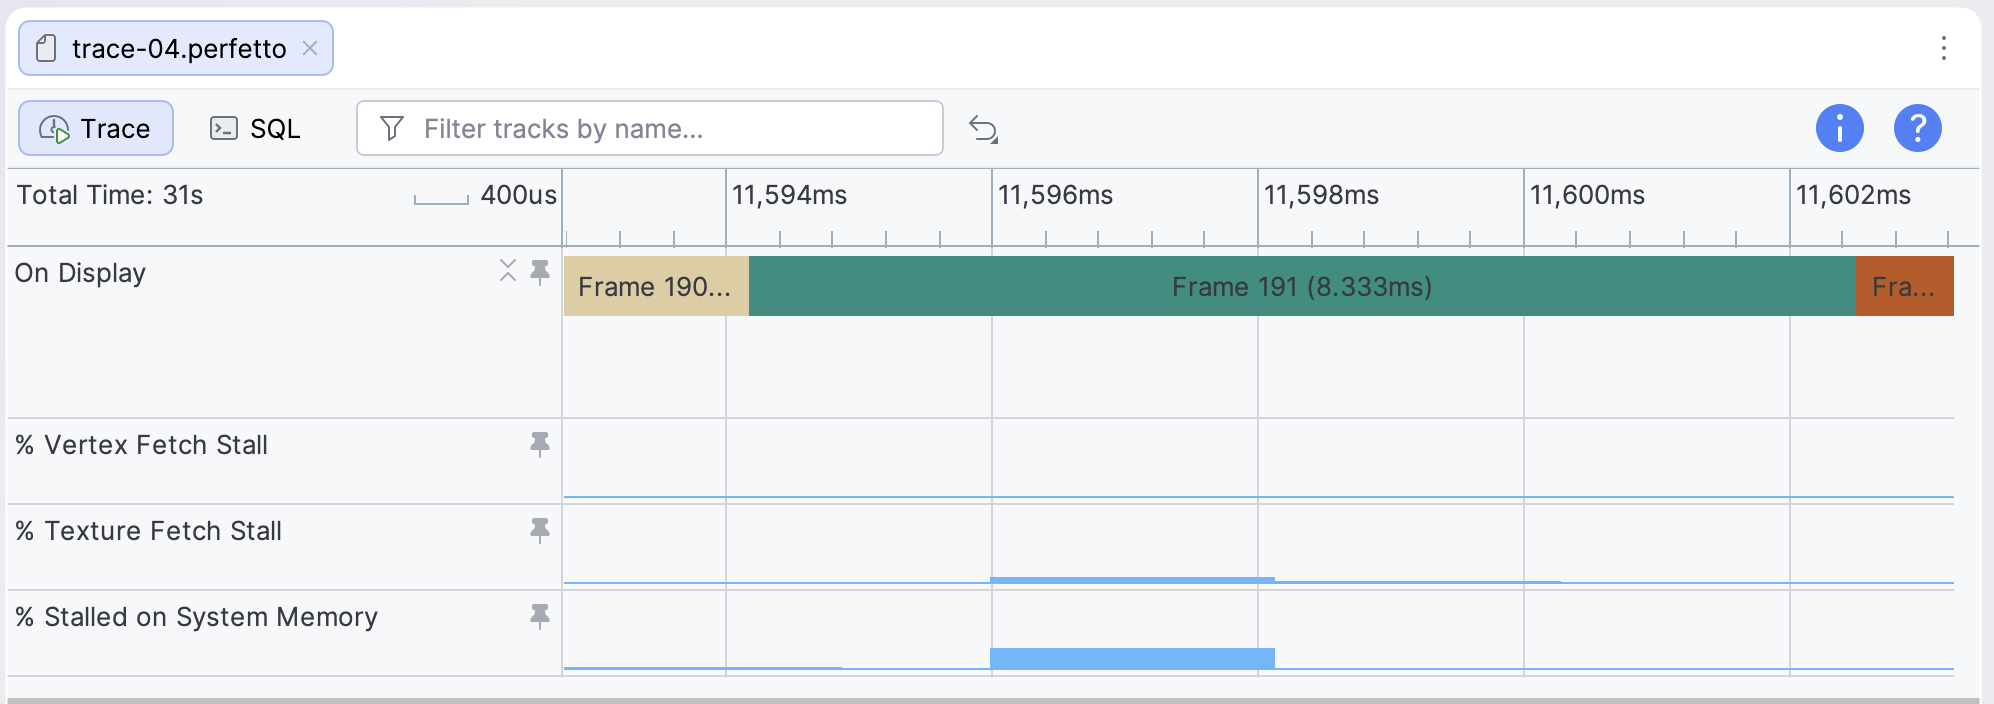
The relevant counters to examine for fetch stalls are the % Vertex Fetch Stall, % Texture Fetch Stall, and % Stalled on System Memory counter tracks. These tracks provide hints to the overall memory performance of your app or game.
Mali
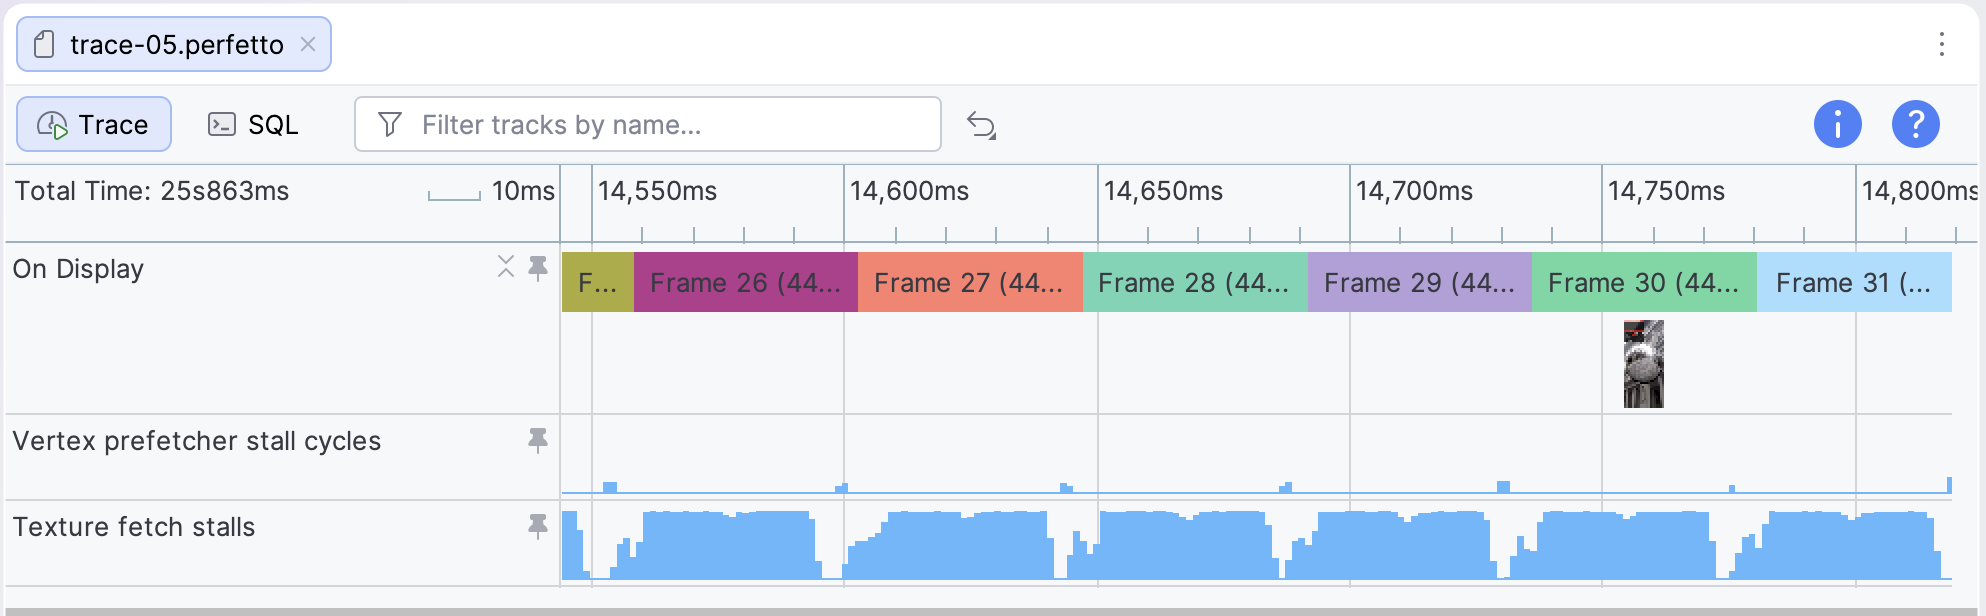
The relevant counters to examine for fetch stalls are the Vertex prefetcher stall cycles and Texture Fetch Stall counter tracks. These tracks provide hints to the overall memory performance of your app or game.
If fetch stall cycles are higher than 5%, it suggests that your app or game is either not laying out data in memory in an efficient way or not taking effective advantage of the cache. See Analyze texture memory bandwidth usage and Analyze vertex memory bandwidth usage for more information on how to improve memory efficiency for these types of assets.