
by The Forge Interactive, Youssef Abusamra, Nicola Palomba
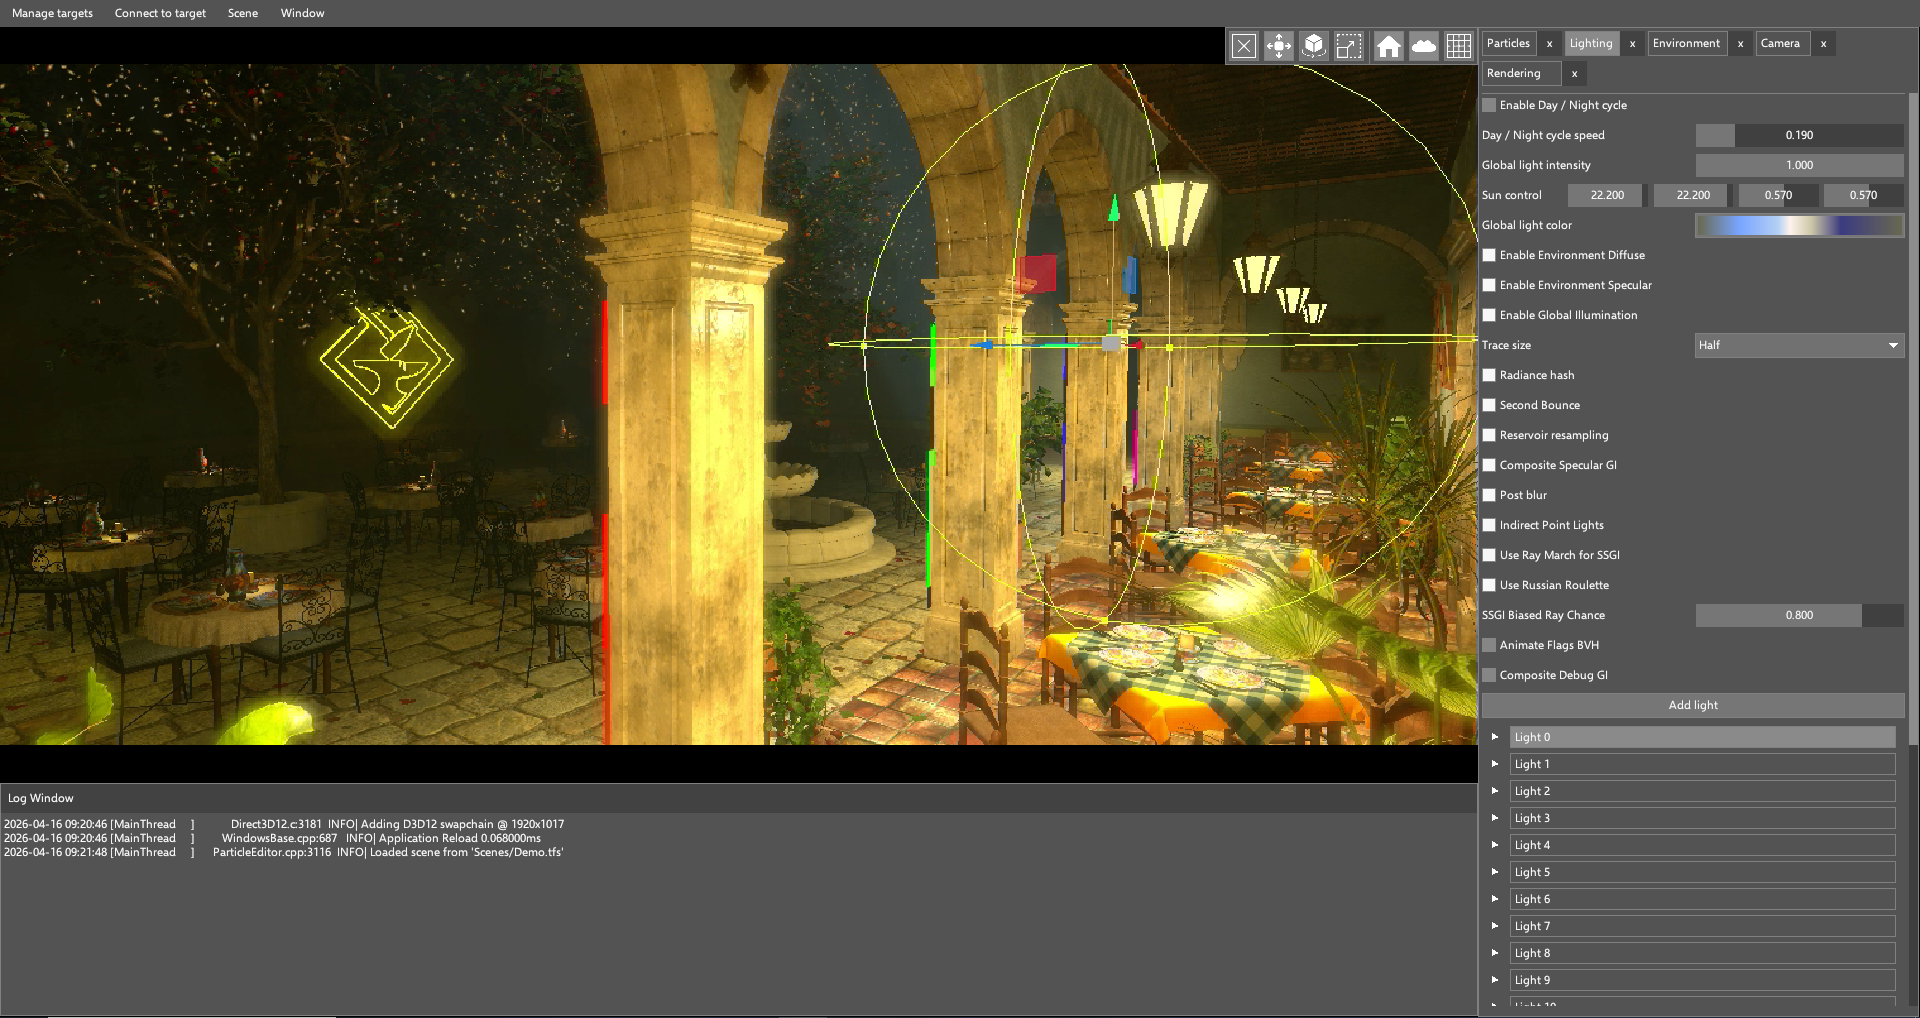
Recently, The Forge Interactive developed an internal demo which showcases its latest research projects in the field of graphics programming. The work is divided into two parts: an Android Runtime, also referred to as the “Server” (of the final rendered frame), and a Remote Editor that runs on Windows (the “Client”) and can connect to the Server via network and retrieve the video stream coming from the target device. The Runtime can use the data provided by the Editor over network to render the final frame. This setup is useful for game developers to run their project directly on the target devices, with no need to maintain an additional PC backend just to run an editor.
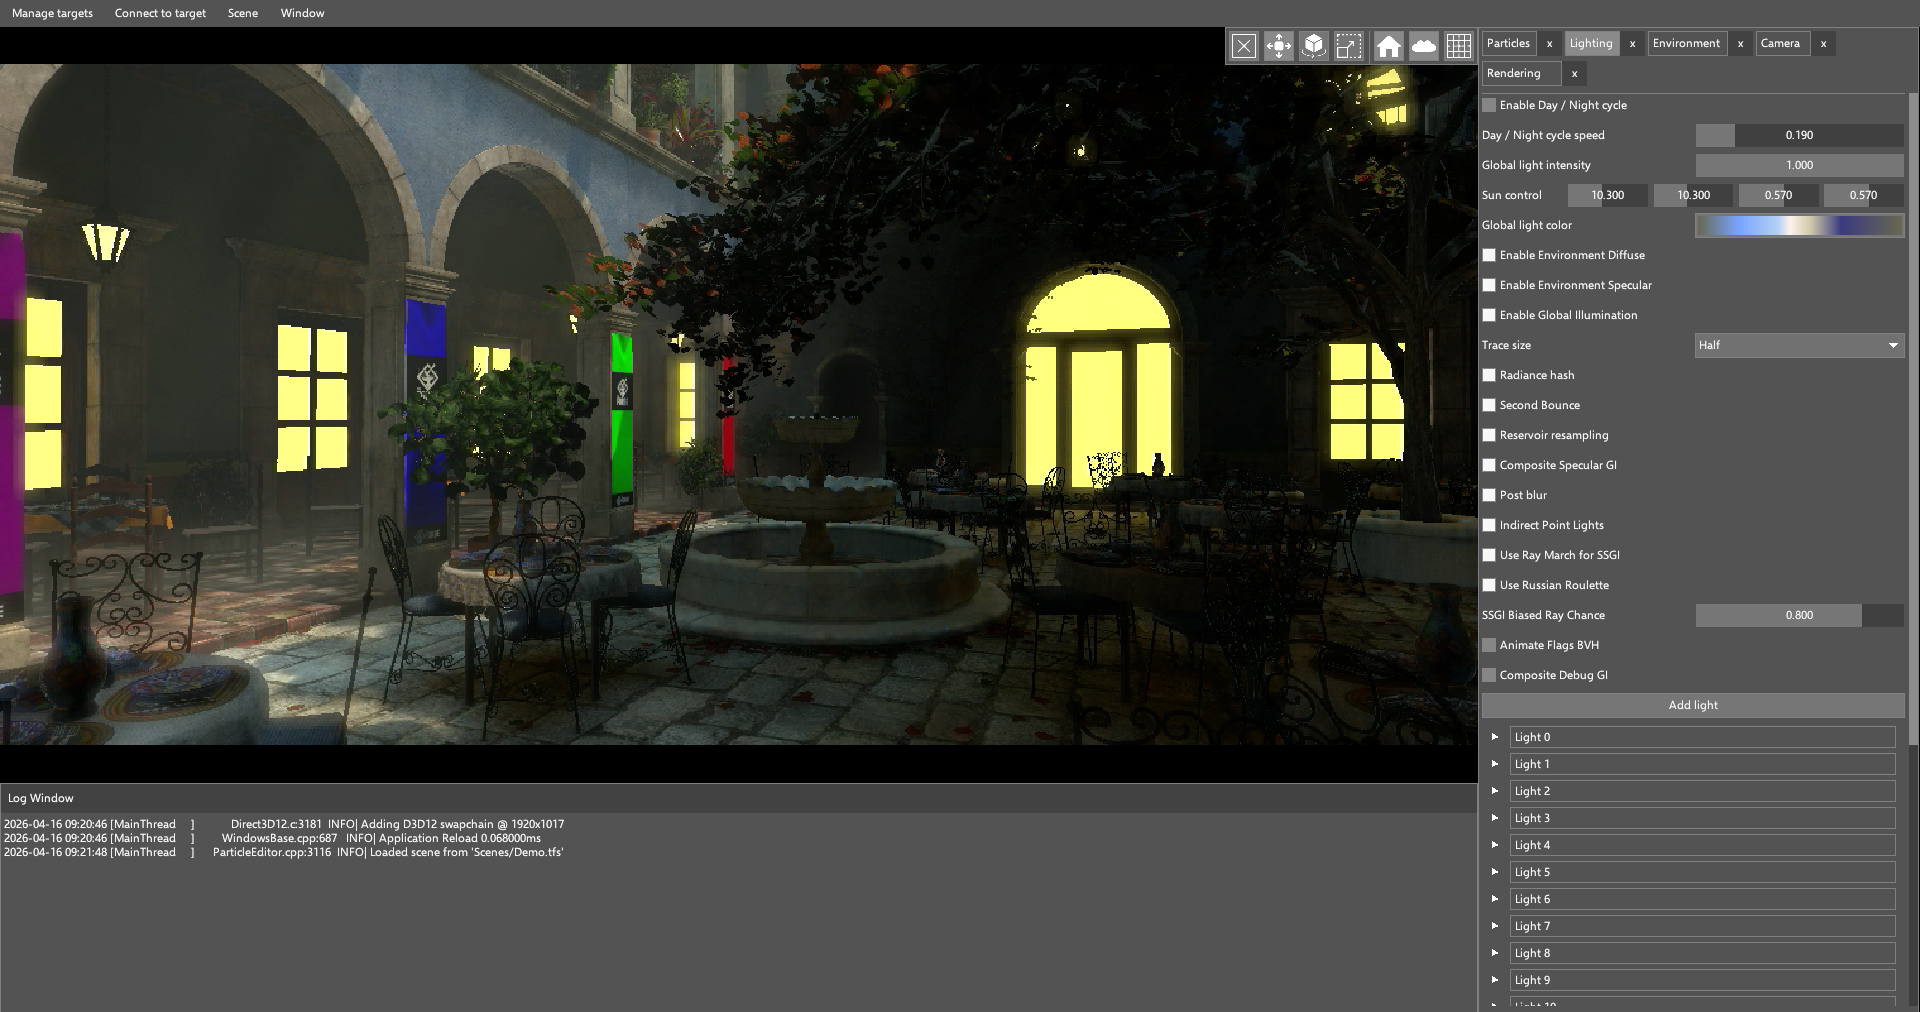
Our runtime is very GPU-intensive: it runs a particle system that can handle hundreds of thousands of particles, and raytraced global illumination on devices that support it. In GPU-driven rendering (and with modern graphics APIs in general), minimizing CPU overhead is crucial to achieve the target framerate.
In this case study, we will describe how we used Android Performance Analyzer to identify optimization opportunities in our Runtime and address the points of action that we found.
Swappy settings and command pool reset
First, we captured a trace of our application using Android Performance Analyzer, making sure the application was debuggable to get as much information as possible from the device. From the configuration page, we selected all the available counters for our device, a Samsung Galaxy S22 with the Xclipse 920 GPU. After retrieving the trace, our main window was populated with the trace data:
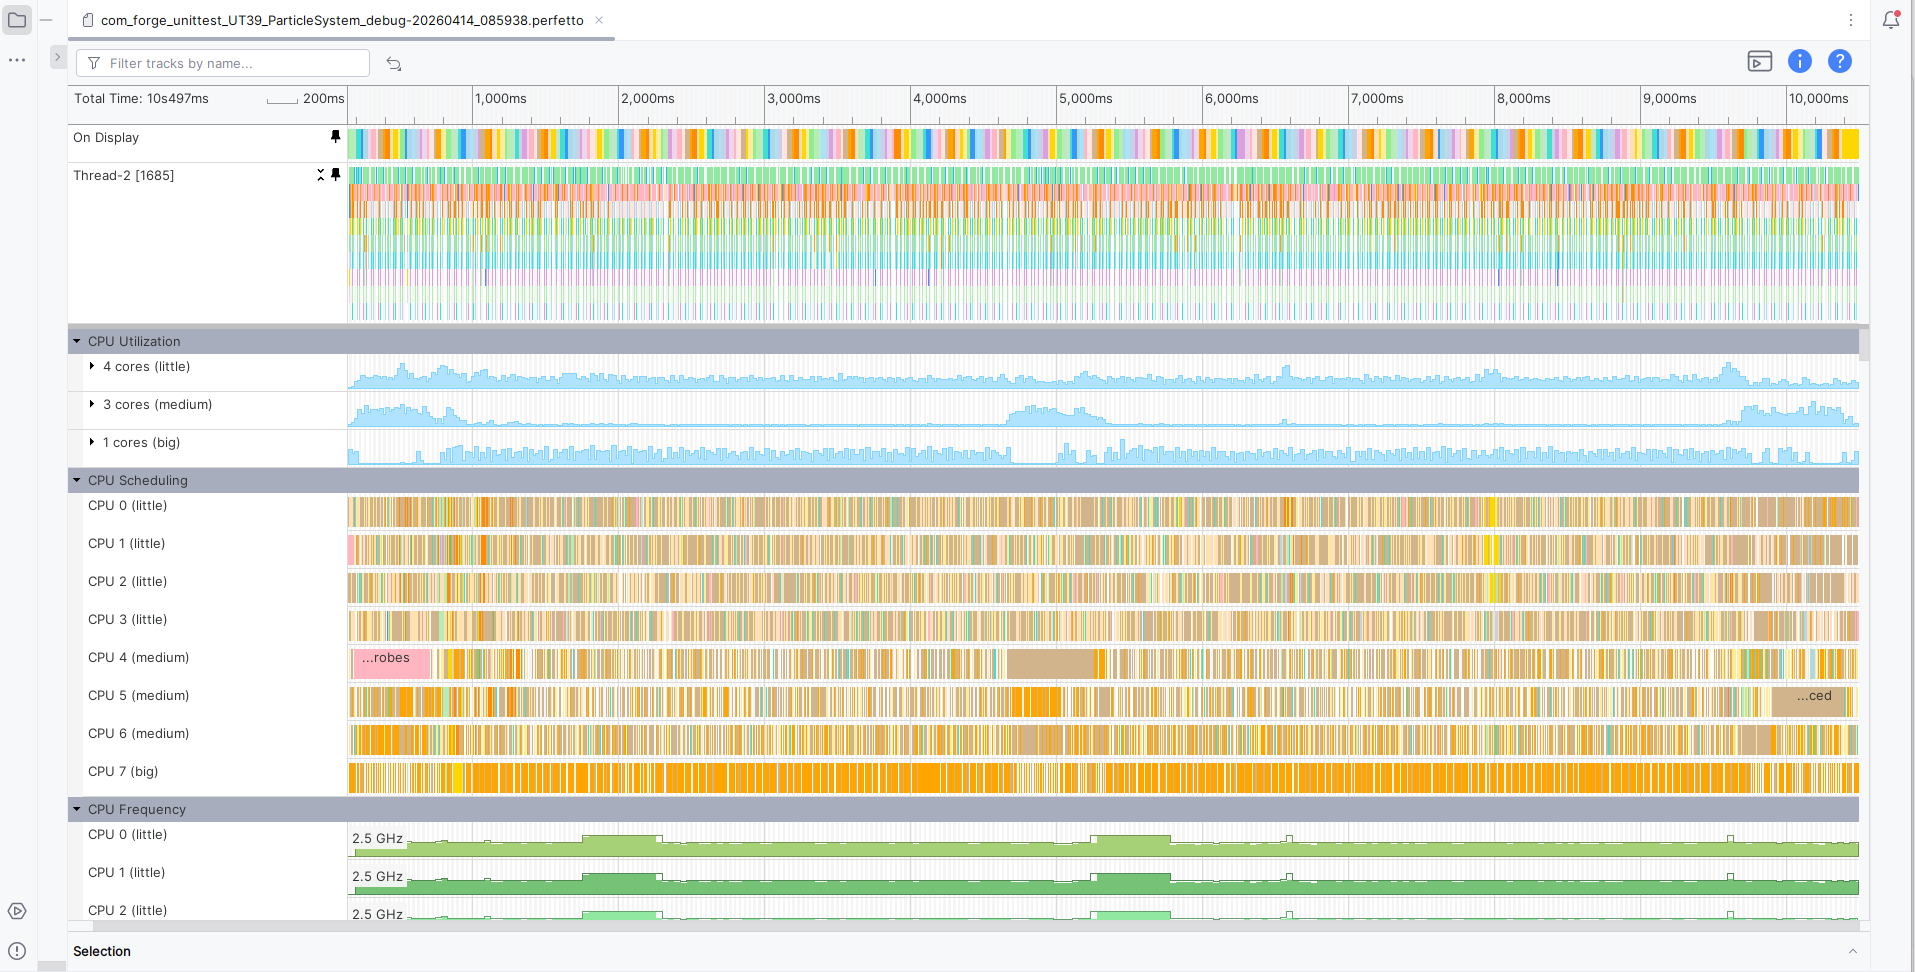
You can see that, at the top, two tracks are already pinned by default: the On Display track shows the duration of frames, while the other one shows calls to the Vulkan API from the main thread. Let’s zoom in on them:
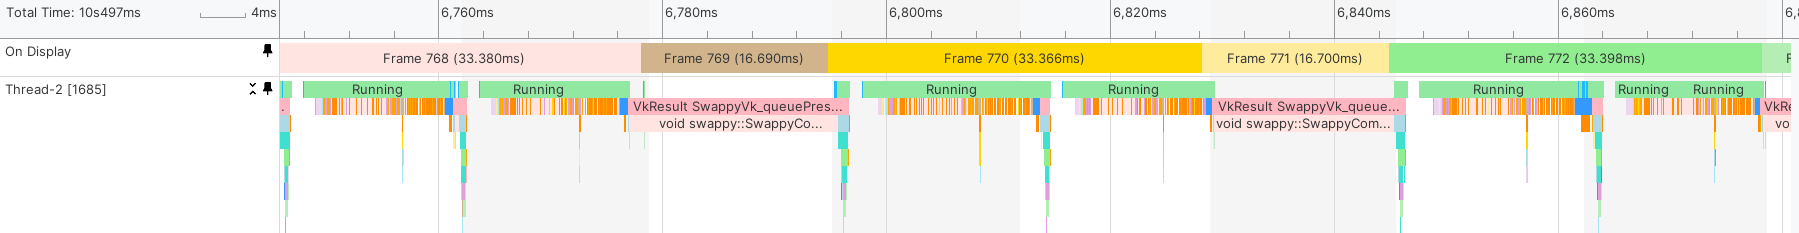
We can already notice something weird: one of every two frames seems to be
entirely taken by a vkQueuePresent call. This is due to the Swappy frame
pacer, which we use to achieve a smooth framerate with no spikes.
We configured Swappy to always try to run our applications at 60 FPS, which is not always possible with more intensive applications such as our Runtime. This caused the issue described above. We therefore decided to have our application run at a steady 30 FPS. Instead of globally defining the target framerate in The Forge framework, we extended our GPUConfig system so that single applications can select a specific value. The following rule was added:
targetfps; target >= mobile_begin, target <= mobile_end; 30;
This translates to “set the target FPS to 30 if running on mobile.” Thanks to this system, it is also possible to specify overrides for specific, more powerful devices, running the application at higher framerates. This is what our timeline looks like now:
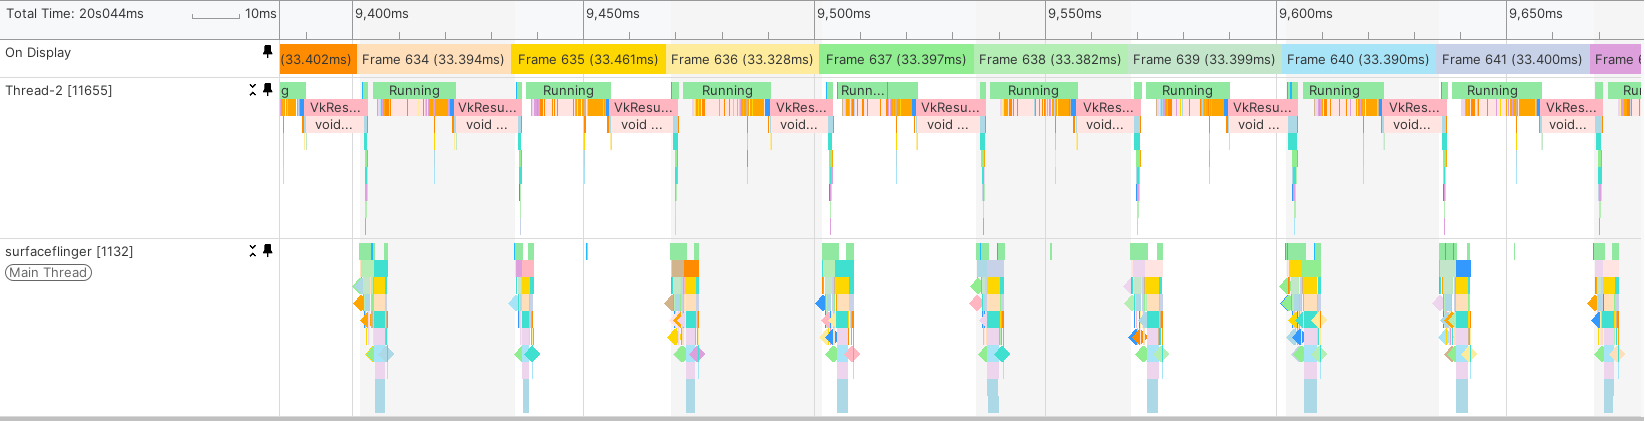
As shown in the picture above, frames are now presented consistently at a stable 30 FPS. This has the benefit of improving stability and thermals. The following table shows the notable improvements we measured in thermals after our changes:
| With the fix to the Swappy configuration | Without the fix | |
|---|---|---|
| Light state after: | 284s | 101s |
| Moderate state after: | 437s | 183s |
| Severe state after: | 620s | 281s |
Let’s continue analysing our trace. Right at the beginning of the frame, we reset our command pool; this operation takes around 0.35ms, which seems like a relatively long amount of time, especially considering that we only use one command buffer per frame.
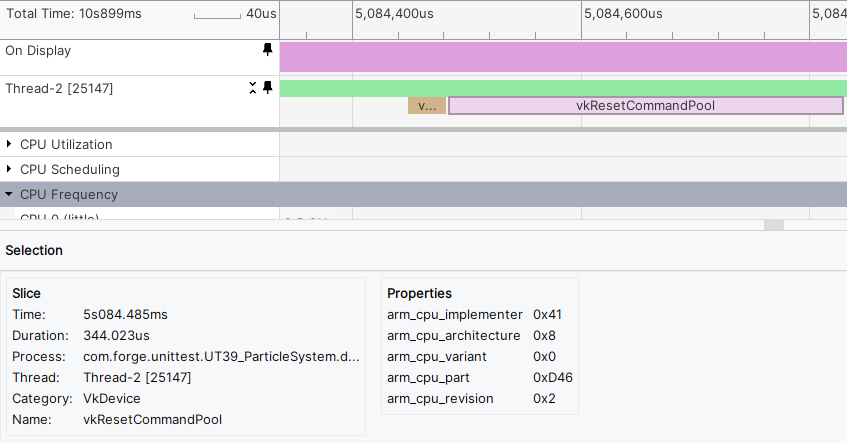
Let’s try replacing it with a call to vkResetCommandBuffer and using the
VK_COMMAND_POOL_CREATE_RESET_COMMAND_BUFFER_BIT flag when creating the command
pool.
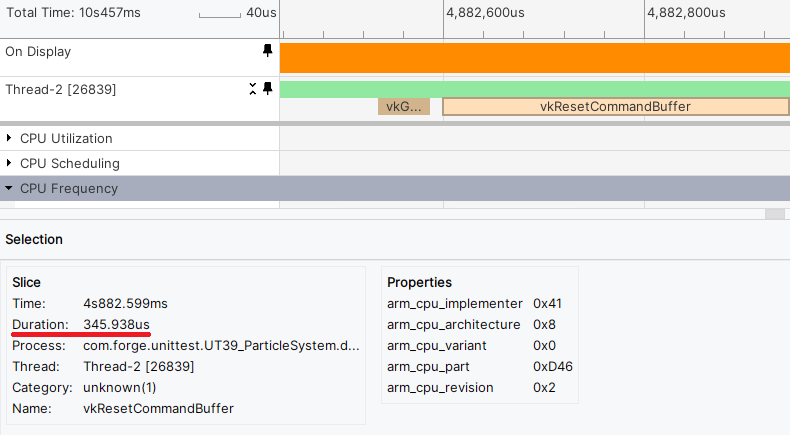
The time taken to reset a single command buffer seems to be approximately the same, so let’s keep resetting the whole command pool instead and continue analyzing the trace.
Batching descriptor sets
We now get to the first compute pass, which filters all the triangles in the scene to remove the ones that are not visible.
Right before the dispatch call, we bind the necessary descriptor sets, which we
organize depending on how often they are updated. There are Persistent,
PerFrame, PerBatch, and PerDraw descriptor sets. In this case, they are
bound one after the other using 4 calls in total. We can see this pattern in
many other places in the frame; but Vulkan, unlike D3D12, allows binding
multiple descriptor sets at once. We have just identified another point of
action.
To address it, we added some code to cache the state of descriptor sets. When a
programmer calls the cmdBindDescriptorSet function of The Forge, the framework
doesn’t immediately issue the related API call; instead, it caches the
descriptor sets and issues a single call to vkCmdBindDescriptorSets for all of
them right before issuing a dispatch or a draw call.
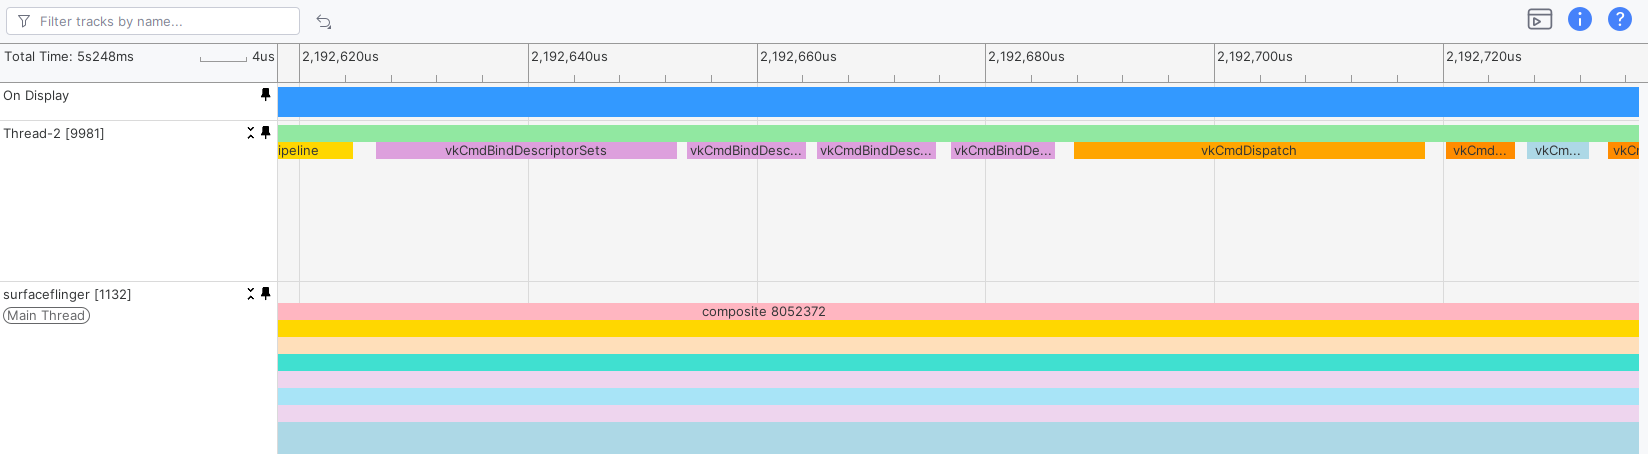
The image below shows the triangle filtering stage after this optimization:
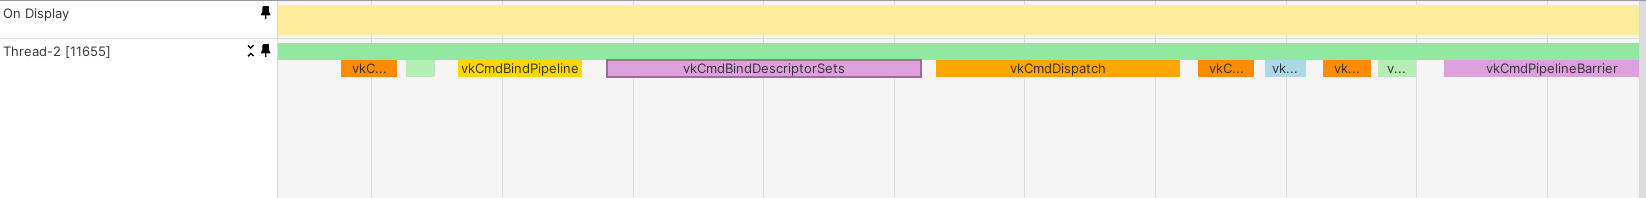
Let’s now calculate how effective this change was. To do that, we can use
PerfettoSQL to compute the overall amount of time spent issuing calls to
vkCmdBindDescriptorSets. In order to reproduce the same testing conditions and
create a meaningful comparison, let’s set the trace length to 20 seconds and
take one trace without descriptor set batching and one with it. We can now use
the following query to get the average time spent in vkCmdBindDescriptorSets
over a single frame:
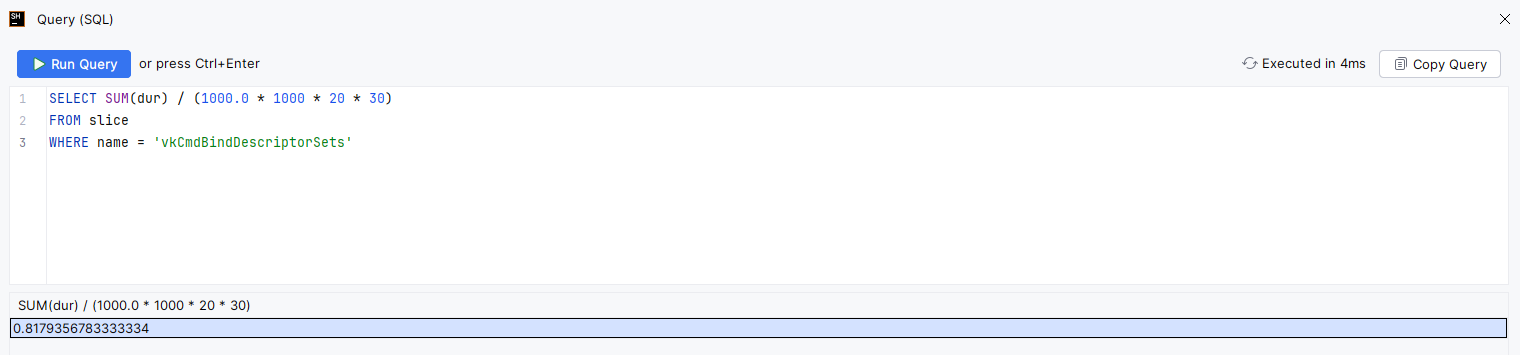
SELECT SUM(dur) / (1000.0 * 1000 * 20 * 30)
FROM slice
WHERE name = 'vkCmdBindDescriptorSets'
We divide the sum by 1000 * 1000 to convert from nanoseconds to milliseconds. We then divide by 20 (length of the trace in seconds) and then again by 30 (frames per second, which are guaranteed by Swappy). This is the result when batching descriptor sets:
And this is the result without the optimization:
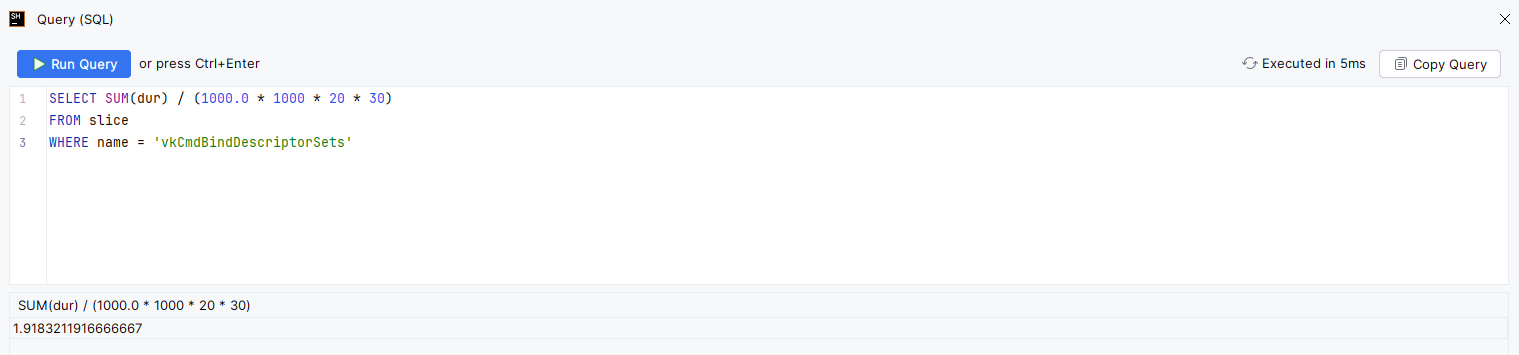
This shows that we saved around 1.1ms of CPU time, halving the time spent in
vkCmdBindDescriptorSets.
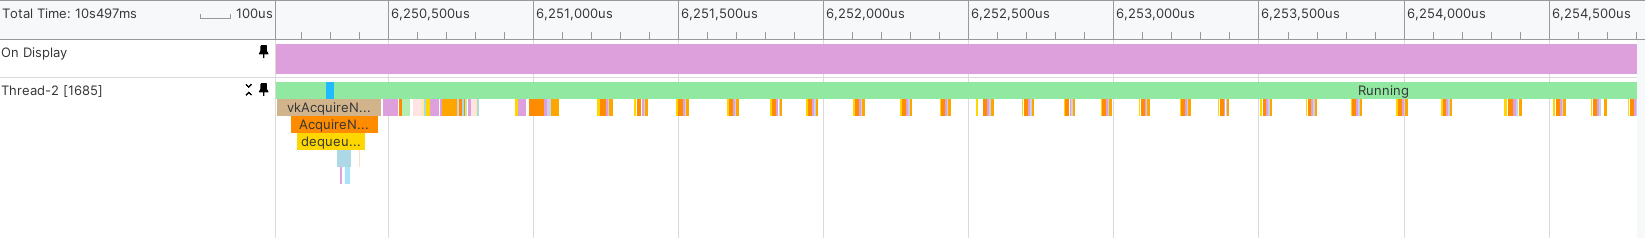
UI and font rendering
Let’s continue going through our frame. Pipeline barriers are correctly grouped and there are no calls that could be batched. Render passes are only started when necessary and the draw and dispatch calls look like what we would expect them to. We finally get to the end of the frame, at the point where the swapchain image is acquired. Right after that, we render the UI.
In the above picture, each small block renders a widget. Let’s zoom in on a single block:
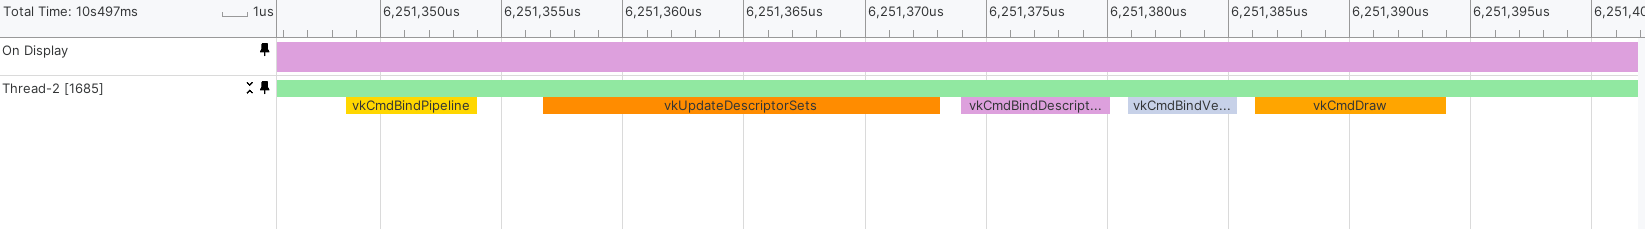
For each widget, the pipeline is bound, a descriptor set is updated and bound, then the draw call is finally issued. First of all, the fact that the pipeline is bound before every call is suspicious as there shouldn’t be any need to do so, unless the static state of the pipeline changed for every widget, which doesn’t seem to be likely as every widget is drawn with the same shader, vertex layout, and state.
Secondly, we update a single descriptor set and bind it before every draw call, which adds some overhead: instead, it would be better to update all descriptor sets before drawing the UI.
To address this, the UI rendering path was refactored to use a bindless resource model. Instead of updating and binding a descriptor set per widget, a single UI descriptor set is now updated just once, and custom textures are now stored in a global descriptor array, where index0 is the debug UI font atlas. This is accessed directly in the shader via an index stored as a vertex attribute. This eliminates per-draw descriptor updates entirely and allows all widgets to share the same bound descriptor state. As a result, the CPU no longer needs to perform descriptor writes or bindings inside the draw loop, significantly reducing driver overhead.
This also addressed the multiple pipelines issue, where there was a pipeline specifically for fonts, one for panels, one for custom textures, and another for MSAA textures. This was unified into a single pipeline and indexed appropriately in shaders through flags in the vertex attributes. Now it’s a persistent pipeline state for the entire UI pass since all widgets use the same shader, vertex layout, and render state that is bound once before issuing any draw calls. This avoids unnecessary state validation and improves command buffer efficiency.
A similar issue was identified in the text rendering path. Previously, each line of text was submitted as an individual draw call with its own state setup: descriptor set update, bind, vertex/index buffer bind, leading to excessive CPU overhead and poor batching. This was reworked into a single indexed draw call that renders all glyphs in one pass, maintaining a state on the app level similar to UI draws. Vertex and index buffers are built up front, and per-glyph data (such as texture index and UVs) is encoded directly into the vertex stream. This allows all text to be rendered without any intermediate state changes.
By consolidating UI rendering into a small number of state changes and draw calls, the system shifts from a CPU-bound submission model to a more GPU-efficient batch-oriented approach. The profiler reflects this improvement clearly: CPU time spent in UI submission drops significantly, and the number of driver calls is drastically reduced, resulting in a more scalable and predictable rendering cost as UI complexity increases.
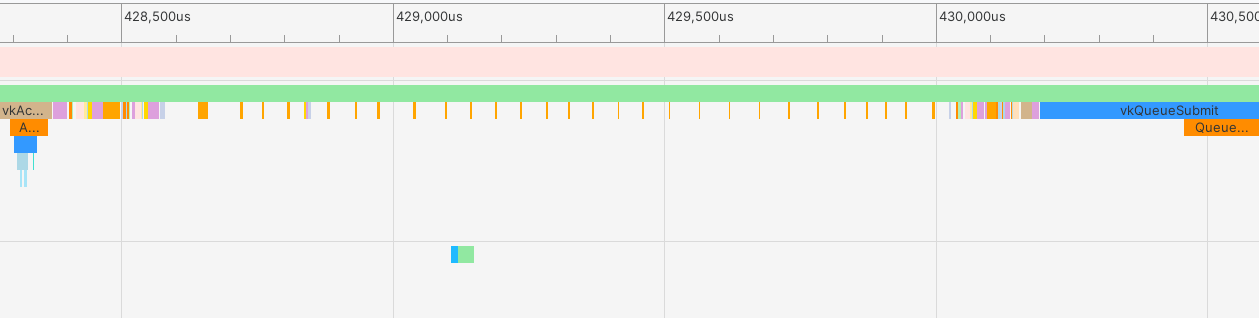
Before:
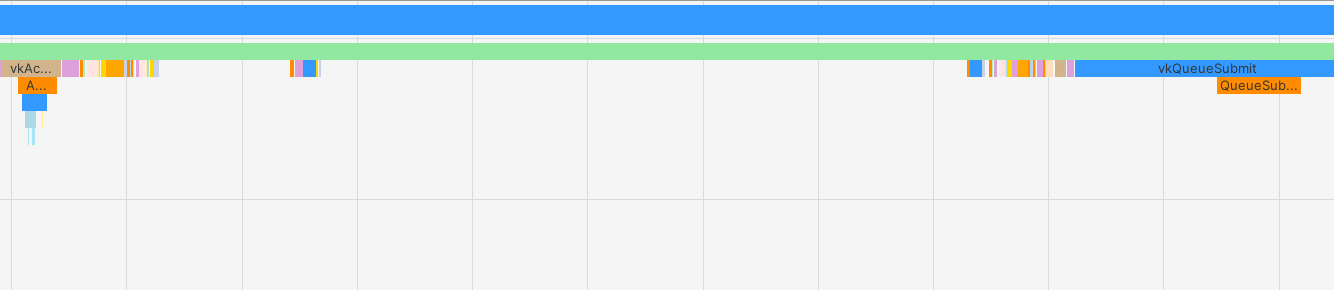
After:
Using the following PerfettoSQL query, we can verify if our changes were effective:
SELECT SUM(dur) / (1000000.0 * 30.0 * 30.0)
FROM slice
WHERE name IN (
   'vkCmdBindDescriptorSets',
   'vkCmdDraw',
   'vkCmdDrawIndexed',
   'vkCmdBindPipeline',
   'vkCmdBindVertexBuffers',
   'vkCmdBindIndexBuffer',
   'vkUpdateDescriptorSets'
);
Without our changes, we get a value of 2.75ms. With them, we get a value of 2.62ms, so we can measure a gain of 0.13ms.
Results
After addressing the points of actions that we found thanks to Android Performance Analyzer, we were able to achieve the following:
- More than 1ms of CPU time saved by batching calls to
vkCmdBindDescriptorSets, which now take (on average) 0.81ms instead of 1.91ms: less than half the previous amount of time. - Great improvements in thermals, doubling time to reach all thermal states and, in case of light thermal state, almost tripling it.
- Refactor font and UI rendering to a more GPU-driven system, removing several API calls and improving scalability of the system.
About The Forge Interactive, Inc.
![]()
The Forge Interactive delivers deep engine-level expertise across rendering, systems, and performance, backed by 17+ years of experience supporting complex, cross-platform development. Whether working on Godot, Unreal, Unity, or custom engines, The Forge provides targeted optimization to full system development, offering flexible, scalable solutions tailored to each project.