
You can view any frame profiles that you've captured previously in the Frame Profiler in Android Performance Analyzer. This guide demonstrates how to use the trace view to interact with recorded data and provides a detailed description of the data presented.
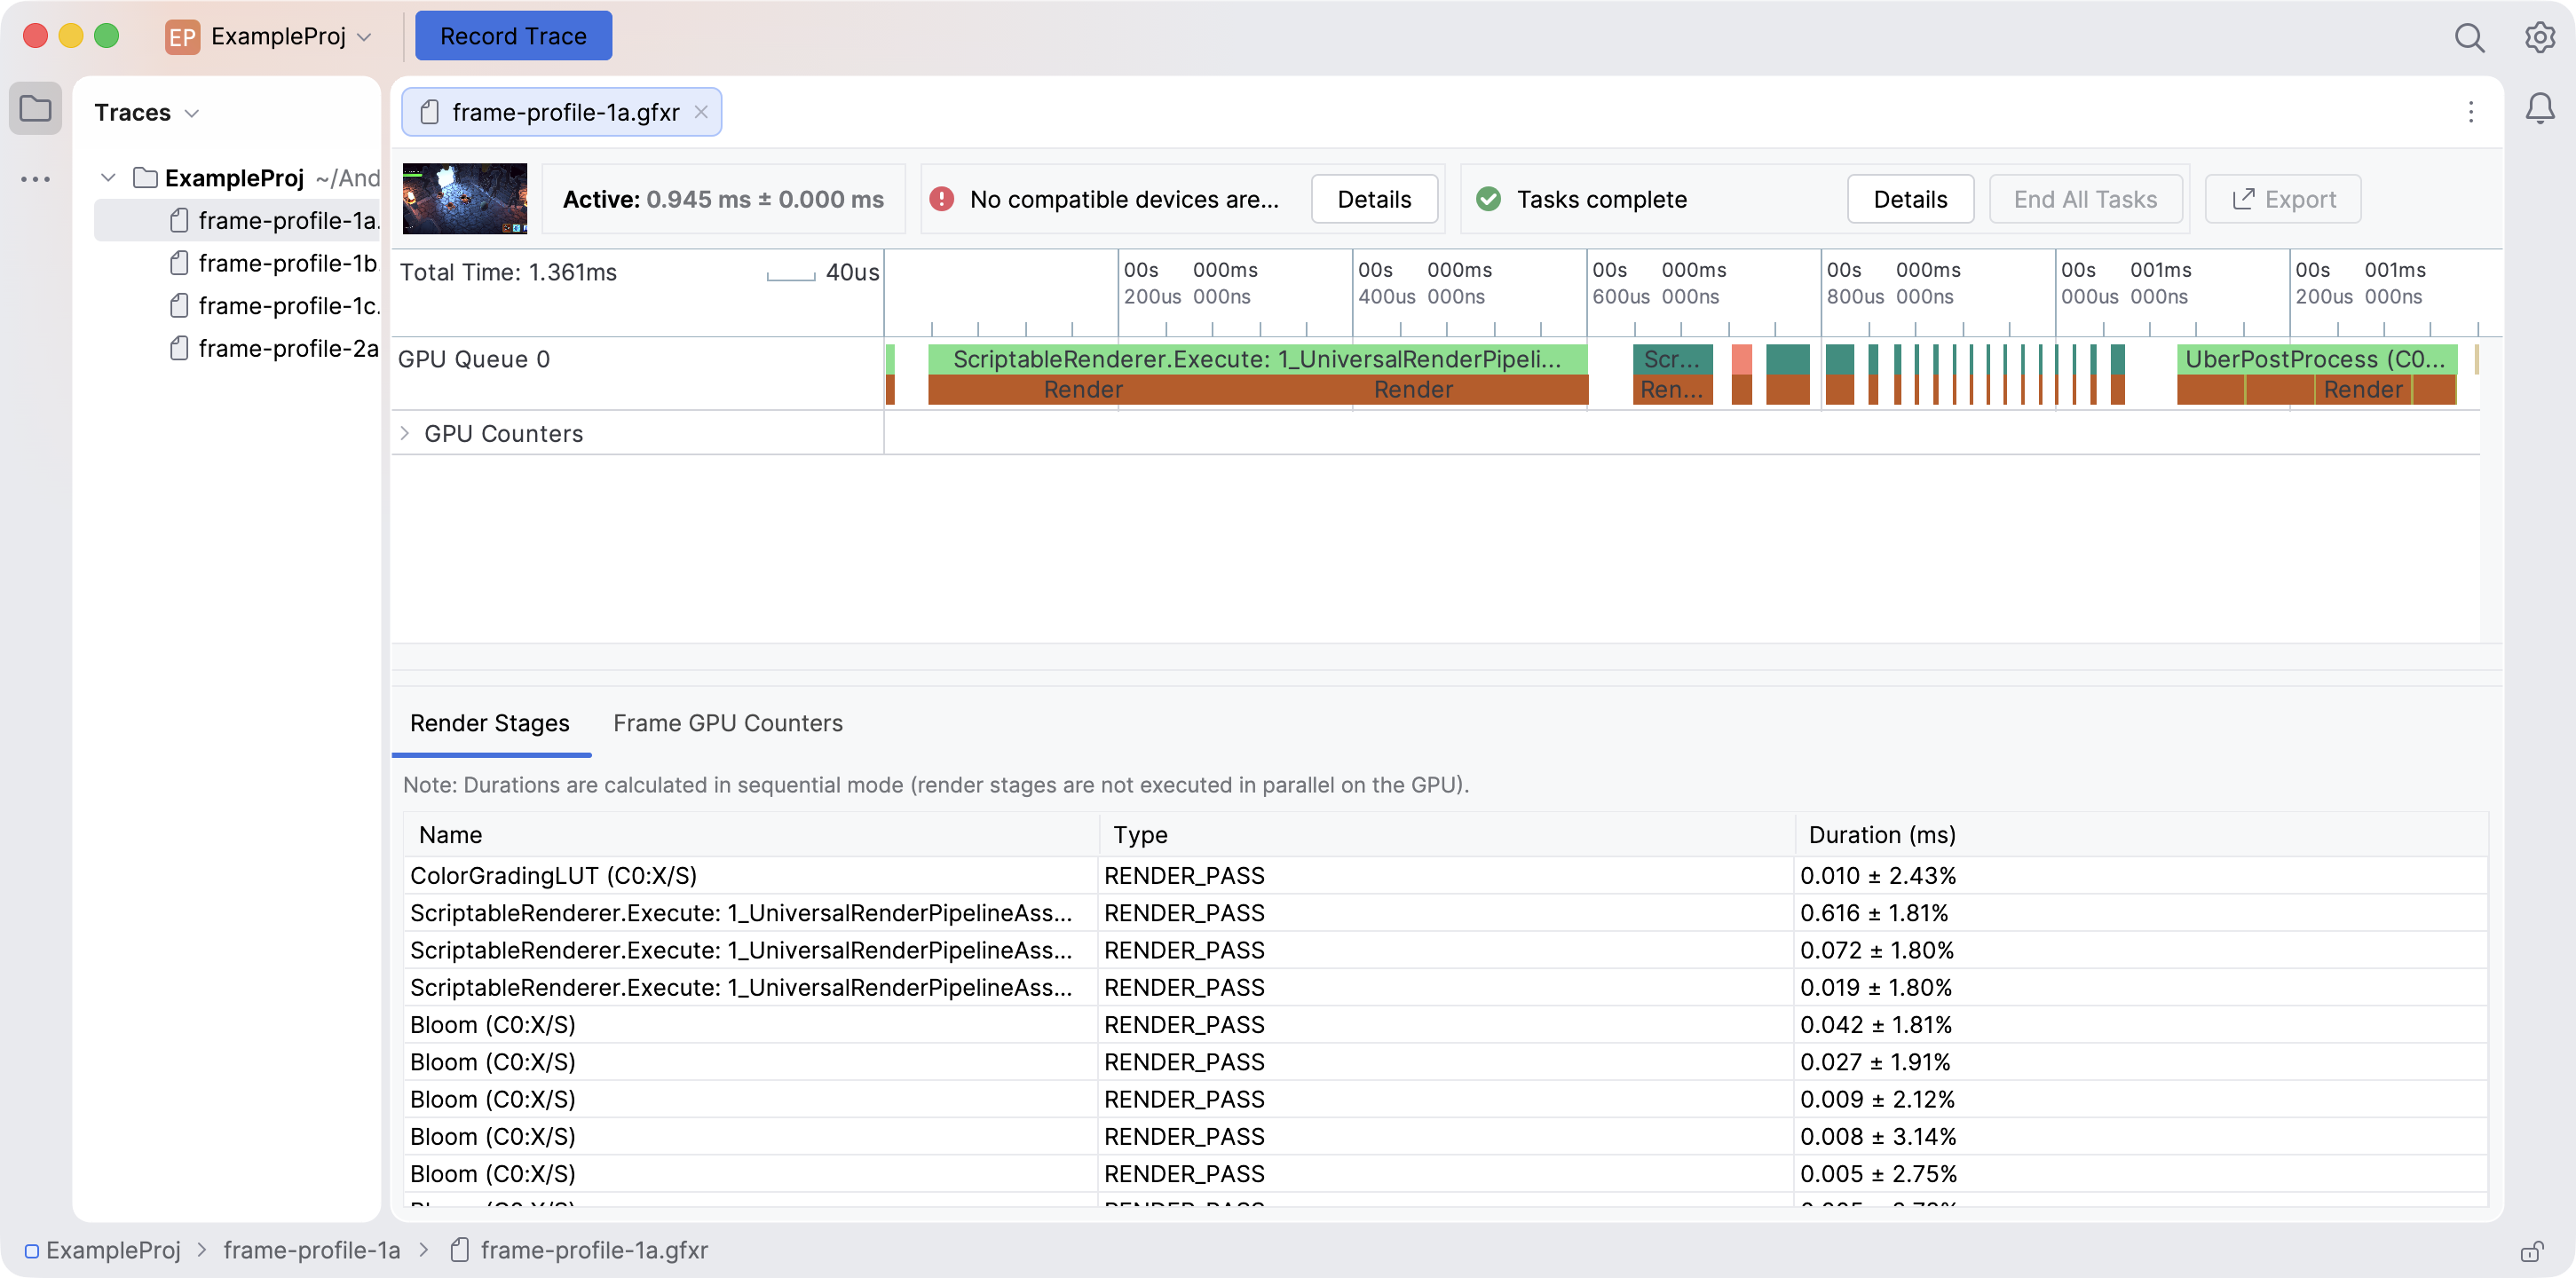
Top bar
The top bar of the frame profile view includes metadata that provides an at-a-glance view of the frame profile as a whole.

Screenshot
The far left side of the top bar is a thumbnail screenshot of the captured frame. You can click on the thumbnail to open a resizable window providing a zoomed-in view of the screenshot.
Frame time
The Active and Total labels present the active and total frame time for the captured frame respectively, as well as the margin of error for each.
Device details
The Device panel indicates whether the testing device originally used to capture the frame profile is connected. Clicking the Details button opens the Device Details window, which shows the device's model name, status, and serial number.
Task details
The Tasks panel shows the status of the profiling tasks involved in taking the GFXR file and using it to generate the data in the frame profile. The Frame Profiler runs these tasks after the initial frame capture; when they're complete, the frame profile should be fully populated.
Clicking the Details button opens the Task Details window, where you can see detailed task status, cancel running jobs, and rerun any failed tasks.
Export
If the device you used to capture the frame profile is still connected, you can
click
 Export to generate an output file that you can export into
RenderDoc for further analysis. Triggering an export starts a
special Export to RenderDoc task; upon successful completion, Android Performance Analyzer
displays a pop-up notification to guide you to the output file in your file
system.
Export to generate an output file that you can export into
RenderDoc for further analysis. Triggering an export starts a
special Export to RenderDoc task; upon successful completion, Android Performance Analyzer
displays a pop-up notification to guide you to the output file in your file
system.
Timeline
The timeline in the top half of the frame profile view behaves like a limited version of the trace view for a system profile: the GPU utilization and counter data for the render time is presented in tracks and track events.

You can use the following keyboard shortcuts to navigate the timeline:
- A and D (or Left and Right) to pan back and forth in the timeline.
- W and S to zoom in or out.
- Up and Down to scroll vertically.
- Hold Shift while using any of these shortcuts to speed up navigation.
You can also navigate by clicking and dragging, by using the scrollbars on the right and bottom sides of the timeline, or by scrolling horizontally and vertically with your trackpad or mouse wheel.
Bottom panel
The detail panel at the bottom of the frame profile view displays information about render stages and GPU counters for the frame.
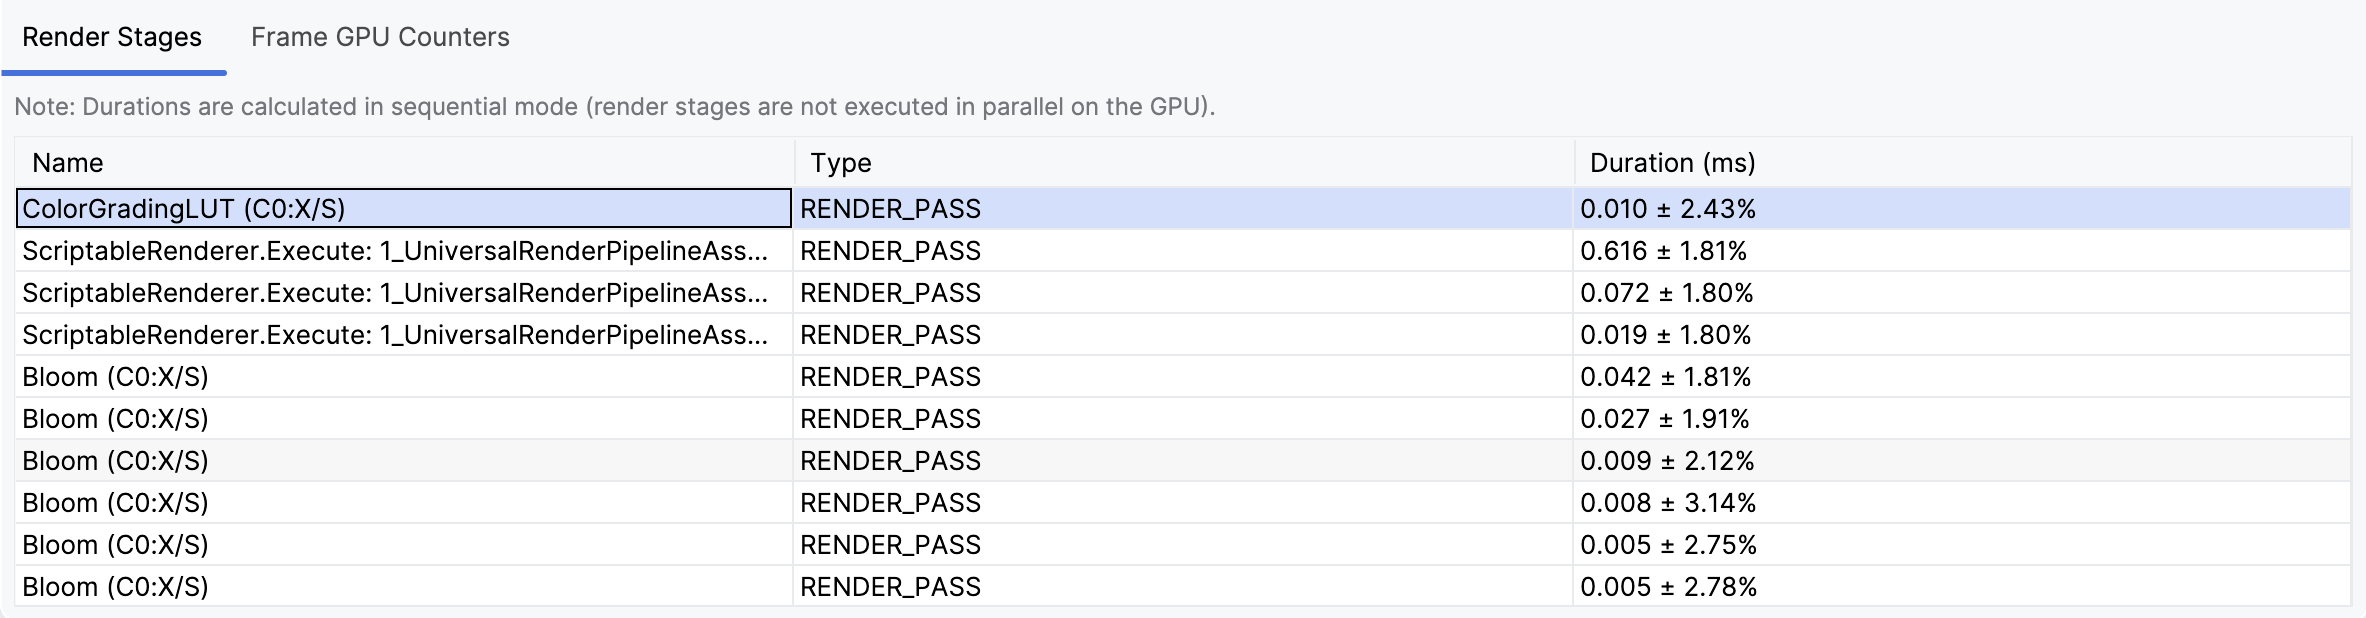
Render stages
The Render Stages tab shows a list of the render events that correspond to the captured frame, as well as a duration and margin of error for each. These render events correspond with the events on the GPU tracks in the timeline.
Frame GPU counters
The Frame GPU Counters tab shows a table with the value and margin of error for all GPU counters measured.
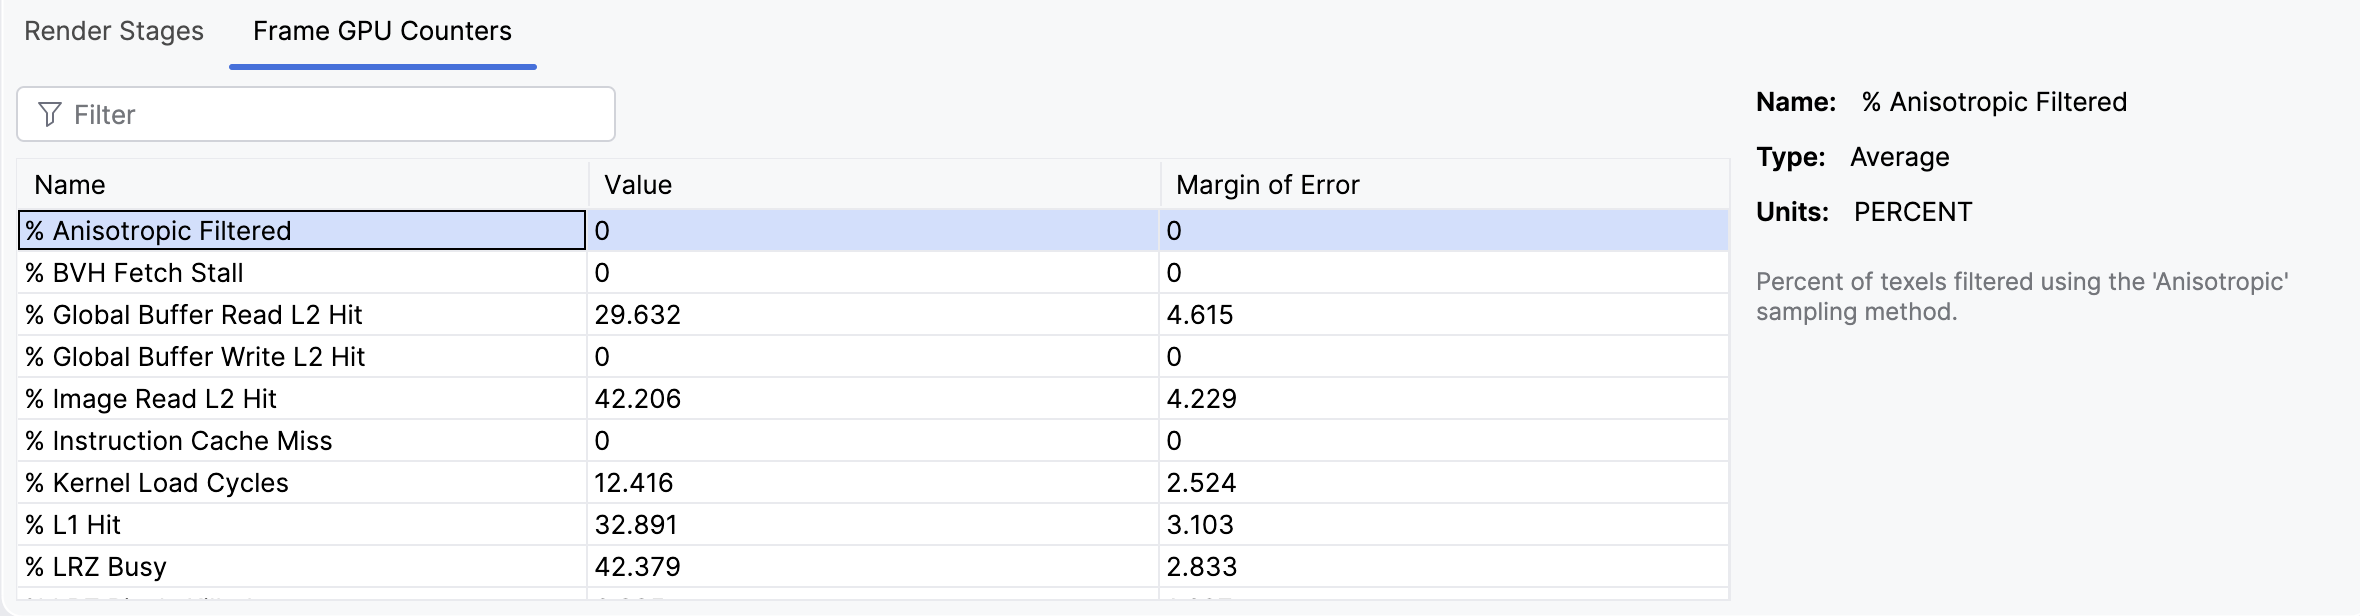
Clicking a row in this table displays further information about the corresponding GPU counter in the detail panel on the right:
- Name. The name of the counter.
- Type. Whether the measured value is a sum or an average for this counter.
- Units. The unit of measurement for this counter.
- Description. A short description of what this counter measures.