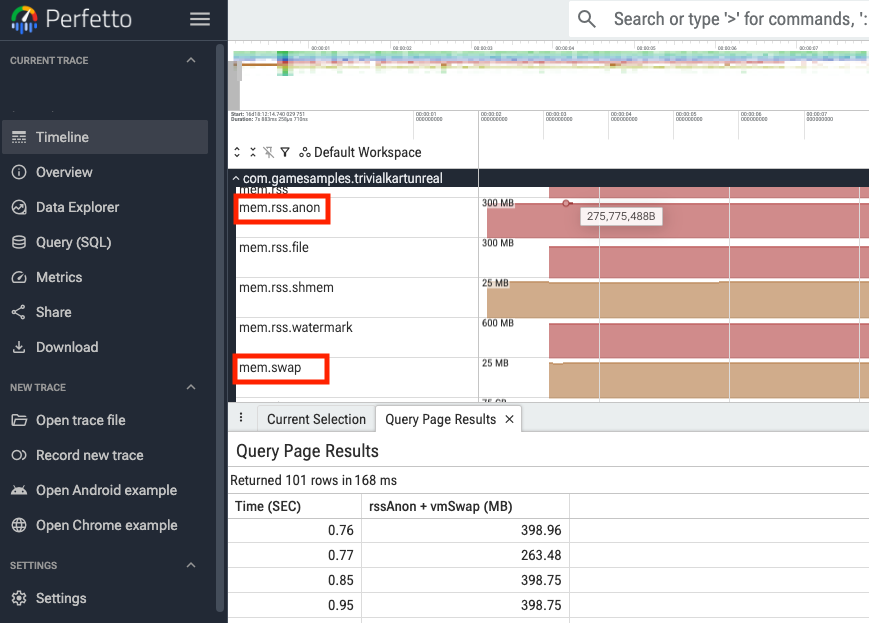
Representing the memory pressure of a process, 'anonymous RSS + swap' is a critical metric for maintaining game stability. It serves as both the memory limit threshold for Memory Limiter (Android 17 and higher) and the standard benchmark for Memory Vitals in Google Play Console.
It's difficult to measure memory usage that exactly matches 'anonymous RSS + swap' either at runtime or statically within the Unreal Engine.
For tracking memory usage, Unreal Engine provides the VmRSS + VmSwap
metric. Even though it's broader than 'anonymous RSS + swap' because
VmRSS includes rssFile and rssShmem, it still serves as a reliable
estimate.
Follow this guidance to analyze your game's memory footprint:
- Query memory using C++ APIs
- Monitor memory using console commands
- Visualize memory with Unreal Insights
- Verify precise memory usage using Perfetto
Query memory using C++ APIs
Use the following C++ APIs to query memory metrics:
Lightweight memory query
Use GetMemoryUsedFast for a lightweight memory query. On Android, this
method returns the estimated footprint by parsing only the necessary
memory fields from /proc/self/status, rather than reading the entire file.
Detailed memory statistics
Use GetStats to query detailed platform memory statistics. This method
provides comprehensive platform memory statistics, returning both
FPlatformMemoryStats.UsedPhysical and FPlatformMemoryStats.RssFile. Since
UsedPhysical is the sum of VmRSS and VmSwap, you can get closer to the
benchmark value by subtracting RssFile from it.
#include "HAL/PlatformMemory.h"

uint64 GetEstimatedPhysicalMemory()
{
  FPlatformMemoryStats Stats = FPlatformMemory::GetStats();

#if PLATFORM_ANDROID
    return Stats.UsedPhysical - Stats.RssFile;
#else
    return Stats.UsedPhysical;
#endif
}
Monitor memory using console commands
Use this approach to monitor memory trends while the game is running on the device. To open the console, tap the screen with four fingers, and then enter the following commands.
| Command | Description |
|---|---|
stat unit |
Displays current aggregate physical memory usage at the Mem row, updated every frame. |
stat unitmax |
Displays average and session peak aggregate physical and virtual memory usage at the Mem row. |
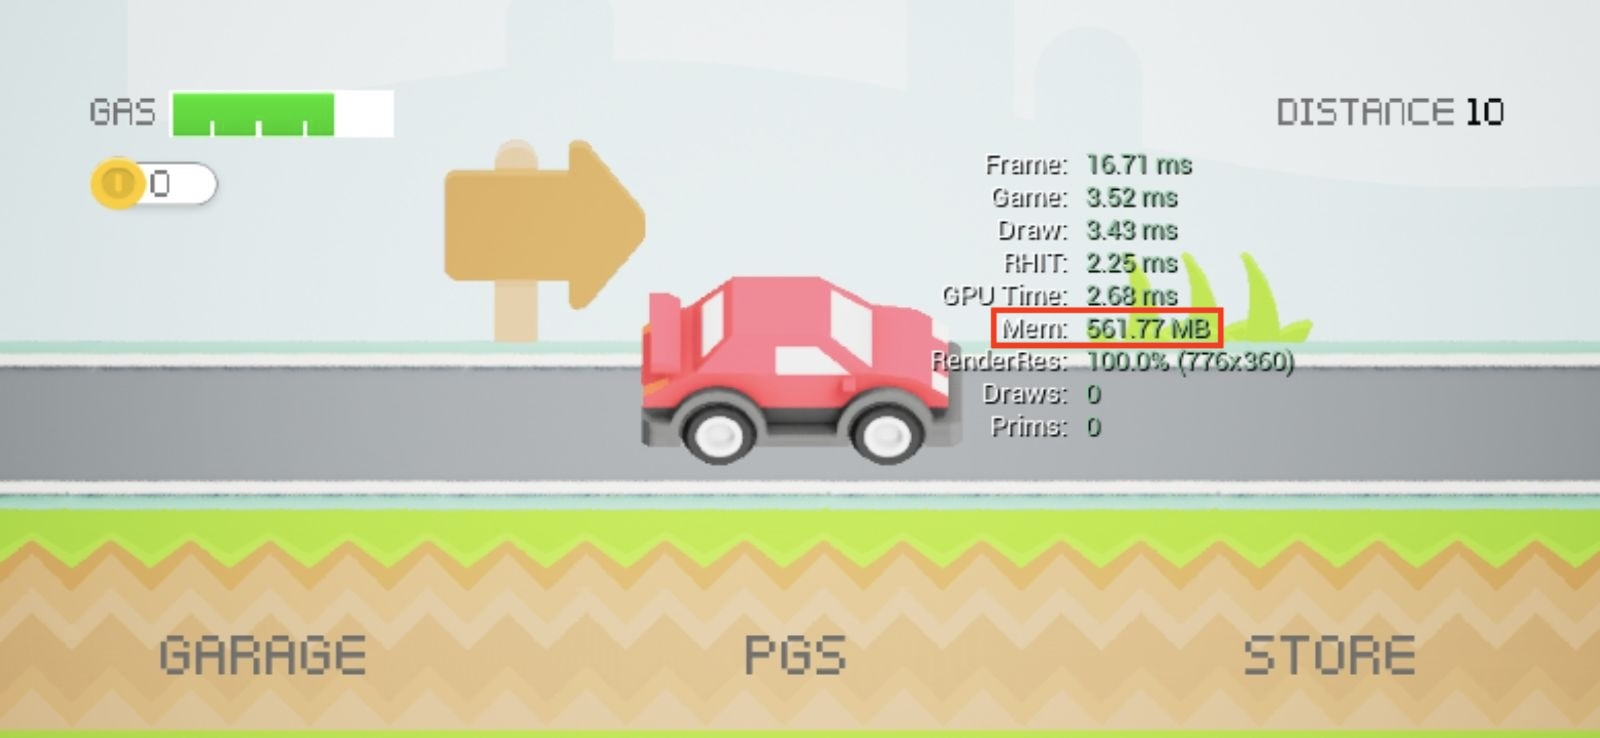
stat unit overlay
displaying the Mem row.
Visualize memory with Unreal Insights
Unreal Insights lets you monitor and visualize memory metrics, such as platform memory stats and custom counters, over time using frame-accurate timeline graphs.
- Connect your device to the Memory Trace Channels with flags that
include
default,countersto view thePlatformMemory/UsedPhysical(VmRSS + VmSwap) graph alongside the frame timeline. - Optional: To track custom memory metrics in more detail, declare and
update a custom trace counter using
TRACE_DECLARE_MEMORY_COUNTERandTRACE_COUNTER_SET.
#include "ProfilingDebugging/CountersTrace.h"

TRACE_DECLARE_MEMORY_COUNTER(Trace_EstimatedPhysicalMemory, TEXT("Memory/EstimatedPhysicalMemory"));

void UpdateMemoryTraceCounter()
{
    // Note: Ensure GetEstimatedPhysicalMemory() is defined as shown
    // in the Query memory at runtime using C++ APIs section.
    TRACE_COUNTER_SET(Trace_EstimatedPhysicalMemory, GetEstimatedPhysicalMemory());
}
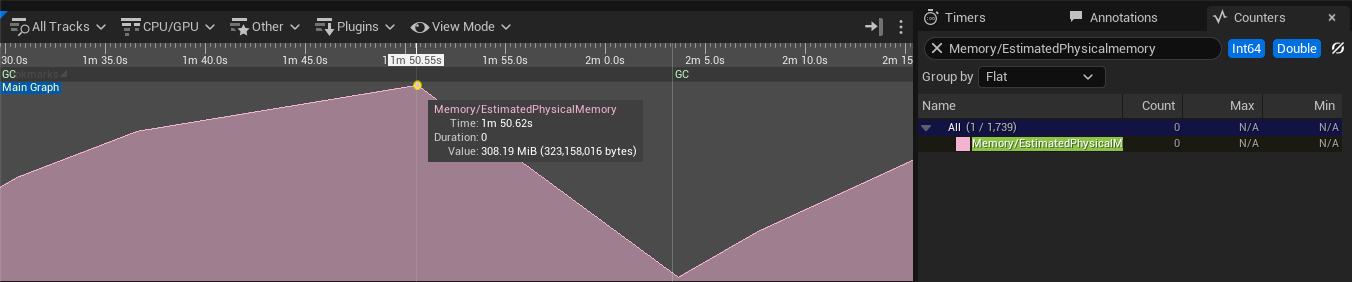
Memory/EstimatedPhysicalMemory counter.
Verify precise memory usage using Perfetto
To verify exact Android OS 'anonymous RSS + swap' values rather than an estimate, use Perfetto. Perfetto captures system-level memory metrics to evaluate your game's exact footprint.